Spitzer Observations of the New Luminous Red Nova M85 OT2006-1
Abstract
M85 OT2006-1 is the latest and most brilliant addition to the small group of known Luminous Red Novae (LRNe). An identifying characteristic of the previously detected events (M31 RV, V4332 Sgr & V838 Mon) was a spectral red-ward evolution connected with an emerging infrared component following the optical decay. Here we report on the discovery of a similar feature in Keck/NIRC and Spitzer photometry of M85 OT2006-1 six months post-eruption. We find that its 2.122 m spectral energy distribution is best described by a black body with effective temperature K and bolometric luminosity L⊙. Assuming spherical geometry, the black body effective radius, R⊙, and corresponding expansion velocity, km s-1, are remarkably similar to the properties of M31 RV 70 days after its eruption. Furthermore, we propose a search strategy for LRNe in the local Universe making use of the longevity of their infrared excess emission and discuss the expected number of events in the Spitzer Infrared Nearby Galaxies Survey.
1 Introduction
M85 OT2006-1 was discovered by the Lick Observatory Supernova Search on 2006 January 7. It appeared as a new transient projected in the outskirts of the lenticular Virgo cluster galaxy M85. The outburst, as observed in the optical, exhibited a plateau with a duration of about two months and reached an absolute peak magnitude of (Kulkarni et al, 2006). Spectroscopic observations indicated that this was neither a classical nova nor a sub-luminous supernova. Instead, its early-time spectrum was consistent with a black body of with narrow H and H emission. Following the plateau-phase, the optical brightness decreased rapidly and the peak emission evolved towards longer wavelengths.
A similar evolution has been observed in three other transients so far; M31RV in Andromeda (Rich et al., 1989) and probably V4332 Sgr (Martini et al., 1999) and the extensively studied V838 Mon (Brown et al., 2002; Munari et al. 2002a, ; Kimeswenger et al., 2002; Bond et al., 2003; Evans et al., 2003) in the Milky Way. Among this small group, M85 OT2006-1 stands out as the most distant and brightest event approaching a bolometric peak luminosity of about L⊙.
While the peak luminosities of the four sources differ, their overall observed properties are indicative of a common eruption mechanism. Thus, they were suggested to be the first members of an emerging class of eruptive transients which was recently dubbed Luminous Red Novae111The terms Luminous Red Variables (Bryan & Royer, 1992), stars erupting into cool supergiants (SECS) (Munari et al. 2002b, ) and Mergebursts (Soker & Tylenda, 2006) were suggested as well. (LRNe; Kulkarni et al, 2006). The cause of the peculiar outbursts still needs to be fully established, although various explanations were proposed. The most favorable scenarios appear to be a stellar merger event in a binary system with small secondary-to-primary mass ratio (Soker & Tylenda, 2003, 2006) or a planetary capture (Retter & Marom, 2003).
One of the most remarkable features of M31 RV and V838 Mon was a strong infrared excess which developed a few months after the eruption (Mould et al., 1990; Lynch et al., 2004)222No infrared observations were obtained for V4332 Sgr within the first four years. It is thus unconstrained whether it showed a similar evolution or not.. This excess emission is commonly associated with condensation of newly formed dust in the expelled envelope around the progenitor star. In this paper we present the results of a near and mid-infrared search for a similar component in M85 OT2006-1.
2 Observations
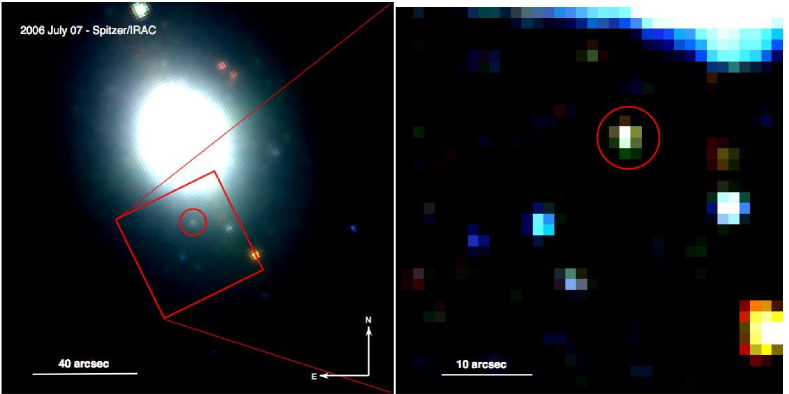
We observed M85 OT2006-1 using the Spitzer Space Telescope Infrared Array Camera (IRAC; Fazio et al., 2004) at 3.6, 4.5, 5.8 and 8 m and the peak-up imaging mode of the Infrared Spectrograph (IRS; Houck et al., 2004) at 15.8 and 22 m in July 2006. See Table 1 for a summary of observations. Standard pipeline post-Basic-Calibrated-Data products were obtained from the Spitzer archive.
A color-composite of the 3.6, 5.8 and 8 m emission is shown in Figure 1 (left). Prior to undertaking photometry we subtracted the local host galaxy emission estimated using the IRAF task mkskycor (Figure 1 right). The flux densities are measured through and apertures for IRAC and IRS, respectively. Aperture corrections were applied according to documented values 333IRAC: http://swire.ipac.caltech.edu/swire/astronomers/publications/SWIRE2_doc_083105.pdf, IRS: http://ssc.spitzer.caltech.edu/irs/pu_fluxcal.txt. See Table 1 for a summary of flux densities and apparent magnitudes.
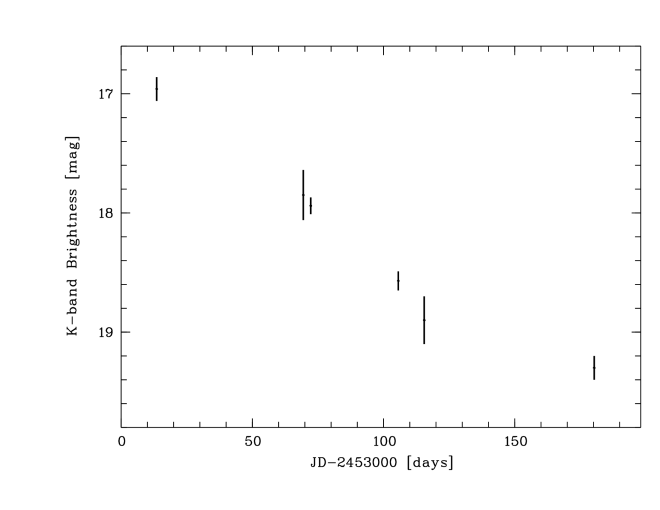
In addition, we obtained simultaneous -band imaging with the Keck Observatory Near Infrared Camera (NIRC; Matthews & Soifer, 1994) under excellent (FWHM=04) conditions. The data were reduced using the near-infrared processing package IRtools for IRAF (D. Thompson, private communication). The host galaxy emission was subtracted as described above and the flux calibration was derived using observations of the standard star SJ 9145 Persson et al. (1998). The flux measurement was obtained using a circular aperture of radius.
3 Results
3.1 -band light curve
3.2 Spectra Energy Distribution
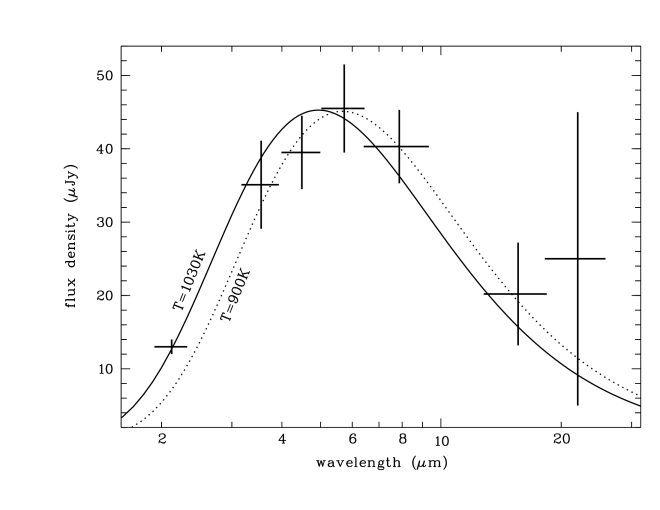
The 2.1 to 22m photometry at 180 days is consistent with a black body with effective temperature, K (; solid line in Figure 3). A fit to the IRAC and IRS data alone suggests a slightly lower temperature, K (; dashed line in Figure 3) and an additional, hotter component leading to a flux surplus at 2.1 m. For the following discussion we will assume a black body temperature of K for the infrared excess emission.
The bolometric luminosity after 180 days (as traced by ) was L⊙ (see Table 2). The corresponding black body radius was R⊙. Using 2006 January 7 as the onset of the eruption, we estimate a mean expansion velocity of km s-1. The total emitted radiation energy is erg, dominated by the optical plateau during the first three months.
4 Discussion and Conclusion
We have presented the discovery of a strong 3.6–22 m excess in M85 OT2006-1 at 180 days.
This thermal infrared component suggests dust condensation in the matter expelled during the eruption, similar to M31 RV (Mould et al., 1990) and V838 Mon
(Kimeswenger et al., 2002; Lynch et al., 2004).
The derived photospheric properties of M85 OT2006-1 are resembled closest by those of M31 RV. For the latter a 1000 K dust shell with a radius of R⊙ was reported after 70 days (Mould et al., 1990, see Table 2 for a comparison). Similar to M85 OT2006-1, M31 RV showed a nearly perfect black body component with only a faint excess at shorter wavelengths. Also V838 Mon displayed a single-component black body emission during the first 120 days (cf., Tylenda, 2005). At this time it’s effective temperature, K, and radius, R⊙, differed significantly from those of M85 OT2006-1 and M31 RV, though. However, V838 Mon was initially hotter ( K) and exhibited at least two eruption phases (Munari et al. 2002a, ). Furthermore it resides possibly in a binary with a bright B3 V star (Munari et al. 2002c, ), making the interpretation of the observed quantities difficult.
Assuming a spherical geometry for M85 OT2006-1, we inferred a mean expansion velocity of km s-1 in June 2006. This value is surprisingly similar to the one derived for M31 RV at comparable ( km s-1, see Table 2). However, km s-1 in M85 OT2006-1 is significantly larger than the velocity obtained from the H line width in February 2006 ( km s-1; Kulkarni et al, 2006). A solution to this apparent discrepancy lies in the source geometry. In case of an a-spherical expansion, e.g. an oblate geometry observed face-on, the velocity ( black body radius), may be overestimated. Alternatively, the large velocity inferred from the infrared observations, can be caused by radiative acceleration as a result of a long lasting engine activity or multiple phases of energy injection into the expanding material. Furthermore, the Balmer emission may have originated in a low velocity region unrelated to the matter which produced the late time black body component.
In V838 Mon the shell became partly transparent after 120 days. Furthermore, the temperature slowly increased again after 250 days, possibly as the result of a gravitationally induced collapse of the inflated envelope (Tylenda, 2005). A similar behavior was also reported for V4332 Sgr about nine years after its eruption (Tylenda et al., 2005). Whether or not M85 OT2006-1 will evolve alike, needs to be addressed with future infrared observations.
Most of our knowledge on LRNe prior to our analysis was based on detailed studies of a single event, V838 Mon. Here we have shown that variations in the infrared evolution exists among the small sample of sources. Whether the cause of these variations lies in the progenitor, environment or some other unnamed parameter remains to be solved. Indeed, already the underlying stellar populations are not uniform. While V838 Mon resides within a B-star cluster (Afşar & Bond, 2006), M85 OT2006-1 (Kulkarni et al, 2006), M31 RV (Rich et al., 1989) and V4332 Sgr (Tylenda et al., 2005) probably originated from low-mass stars. However, it is clearly premature to speculate on a possible bimodality here.
The next step forward requires a significant increase of the LRNe sample. Estimates based on the few known events suggest rates of approx. a dozen per year out to a distance of 20 Mpc (Kulkarni et al, 2006). Similar predictions come from the theory of violent mergers of both massive and low mass stars (Soker & Tylenda, 2006). Thus, a dedicated search for LRNe is expected to net a substantial number of new events and may revolutionize our understanding of these elusive transients.
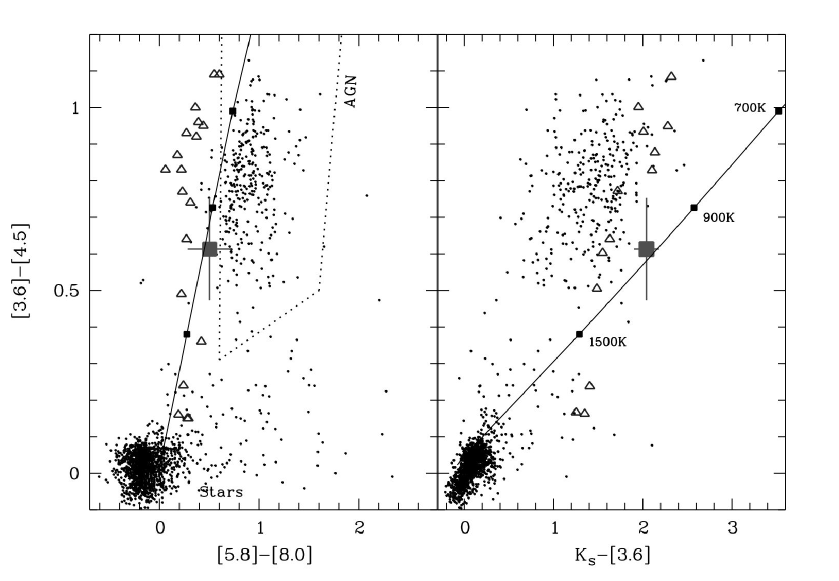
A promising strategy to detect new LRNe similar to M85 OT2006-1 and M31 RV is to make use of their characteristic infrared emission properties. The IRAC colors of a K black body can easily be discriminated from the majority of known stellar objects, AGN and unresolved galaxies (Figure 4 left). Only early-type T-dwarfs (T2–T4; Patten et al., 2006), which have similar , exhibit comparable 3.68 m colors. However, the latter can be identified by their strong molecular absorption bands in the near-infrared (e.g., CH4, H20; for a recent review see Kirkpatrick, 2005), which also lead to significant deviations from a perfect black body spectrum (offset from black body line in Figure 4).444We note that V838 Mon revealed strong absorption bands (e.g., H2O, CO, OH, SH; Lynch et al., 2004) after year together with a hot continuum ( K) inconsistent with a simple black body. Thus, it would have been difficult to identify by its infrared colors alone. Whether this is caused by intrinsic or environmental differences with respect to M85 OT2006-1 and M31 RV or only the result of a slower evolution is unconstrained.
The main advantage of searching in the infrared is that the detection probability is increased with respect to optical searches by the ratio of infrared-bright time (a few years) to optical plateau duration (a few months). Using the predictions of Soker & Tylenda (2006) of approx. one LRN per galaxy every 10-50 years, we can estimate the number of anticipated events in an existing sample like the Spitzer Infrared Nearby Galaxies Survey (SINGS; Kennicutt et al., 2003). SINGS comprises IRAC observations of 75 galaxies within 30 Mpc (mean distance 9.5 Mpc) with sensitivities similar to the observations presented here. We predict that a search in the archival data using the described color criterion might lead to the detection of as much as 1-10 new LRN events. A similar number of events could be found in a large survey of nearby galaxies using the deep imaging mode of Akari (ASTRO-F; Matsuhara et al., 2005).
We close the paper by emphasizing that the search for stellar mergers can be expected to have a substantial impact over the next years. Similar to the history of the field of gamma-ray bursts, a large increase of well studied events is anticipated to lead to exciting new insights into this emerging family of enigmatic transients.
References
- Afşar & Bond (2006) Afşar, M. & Bond, H. E. 2006, ArXiv Astrophysics e-prints
- Bond et al. (2003) Bond, H. E., Henden, A., Levay, Z. G., et al. 2003, Nature, 422, 405
- Brown et al. (2002) Brown, N. J., Waagen, E. O., Scovil, C., et al. 2002, IAU Circ., 7785, 1
- Bryan & Royer (1992) Bryan, J. & Royer, R. E. 1992, PASP, 104, 179
- Evans et al. (2003) Evans, A., Geballe, T. R., Rushton, M. T., et al. 2003, MNRAS, 343, 1054
- Fazio et al. (2004) Fazio, G. G., Hora, J. L., Allen, L. E., et al. 2004, ApJS, 154, 10
- Houck et al. (2004) Houck, J. R., Roellig, T. L., van Cleve, J., et al. 2004, ApJS, 154, 18
- Kennicutt et al. (2003) Kennicutt, Jr., R. C., Armus, L., Bendo, et al. 2003, PASP, 115, 928
- Kimeswenger et al. (2002) Kimeswenger, S., Lederle, C., Schmeja, S., et al. 2002, MNRAS, 336, L43
- Kirkpatrick (2005) Kirkpatrick, J. D. 2005, ARA&A, 43, 195
- Kulkarni et al (2006) Kulkarni, S. R., Ofek, E. O., Rau, A., et al. 2006, Nature, submitted
- Lynch et al. (2004) Lynch, D. K., Rudy, R. J., Russell, R. W., et al. 2004, ApJ, 607, 460
- Martini et al. (1999) Martini, P., Wagner, R. M., Tomaney, A., et al. 1999, AJ, 118, 1034
- Matsuhara et al. (2005) Matsuhara, H., Shibai, H., Onaka, T., et al. 2005, Advances in Space Research, 36, 1 091
- Matthews & Soifer (1994) Matthews, K. & Soifer, B. T. 1994, in ASSL Vol. 190: Astronomy with Arrays, The Next Ge neration, ed. I. S. McLean, 239–+
- Mould et al. (1990) Mould, J., Cohen, J., Graham, J. R., et al. 1990, ApJ, 353, L35
- (17) Munari, U., Henden, A., Kiyota, S., et al. 2002a, A&A, 389, L51
- (18) Munari, U., Henden, A., Corradi, R. M. L., & Zwitter, T., 2002b, in AIP Conf. Proc. Vol. 637: Classical Nova Explosions, ed. M. Hernandez & J. Jose, 52–+
- (19) Munari, U., Desidera, S., & Henden, A. 2002c, IAU Circ., 8005, 2
- Patten et al. (2006) Patten, B. M., Stauffer, J. R., Burrows, A., et al. 2006, ApJ, 651, 502
- Persson et al. (1998) Persson, S. E., Murphy, D. C., Krzeminski, W., et al. 1998, AJ, 116, 2475
- Retter & Marom (2003) Retter, A., & Marom, A., 2003, MNRAS, 345, L25
- Rich et al. (1989) Rich, R. M., Mould, J., Picard, A., et al. 1989, ApJ, 341, L51
- Sanders et al. (2007) Sanders, D. B., Salvato, M., Aussel, H., et al. 2007, ApJS, submitted
- Soker & Tylenda (2003) Soker, N. & Tylenda, R. 2003, ApJ, 582, L105
- Soker & Tylenda (2006) —. 2006, MNRAS, 1202
- Stern et al. (2005) Stern, D., Eisenhardt, P., Gorjian, V., et al. 2005, ApJ, 631, 163
- Tylenda (2005) Tylenda, R. 2005, A&A, 436, 1009
- Tylenda et al. (2005) Tylenda, R., Crause, L. A., Górny, S. K., et al. 2005, A&A, 439, 651
| Start UTC | Instrument | Filter | Exposure | Flux density | Brightness |
|---|---|---|---|---|---|
| [m] | [s] | [Jy] | [Vega mag] | ||
| 2006 July 6.28 | Keck/NIRC | 2.1 | 1200 | 131 | 19.30.1 |
| 2006 July 7.06 | Spitzer/IRAC | 3.6 | 3000 | 356 | 17.20.1 |
| 2006 July 7.06 | Spitzer/IRAC | 4.5 | 3000 | 405 | 16.60.1 |
| 2006 July 7.06 | Spitzer/IRAC | 5.8 | 3000 | 466 | 16.00.1 |
| 2006 July 7.06 | Spitzer/IRAC | 8.0 | 3000 | 405 | 15.5 |
| 2006 July 2.12 | Spitzer/IRS | 15.6 | 3000 | 207 | 14.9 |
| 2006 July 2.12 | Spitzer/IRS | 22.0 | 3000 | 2520 | 14.0 |
| Source | |||||||
|---|---|---|---|---|---|---|---|
| [ L⊙] | [ K] | [ R⊙] | [ L⊙] | [ K] | [ R⊙] | [km s-1] | |
| M85 OT2006-1bb peak values from Kulkarni et al (2006). Late time values this paper | 870 | ||||||
| M31 RVcc peak luminosity from Rich et al. (1989). Remaining values from Mould et al. (1990) |