Interferometric Observations of RS Ophiuchi and the Origin of the Near-IR Emission
Abstract
We report observations of the recurrent nova RS Oph using long-baseline near-IR interferometry. We are able to resolve emission from the nova for several weeks after the February 2006 outburst. The near-IR source initially expands to a size of milli-arcseconds. However, beginning around day 10 the IR source appears to begin to shrink, reaching milli-arcseconds by day 100. We combine our measured angular diameters with previously available interferometric and photometric data to derive an emission measure for the source, and hence are able to determine the mass-loss rate of the nova in the days following the outburst.
1 Introduction
When a massive white dwarf (WD) accretes matter from a nearby star, the material accumulates on the surface under increasing temperatures and pressures. Once conditions for a thermonuclear runaway reaction are met the system erupts as a nova (Prialnik & Kovetz, 2005); the luminosity increases by – magnitudes over a few days or weeks, and the system ejects mass in a strong, optically thick wind. In most cases, the cycle repeats on timescales that depend on the mass of the WD and the accretion rate – “classical novae” recur with periods of years, while “recurrent novae” erupt on decadal timescales. It has been argued (Hachisu et al., 1999; Hachisu & Kato, 2001) that recurrent novae systems are the progenitors of Type Ia supernovae, as models of the explosions indicate that the WD should be very close to the Chandrasekhar limit, and that the WDs in these systems are gaining more mass from the accretion than they are losing from the outbursts (Kato & Hachisu, 2004).
RS Oph (HD 162214) is a recurrent nova which has undergone 6 recorded outbursts since 1898, including eruptions in 1985 (Bode, 1987) and most recently in February 2006 (Narumi et al., 2006). In this system, the WD has a red giant (RG) companion in a 460-day period circular orbit (Fekel et al., 2000); mass loss from this companion provides fuel for the quiescent-state WD accretion disk as well as a stellar wind that interacts with the nova blast wave. Extensive observations of the two most recent outbursts have been carried out at wavelengths ranging from X-rays (Sokoloski et al., 2006; Bode et al., 2006) to radio (Eyres et al., 2006).
It should be noted that there has been some confusion as to the true distance to the RS Oph system: most workers derive or assume a distance of kpc, based primarily on radio observations (Hjellming et al., 1986; Bode, 1987; Sokoloski et al., 2006). However, recent models (Hachisu & Kato, 2000) of this system indicated a distance of 0.6 kpc; Monnier et al. (2006) noted that if the distance were indeed that small it might be possible to resolve the two components of the system (the red giant –RG– and the puffed-up WD). However, recently Hachisu et al. (2006) revised their models and now find a distance of 1.3–1.7 kpc. We will therefore take the system distance to be 1.6 kpc.
Recently, Monnier et al. (2006) used long-baseline infrared interferometry to resolve the emission from the outburst. They find that the emission is consistent with a source that is larger than the binary system. Here we report on observations of the RS Oph system using the Palomar Testbed Interferometer (PTI) on 15 nights following the 2006 outburst. We are able to resolve the emission on milli-arcsecond (mas) scales and can place limits on the emission mechanism, including the possibility that the emission is from the binary components. PTI was built by NASA/JPL as a testbed for developing ground-based interferometry and is located on Palomar Mountain near San Diego, CA. It combines starlight from two out of three available 40-cm apertures and measures the resulting interference fringes. The angular resolution provided by this long-baseline (85-110 m), near infrared (m) interferometer is approximately 4 mas. A complete description of the instrument can be found in Colavita et al. (1999).
2 Observations & Models
We observed RS Oph on 15 nights between 24 March 2006 and 13 June 2006 (covering the period from 40 to 121 days after the outburst). Data from 3 of these nights have been previously published in Monnier et al. (2006) together with data from the IOTA (Traub et al., 2000) and Keck interferometers (Colavita et al., 2003). We include all of these observations in subsequent fits to help constrain models of this source. In addition to the data obtained after the 2006 outburst, we present data from an observation of the RS Oph system taken on 22 May 2003, i.e. before the outburst.
PTI operates using one interferometric baseline at a time. On the 2003 night and 8 of the 2006 nights RS Oph was observed using the North-West baseline, the remaining observations were done using the South-West baseline. The observing wavelength was 2.2 m (K band; note that the IOTA data were obtained in the H band – m – which may complicate inter-comparisons of the data sets.) Observations on the first 8 nights were done using a fringe-tracking integration time of 20 ms, but as the source faded the integration time had to be increased to 50 ms. We made use of the “coherent integration” mode described in Colavita (1999b); the coherent integration mode provides better performance at low flux levels. We also performed model fits to the incoherently averaged data output and verified that they gave consistent answers (but with larger uncertainties.)
Each nightly observation with PTI consisted of one or more 130-second integrations during which the normalized fringe visibility of the science target was measured. These visibilities were calibrated by dividing them by the point-source response of the instrument, determined by interleaving observations of a calibration source: HD 161868 (A0V, , mas). The angular diameter of the calibration source was determined by fitting a black-body to archival broadband photometry. For further details of the data-reduction process, see Colavita (1999b) and Boden et al. (2000). The calibrated data, averaged by night, were listed in Table 1; though given as averages, the fits to the models were done using the individual data points.
The normalized fringe visibility obtained from an interferometer is related to the intensity distribution on the sky via the van Cittert-Zerneke theorem. For simple parametric models such as uniform disks, gaussians or binary sources we use the procedure outlined in Eisner et al. (2003) to generate models that can be fit to the observations. We perform least-squares fits of these models to the observed fringe visibilities.
It is important to note that the IOTA data published by Monnier et al. (2006) indicate a non-zero closure phase; this implies that the emission is not point-symmetric. However, the amplitude of the signal ( degrees) also indicates that the degree of asymmetry is not very large on scales resolved by that interferometer. PTI, being a single-baseline interferometer, is not able to measure closure phases and therefore any model fits will have a 180-degree ambiguity in position angle. We will consider intrinsically asymmetric models (e.g. binaries), as well as symmetric ones – in the latter case recognizing that the model can only provide an approximation of the true intensity distribution.
3 Results
3.1 Post-Outburst Observations
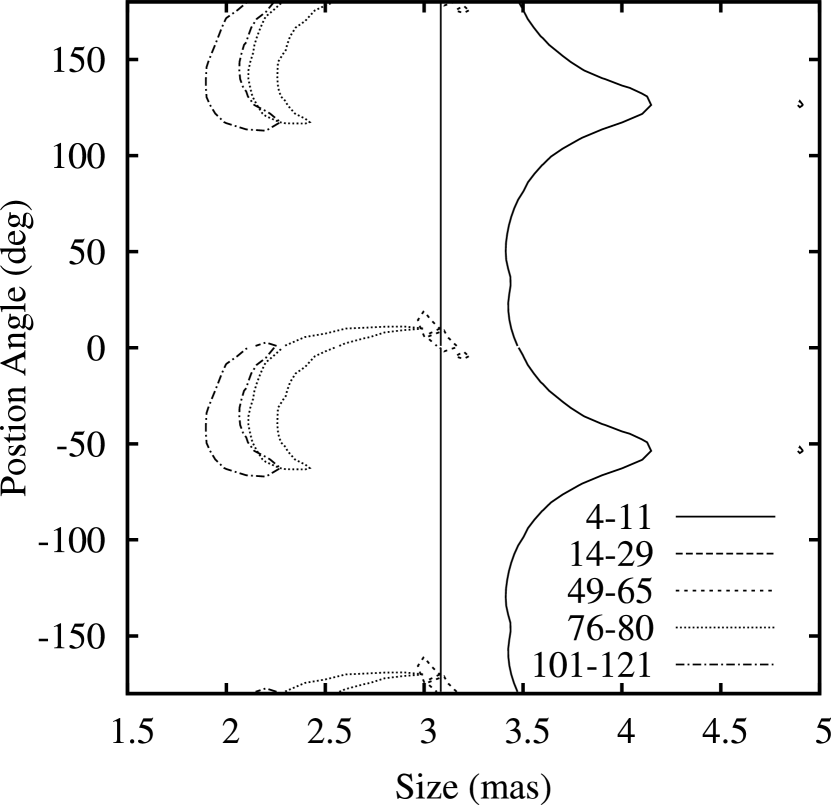
We find that the data can be reasonably well fit by a simple elliptical Gaussian model (Table 2); the fit is further improved when the parameters are allowed to vary slowly in time. Given that all the PTI data from any given night are limited to a single baseline, it is not possible to constrain complex models such as elliptical Gaussians on a night-by-night basis. We therefore group the available data into sets of several nights, comprising observations using multiple baselines, and fit for size, aspect ratio and position angle of the long axis. Results are shown in Table 2 and Figure 1. The surface indicates that the emission morphology first expanded in size, with a position angle of degrees; subsequently the orientation changes to and the source begins contracting. The apparent angular diameter of the major axis reaches 5 mas at maximum extent, but contracts to 2 mas by day 100. It should be emphasized that that these observations trace the emission and not the material itself; as will be discussed in Section 4 the apparent contraction does not necessarily require infall of material.
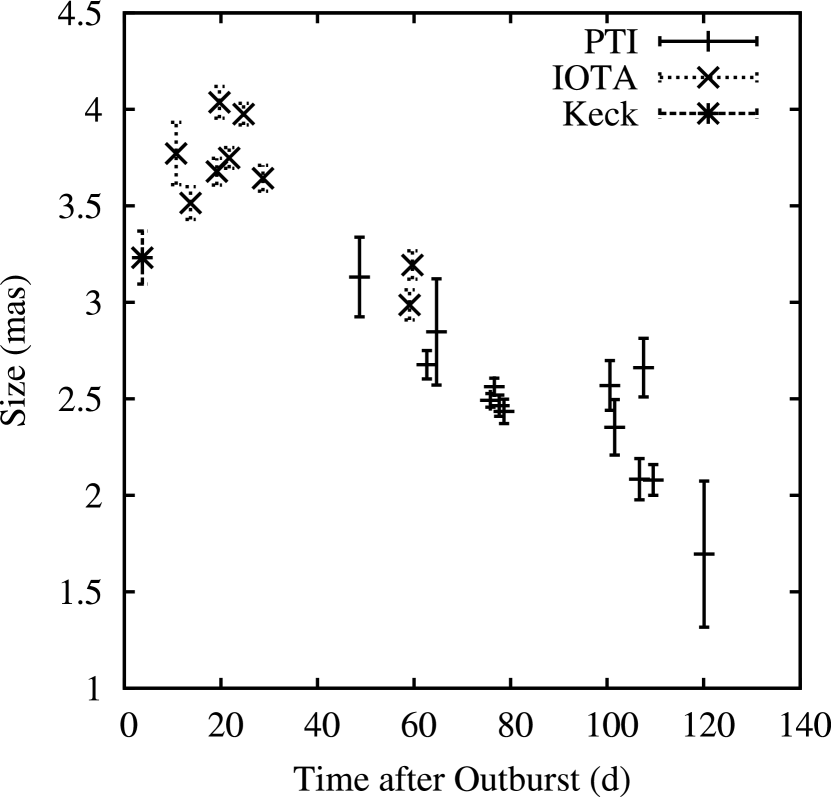
We explore the changing angular size of the emission by constraining the aspect ratio to the best overall value (Major/Minor = 1.4) and position angle (PA=0) of the models and fitting for the size of the corresponding elliptical gaussian on a night-by-night basis. The results are shown in Figure 2.
It is also possible to fit the data from each epoch using a two-component model (indeed there is a degeneracy between a partially resolved two component model and an elongated disk). Monnier et al. (2006) find that their early-epoch RS Oph data are consistent with a pair of components separated by mas. However, if one is in fact seeing a ”reborn” binary then the two-component model should obey a Keplerian constraint. Hence we fit a Keplerian binary model constrained to the orbital period (P=460 days), eccentricity (0) and epoch () determined by radial velocity observation (Fekel et al., 2000). We search for the best-fit semi-major axis, inclination, longitude of ascending node, and component intensity ratio. We find no acceptable fit with a semi-major axis smaller than 2.3 mas, corresponding to AU. Thus we conclude that we cannot be seeing the binary itself.
3.2 Pre-Outburst Observations
The observation in 2003 is comparatively limited in that it comprises only two 130-second integrations on one night, using a single baseline. The resulting -plane coverage is so limited as to preclude meaningful fits to anything but the simplest uniform disk model. However, the data are consistent with a single essentially unresolved source with an angular diameter of milli-arcseconds (the large error bar comes from the fact that ).
4 Discussion
The interferometric observations from IOTA and PTI directly constrain certain aspects of the near-IR emission. First, the shortest baseline data (from IOTA, baseline length meters) taken on days 4–11 indicate a fringe contrast near unity (; see Fig 1 in Monnier et al. 2006). This places an upper limit on the amount of emission that can be coming from a source larger than the interferometric field of view ( arcsec for IOTA). That upper limit is %. Second, the long-baseline observations indicate that the source is in fact resolved; for the longest baselines , indicating a size on the order of mas. For reference, the blast wave from the nova expanded at (Sokoloski et al., 2006), implying an angular diameter of mas by day 4, and an expansion rate of mas/day.
Let us now consider the source of the observed extended near-IR emission. Given the measured angular size scale of mas, the physical scale is AU, slightly larger than the expected orbital separation of 1 AU (Fekel et al., 2000). One possible source of extended near-IR emission is blackbody radiation from optically thin dust surrounding the RS Oph system. However, recent spectroscopic observations in the near- and mid-IR have not found any evidence for dust emission (Russell et al., 2006). In addition, we point out that if there were dust, it is hard to explain the apparent contraction of the emission source; if the dust is evaporating it would likely evaporate from the inner regions first - yielding an ”expanding ring” morphology.
Another possible source of the extended near-IR emission is the post-outburst wind emanating from the nova. It is expected that after the initial explosion shell material on the WD will undergo hydrogen burning for weeks to months; the energy thus liberated will cause most of the shell material to leave the WD in a strong stellar wind (Kato & Hachisu, 1994). Radio observations of the ejecta indicate an asymmetric morphology with a jet-like feature at a position angle near 90 deg; this is reasonably consistent with the inital elongation seen in our data (P.A. ) that may represent the base of that jet (O’Brien et al., 2006). In this scenario the initial elongation would represent faster-moving material leaving along the polar axis of the system; subsequent, slower material would be concentrated along the system orbital plane. It is important to remember that the mere fact that the emission region appears to shrink does not necessarily imply that the material is falling in; what we are seeing is the effective photospheric diameter, which is a function of the density of the material. If the mass-loss rate from the WD drops then the apparent photospheric radius would be expected to shrink even as the material continues flowing outward.
A post-nova wind would be expected to radiate free-free, bound-free and line emission (Rybicki & Lightman, 1979; Pearson et al., 2005), and proper treatment would require a full photo-ionization model. However, a simplified treatment using only the free-free emission should be adequate for initial mass estimates; in particular it should produce an upper limit. In this context we note that PTI is equipped with a low-resolution spectrometer which disperses light in the K band across 5 channels, providing both photometry and fringe visibilities in each channel. A close inspection of the spectrally resolved data reveals no significant change in fringe visibility, nor any significant excess emission, in the channels that would contain known strong emission lines (e.g. Br, 2.166 m); the level of photometric uncertainty is %. This does not exclude line emission, but indicates that the total flux seen by PTI is dominated by continuum emission. This is consistent with previously measured equivalent widths in the Br line (Callus et al., 1986). It is also consistent with H and K-band IR spectra by Evans et al. (2006) which indicate that the line/continuum ratio is in the range 10–30 % in the period from 11 to 55 days after the eruption (with the ratio decreasing over time).
We use previously published IR photometry (Evans et al., 1988) and reddening estimates of from Snijders et al. (1985), obtained during the 1985 outburst to constrain the emission model, justified by the fact that we find that the 1985 light curve is consistent with the 2006 K-band light curve as measured by PTI. In addition to the postulated wind emission source, there are other sources of IR radiation: the M-giant companion and possibly the WD accretion disk. However, we expect that the accretion disk will in fact be disrupted by the nova and not reform for year, based on the fact that the post-outburst light-curve drops below the mean long-term intensity, and the cessation of rapid flickering that is usually associated with accretion disks (Evans et al., 1988; Zamanov et al., 2006). We are therefore only left with the M-giant companion; we attribute all of the near-IR emission at the minimum intensity point in the light-curve to it.
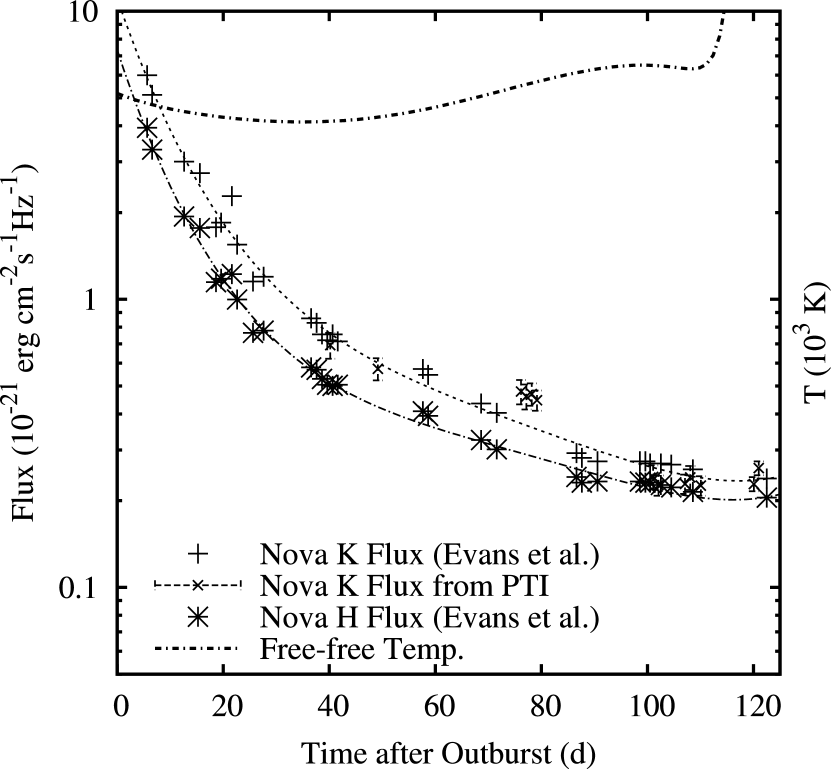
After subtracting the flux from the companion, we derive the H and K-band intensities of the nova source. The H/K flux ratio thus derived can be used to determine the emission temperature for the thermal Bremsstrahlung process ( neglecting variations in the Gaunt factors); this yields a temperature in the range of K (Fig 3). Note that for an apparent angular diameter of mas, in order to match the angular size, brightness and color temperature the source must be optically thin (Ney & Hatfield, 1980).
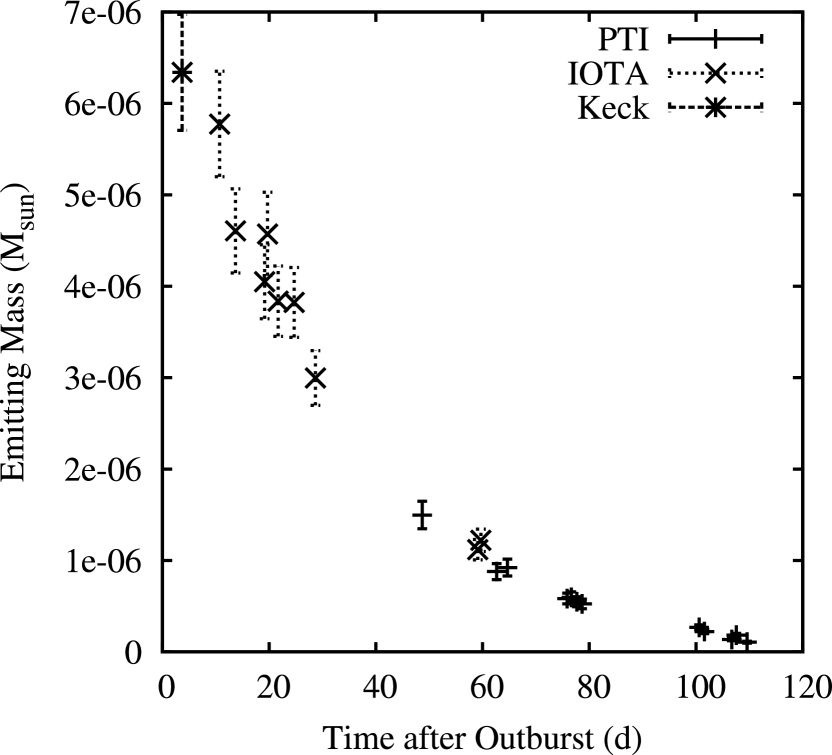
For thermal Bremsstrahlung the emitted intensity is proportional to , i.e. the emission measure. Using the interferometrically determined sizes we can find the total volume and hence infer the electron density and total emitting mass as a function of time, assuming that the electron density is uniform throughout the emitting volume. Results are shown in Figure 4. In determining the volume, we assume the emitting region to be an ellipsoid of revolution with dimensions equal to the major and minor axes of the best-fit Gaussian model.
We find that the required emitting mass is in the range of 1–6 . If this material is being ejected from the nova at high velocity then the total amount of mass ejected in the months after the eruption becomes considerable: given the size of the emitting region, and a nominal wind velocity of , material will cross the emitting region in a few days. We find the approximate total mass ejected from
| (1) |
where is the duration of mass ejection (Hachisu et al., 2006, days), is the amount of mass in the emitting region at any given time, is the expansion velocity and is the size of the emitting region. Hence the total amount of mass ejected post-outburst is . Such a large ejected mass is consistent with the shell mass determined by Bohigas et al. (1989), but is larger that the predicted value from models (–; Yaron et al. 2005.), and larger than estimates based on X-ray observations from the 1985 outburst (O’Brien et al., 1992). We note that the mass estimate of a few by Sokoloski et al. (2006) is based on the X-ray properties of the shock in the period immediately after the outburst and would not be sensitive to mass ejected many days after optical maximum, as seen here. Nevertheless, this is comparatively large amount of mass, roughly equal to the amount of mass lost from the red giant in the inter-outburst period; this would cast doubt on the notion that the nova is a net gainer of mass.
One can however propose other mechanisms to explain the presence of a few of emitting material around the nova binary system, if this material is considered to be quasi-stationary. Two sources of material are readily available in the system: the accretion disk and the red giant. The first scenario would be that the material we are seeing comes from the accretion disk that surrounds the WD (the disk is thought to be disrupted by the nova); if this material is heated by the passing shock wave and enough momentum is imparted to move it outside of the binary, it might be possible to match the observed morphology, i.e the elongation with P.A. would then be aligned with the orbital plane (inferred by O’Brien et al. (2006) to be perpendicular to the jet direction.) If we are indeed seeing gas emission by material from a disrupted disk, then these measurements represent a measurement of the mass of that disk. If we assume that the material is quasi-stationary then the inferred disk mass is 1–6 .
The second possibility is that the blast wave from the nova impacts the red giant with sufficient momentum to strip off a portion of the companion atmosphere. Such scenarios have been studied in the context of supernovae (Marietta et al., 2000; Wheeler et al., 1976), and it has been shown that considerable mass stripping will occur. However, the greatly reduced energy available in novae limits the magnitude of this effect. Assuming a blast wave velocity of and mass of (Sokoloski et al., 2006), and a RG radius of , mass of and the orbital separation (Hachisu & Kato, 2006), and using Eqns 8 & 9 from Wheeler et al. (1976), we find that their parameter ( is essentially the ratio of the momentum of the portion of the blast wave that impacts the companion to the momentum required to move the companion at its own escape velocity). Wheeler et al. (1976) find that the fraction of mass stripped from the companion is ; hence we conclude that the amount of mass stripped from the RG is essentially negligible.
5 Conclusion
We have used long-baseline interferometry to resolve the emission from the recurrent nova RS Oph. We find that the near-IR emission is on the scale of a few mas, corresponding to AU at the canonical 1.6 kpc distance; this is factor of smaller that the size of the radio emission source at this time, but is also larger than the size of the WD-RG binary system. The emission is also not spherically symmetric. Initially the source appeared to expand and was elongated with a major-axis position angle of deg; subsequently the source appears to contract and the orientation angle changes to . We explore possible sources of this emission, and attribute it to plasma emission emanating from the strong wind leaving the WD. We derive an upper limit to the mass in the emitting region to be a few times and use it to infer the total amount of mass lost by the WD during the days immediately following the outburst to be .
References
- Bode (1987) Bode, M. F. 1987, RS Ophiuchi (1985) and the Recurrent Nova Phenomenon,VNU Science Press, Utrecht.
- Bode et al. (2006) Bode, M. F. et al., 2006, ApJ, in press (astro-ph/0604618).
- Boden et al. (2000) Boden, A., Creech-Eakman, M., Queloz, D., 2000, ApJ, 536, 880-890.
- Bohigas et al. (1989) Bohigas, J., Echevarria, J., Diego, F., & Sarmiento, J. A. 1989, MNRAS, 238, 1395
- Callus et al. (1986) Callus, C. M., Evans, A., & Albinson, J. S. 1986, Irish Astronomical Journal, 17, 330
- Colavita et al. (1999) Colavita, M. M.,et al. 1999, ApJ, 510 , 505.
- Colavita (1999b) Colavita, M. M., 1999, PASP, 111, 111.
- Colavita et al. (2003) Colavita, M., et al. 2003, ApJ, 592, L83
- Cox (1999) Cox, A. N., 1999, Allens Astrophysical Quantities, Springer-Verlag, New York.
- Eisner et al. (2003) Eisner, J. A., Lane, B. F., Akeson, R. L., Hillenbrand, L. A., & Sargent, A. I. 2003, ApJ, 588, 360
- Evans et al. (1988) Evans, A., Callus, C. M., Albinson, J. S., Whitelock, P. A., Glass, I. S., Carter, B., & Roberts, G. 1988, MNRAS, 234, 755
- Evans (1986) Evans, A, 1987, RS Ophiuchi (1985) and the Recurrent Nova Phenomenon,VNU Science Press, Utrecht, p. 117–131.
- Evans et al. (2006) Evans, A., et al., 2006, MNRAS in press. (astro-ph/0609394).
- Eyres et al. (2006) Eyres, S. P. S., O’Brien, T. J., Muxlow, T. W. B., Bode, M. F., & Evans, A. 2006, IAU Circ., 8678, 2
- Fekel et al. (2000) Fekel, F. C., Joyce, R. R., Hinkle, K. H., & Skrutskie, M. F. 2000, AJ, 119, 1375
- Hachisu et al. (1999) Hachisu, I., Kato, M., & Nomoto, K. 1999, ApJ, 522, 487
- Hachisu & Kato (2000) Hachisu, I., & Kato, M. 2000, ApJ, 536, L93
- Hachisu & Kato (2001) Hachisu, I., & Kato, M. 2001, ApJ, 558, 323
- Kato & Hachisu (1994) Kato, M., & Hachisu, I. 1994, ApJ, 437, 802
- Kato & Hachisu (2004) Kato, M., & Hachisu, I. 2004, ApJ, 613, L129
- Hachisu & Kato (2006) Hachisu, I., & Kato, M. 2006, ApJ, 642, L53
- Hachisu et al. (2006) Hachisu, I., et al. 2006, ApJ, 651, L141
- Hjellming et al. (1986) Hjellming, R. M., van Gorkom, J. H., Seaquist, E. R., Taylor, A. R., Padin, S., Davis, R. J., & Bode, M. F. 1986, ApJ, 305, L71
- IRAS (1985) IRAS, 1985, IRAS Point Source Catalogue.
- Marietta et al. (2000) Marietta, E., Burrows, A., & Fryxell, B. 2000, ApJS, 128, 615
- Monnier et al. (2006) Monnier, J. D., et al., 2006, ApJL, in press.
- Narumi et al. (2006) Narumi, H., Hirosawa, K., Kanai, K., Renz, W., Pereira, A., Nakano, S., Nakamura, Y., & Pojmanski, G. 2006, IAU Circ., 8671, 2
- Ney & Hatfield (1980) Ney, E. P., Hatfield, B. F., 1980, AJ, 85, 1292.
- O’Brien et al. (1992) O’Brien, T. J., Bode, M. F., & Kahn, F. D. 1992, MNRAS, 255, 683
- O’Brien et al. (2006) O’Brien, T. J., et al. 2006, Nature, 442, 279
- Pearson et al. (2005) Pearson, K. J., Horne, K., & Skidmore, W. 2005, ApJ, 619, 999
- Prialnik & Kovetz (2005) Prialnik, D., & Kovetz, A. 2005, AIP Conf. Proc. 797: Interacting Binaries: Accretion, Evolution, and Outcomes, 797, 319
- Quirrenbach et al. (1993) Quirrenbach, A., Elias, N. M., Mozurkewich, D., Armstrong, J. T., Buscher, D. F., & Hummel, C. A. 1993, AJ, 106, 1118
- Russell et al. (2006) Russell, R. W., Rudy, R. J., Lynch, D. K., & Woodward, C. E. 2006, IAU Circ., 8710, 3
- Rybicki & Lightman (1979) Rybicki, G. B., Lightman, A. P., 1979, Radiative Processes in Astrophysics, Wiley & Sons, New York.
- Snijders et al. (1985) Snijders, M. A. J., Cassatella, A., Hassall, B. J. M., Harris, A., & Green, D. W. E. 1985, IAU Circ., 4067, 2
- Sokoloski et al. (2006) Sokoloski, J. L., Luna, G. J. M., Mukai, K., & Kenyon, S. J. 2006, Nature, 442, 276
- Traub et al. (2000) Traub, W. A., et al. 2000, Proc. SPIE, 4006, 715
- Wheeler et al. (1976) Wheeler, J. C., Lecar, M., & McKee, C. E. 1976, ApJ, 209, 961
- Yaron et al. (2005) Yaron, O., Prialnik, D., Shara, M. M., & Kovetz, A. 2005, ApJ, 623, 398
- Zamanov et al. (2006) Zamanov, R., Panov, K., Boer, M., & Coroller, H. L. 2006, The Astronomer’s Telegram, 832, 1
| Date | Julian Date (MJD) | UaaProjected baseline coordinates in meters. | VaaProjected baseline coordinates in meters. | No. Pts.bbNumber of 130-second integrations averaged together for the night. | ccNormalized fringe visibility, squared. | |
|---|---|---|---|---|---|---|
| 5/22/2003 | 52781.384 | -83.2191 | -20.7015 | 2 | 0.970 | 0.242 |
| 3/24/2006 | 53818.510 | -83.1262 | -22.8196 | 1 | 0.126 | 0.050 |
| 4/2/2006 | 53827.510 | -83.2183 | -21.2903 | 3 | 0.337 | 0.077 |
| 4/16/2006 | 53841.491 | -81.0884 | -20.1695 | 9 | 0.411 | 0.031 |
| 4/18/2006 | 53843.491 | -81.5573 | -19.8387 | 8 | 0.300 | 0.050 |
| 4/29/2006 | 53854.464 | -80.9573 | -19.6682 | 8 | 0.459 | 0.029 |
| 4/30/2006 | 53855.456 | -81.1711 | -19.9687 | 10 | 0.448 | 0.029 |
| 5/1/2006 | 53856.481 | -49.2736 | 58.0854 | 9 | 0.366 | 0.058 |
| 5/2/2006 | 53857.478 | -49.3282 | 58.0682 | 9 | 0.389 | 0.026 |
| 5/24/2006 | 53879.403 | -80.2290 | -19.2295 | 6 | 0.493 | 0.144 |
| 5/25/2006 | 53880.407 | -47.8541 | 57.7800 | 7 | 0.424 | 0.072 |
| 5/30/2006 | 53885.390 | -46.9012 | 57.6591 | 6 | 0.556 | 0.074 |
| 5/31/2006 | 53886.380 | -80.9950 | -19.4490 | 5 | 0.458 | 0.051 |
| 6/2/2006 | 53888.377 | -45.7106 | 57.4739 | 4 | 0.485 | 0.094 |
| 6/12/2006 | 53898.374 | -51.3773 | 58.3395 | 2 | 0.735 | 0.454 |
| 6/13/2006 | 53899.328 | -82.8230 | -20.4248 | 3 | 0.892 | 0.078 |
Note. — Table of observed fringe visibilities, averaged on a nightly basis.
| Model | All PTI | Epoch 1 | Epoch 2 | Epoch 3 | Epoch 4 | Epoch 5 |
|---|---|---|---|---|---|---|
| Parameters | data | (day 4-11) | (day 14-29) | (day 49-65) | (day 76-80) | (day 101-121) |
| Ellip. Gauss. | ||||||
| Major Axis | ||||||
| Minor Axis | ||||||
| P.A. | ||||||
| 1.9 | 1.4 | 2.4 | 4.4 | 1.1 | 1.5 | |
| No. Pts. | 90 | 22 | 108 | 52 | 36 | 33 |