001–999
Uncertainties of the masses of black holes
and Eddington ratios in AGN
Abstract
Black hole masses in Active Galactic Nuclei have been determined in 35 objects through reverberation mapping of the emission line region. I mention some uncertainties of the method, such as the “scale factor” relating the Virial Product to the mass, which depends on the unknown structure and dynamics of the Broad Line Region.
When the black hole masses are estimated indirectly using the empirical size-luminosity relation deduced from this method, the uncertainties can be larger, especially when the relation is extrapolated to high and low masses and/or luminosities. In particular they lead to Eddington ratios of the order of unity in samples of Narrow Line Seyfert 1. As the optical-UV luminosity is provided by the accretion disk, the accretion rates can be determined and are found to be much larger than the Eddington rates.
So, accretion must be performed at a super-critical rate through a slim disk, resulting in rapid growth of the black holes. The alternative is that the mass determination is wrong at this limit.
keywords:
Quasars: general – galaxies: active1 Introduction
It is a paradox that the determination of Black Hole (BH) masses in Active Galactic Nuclei (AGN) is more difficult than in quiescent galaxies. Nevertheless, it is absolutely necessary to know the BH masses at high redshifts, and to understand how BHs grow. BH masses in AGN are determined through the ‘virial technique’, so-called because it assumes that the line emission region is gravitationally bound to the BH. Since it has become an industry and was used in several dozens of papers to determine the masses of thousands of BHs, I thought that it was necessary to recall some basic uncertainties plaguing this method. Also the question of the accretion rates is very important in the context of BH growth, and it is almost always confused with the question of the luminosity.
2 Virial masses
In 35 Seyfert and low redshift quasars, the BH masses have been determined directly from “reverberation mapping” (in the following these AGN are called “Reverberation Mapped”, or RM objects). As a by-product of this method, an empirical relation was found between the size of the Broad Line Region (BLR) and the optical luminosity, . In all other AGN except one (NGC 4258), the BH masses are determined indirectly using this empirical relation.
The direct method consists in measuring the time delay between the continuum and the line variations which respond to them; it gives a characteristic size of the BLR. Assuming that the BLR is gravitationally bound (which is certainly true for the Balmer line emitting region, cf. Peterson & Wandel 2000), the mass of the BH, , is then equal to , where is the dispersion velocity, and a scale factor. is called the “Virial Factor”. The usual way is to identify with the FWHM, and to assume , which correspond to an isotropic BLR with a random distribution of orbits.
There are strongly debated questions about the method. To quote only a few:
-
1. What is the best choice for measuring the dispersion velocity? Is it the FWHM (which is used in all works) or , i.e. the second moment of the line profile? There is a large scatter of the FWHM/ ratio, and Peterson et al. (2004) showed that seems more reliable for the intrinsic dispersion of measurements, but it is generally not measured.
-
2. The scale factor varies among the objects by a factor three: it is larger than two for RM objects with narrow peaked lines and smaller than unity in RM objects with broad flat topped lines. Collin et al. (2006) showed that it depends probably on the Eddington rate and on the inclination of the BLR (which is most likely not spherical but axially symmetric), and that some narrow line objects must be seen at low inclination and consequently have their masses underestimated by up to one order of magnitude.
-
3. Is it better to use the RMS or the mean spectrum? Peterson et al. (2004) reanalysed the data of all RM objects, used instead of the FWHM, RMS spectrum instead of mean spectrum, and changed the factor , as scaled on the bulge masses by Onken et al. (2004). As a result, they obtained masses systematically larger by typically a factor two than those of Kaspi et al. (2000), some of them by factors up to one order of magnitude.
Everybody in this audience is aware that there is an empirical relation discovered with the RM objects between the size of the BLR and the optical luminosity (Peterson & Wandel 1999, Kaspi et al. 2000). This relation was revised by Kaspi et al. in 2005 and is given now with a good precision. It is not well understood theoretically, but it allows to determine for single epoch observations, by simply measuring (opt) (= at 5100Å) and the FWHM. This is very useful since the reverberation method requires at least several months of monitoring of a given object to lead to a mass determination. Once the mass is known, it is also possible to determine the Eddington ratio , assuming a bolometric correction of the order of 10. It has been used for large samples of quasars, like the SDSS.
Some studies have shown that the most luminous quasars correspond to very massive black holes, up to radiating at their Eddington luminosity. At the other extreme, it led to very small masses, of the order of a few 10, in a sample of AGN with small host galaxies (Barth et al. 2005). It is not clear whether the extrapolation of the relation to large or small luminosities is valid (cf. Wang & Zhang 2003 for the low mass side). Moreover one must not forget that the indirect method eliminates the intrinsic dispersion of the size-luminosity relation, and that the scale factor is still not well known and certainly varies among objects.
3 The Eddington ratio versus the accretion rate
Using the RM objects and assuming that the optical luminosity was due to the accretion disk, Collin et al. (2002) showed that a fraction of them were accreting at super-Eddington rate. Actually the rates were overestimated, because the Hubble constant was assumed to be 50 and not 70 km s-1 Mpc-3, and the masses taken from Kaspi et al. (2000) were probably underestimated by a factor two to three. In total the Eddington ratios were overestimated by a factor of about six, and the accretion rates in Eddington units had to be also reduced by larger factors (see below), so almost none of the RM objetcs are now found to accrete at super-Eddington rates. Nevertheless, applying the same technique to samples of Narrow Line Seyfert 1 nuclei (NLS1s) where the BH masses were determined by the indirect Virial method, Collin & Kawaguchi (2004) showed that a large fraction of them are accreting at super-Eddington rate.
It is easy to understand why the accretion rate in Eddington units can be much larger than the Eddington ratio. In the optical range, the disk radiates locally like a black body (this is not true in the UV range, cf. Hubeny et al. 2001). Thus can be expressed as , where is the inclination of the normal of the disk with the line of sight, and is the accretion rate. is a constant, actually of the order of unity. It leads to the efficiency for mass-energy conversion:
| (1) |
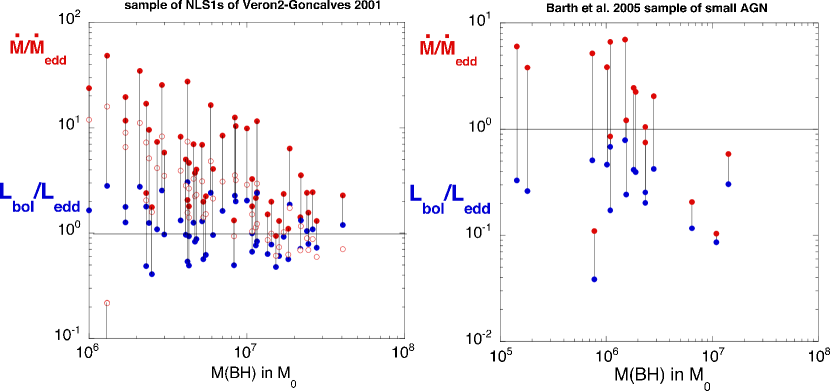
where is the observed bolometric correction divided by 10, and the mass in 10. Thus could be very small for large luminosities and small BH masses. It means that the accretion rate expressed in Eddington units with a standard efficiency of 0.1 () is much larger than . This is illustrated in Fig. 1. The figure on the left (from Collin & Kawaguchi 2004) shows the application of this law to the NLS1 sample of Veron-Cetti et al. (2001), and that on the right to the sample of Barth et al. (2005) consisting of small mass BHs. The red points correspond to , and the blue ones to .
One can see that is typically one order of magnitude larger than for the NLS1 sample, while it is slightly smaller for the Barth sample whose luminosities are smaller. On the left figure are also shown the values of computed assuming that a large fraction of the optical luminosity is provided by an external non-gravitational heating of the disk (cf. Collin & Kawaguchi 2004 for a detailed explanation). Though the values of are smaller than previously, they remain nevertheless larger than .
Is this conclusion unescapable? Other explanations can be proposed:
- 1.
-
Super-Eddington accretion rate can be relatively large at a distance of 100 to 1000 Schwarzschild radii corresponding to the emission of the optical band, and relativistic outflows can be created close to the BH. Note however that such outflows, if they exist as proposed by Gierlinski & Done (2004), are not super-Eddington.
- 2.
-
The optical-UV emission is not due to the accretion disk, even when taking into account a non-gravitational external heating: but then to what else (see the discussion in Collin et al. 2002)?
- 3.
-
The empirical size-luminosity relation may not be valid at large Eddington ratios and small masses, or the scale factor is much larger for these objects.
- 4.
-
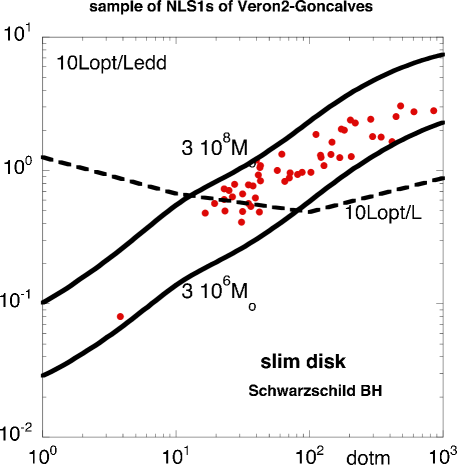
Alternatively, we observe really super-Eddington accretion rates, due to “slim” super-Eddington advective disks (Abramowicz et al. 1988).
Indeed the SED of such disks is in agreement with the relation between and , and with the constancy of the ratio opt, as shown on Fig. 2 (cf. the description of the slim disk model in Collin & Kawaguchi 2004). If these super-Eddington accretion rates are real and concern not only nearby quasars, they would have important cosmological consequences. During their low mass phase, the growth time of the BHs would not be Eddington but mass supply limited, and can be much smaller than the Eddington time. Super-Eddington accretion can thus account for the rapid early growth of BHs. It implies also that the BH/bulge mass relationship for NLS1s would be more dispersed than in other objects.
Acknowledgements.
I am grateful to T. Kawaguchi, B. Peterson, and M. Vestergaard for many enlightening discussions on the subject.References
- [] Abramowicz M.A., Czerny B., Lasota J.-P., & Szuszkiewicz E. 1988, ApJ, 332, 646
- [] Barth A.J., Greene J. E., Ho L. C. 2005, ApJL, 619, L151
- [] Collin, S., Boisson, C., Mouchet M., Dumont A.-M., Coupé S., Porquet D., Rokaki E. 2002, A&A, 388, 771
- [] Collin S., Kawaguchi T. 2004, A&A, 426, 797
- [] Collin S., Kawaguchi T., Peterson B. M. & Vestergaard 2006, A&A, 456, 75
- [Gierliński & Done(2004)] Gierliński M., Done C. 2004, MNRAS, 349, L7
- [] Hubeny, I., Blaes, O., Krolik J. H., & Agol E. 2001, ApJ, 559, 680
- [] Kaspi S., Smith P. S., Netzer H., Maoz D., Jannuzi B. T., Giveon U. 2000, ApJ, 533, 631
- [] Kaspi S., Maoz D., Netzer H., Peterson B. M., Vestergaard M., Jannuzi B. T. 2005, ApJ, 629, 61
- [] Onken C. A., Ferrarese L., Merritt D., Peterson B. M., Pogge R. W., Vestergaard M., Wandel A. 2004, ApJ, 615, 645
- [] Peterson B. M., Wandel A. 1999, ApJL, 521, L95
- [] Peterson B. M., Wandel A. 2000, ApJL, 540, L13
- [] Peterson B. M. et al. 2004, ApJ, 613, 682
- [] Véron-Cetty, M.-P., Véron, P., & Gonçalves, A.C. 2001, A&A, 372, 730
- [] Wang, T.-G., & Zhang, X.-G. 2003, MNRAS, 340, 793
Debora Dultzin-HacyanComment: It has been shown by Zhang & Win that the – relation is not valid for dwarf (low ) AGN.
Suzy CollinYou are perfectly right. If the size is larger that that given by – relation for small masses, it means that we underestimate them. On the other hand, as we have shown (Collin et al. 2006) that the scale factor is probably underestimated for the NLS1 class, this could be another reason of underestimating the mass.