X-ray Supercavities in the Hydra A Cluster and the Outburst History of the Central Galaxy’s Active Nucleus
Abstract
A 227 ksec Chandra Observatory X-ray image of the hot plasma in the Hydra A cluster has revealed an extensive cavity system. The system was created by a continuous outflow or a series of bursts from the nucleus of the central galaxy over the past Myr. The cavities have displaced 10% of the plasma within a 300 kpc radius of the central galaxy, creating a swiss-cheese-like topology in the hot gas. The surface brightness decrements are consistent with empty cavities oriented within 40 degrees of the plane of the sky. The outflow has deposited upward of erg into the cluster gas, most of which was propelled beyond the inner kpc cooling region. The supermassive black hole has accreted at a rate of approximately over this time frame, which is a small fraction of the Eddington rate of a black hole, but is dramatically larger than the Bondi rate. Given the previous evidence for a circumnuclear disk of cold gas in Hydra A, these results are consistent with the AGN being powered primarily by infalling cold gas. The cavity system is shadowed perfectly by 330 MHz radio emission. Such low frequency synchrotron emission may be an excellent proxy for X-ray cavities and thus the total energy liberated by the supermassive black hole.
Subject headings:
cooling flows — galaxies: clusters: general — galaxies: elliptical and lenticular, cD — intergalactic medium — X–rays: galaxies1. Introduction
The realization that powerful outbursts from central active galactic nuclei (AGN) can release upward of erg into the intracluster medium (ICM) points to a common solution to several heating problems associated with clusters and groups of galaxies (McNamara et al., 2005; Nulsen et al., 2005a, b). AGN feedback has become the most promising mechanism for regulating the cooling of the hot gas in galaxies and clusters, and thus limiting the growth of elliptical galaxies and their attendant supermassive black holes (Voit & Donahue, 2005; Benson et al., 2003). Furthermore, energy released by AGN could be a major source of excess entropy (“preheating”) in the hot gas in groups and clusters (Wu et al., 2000; Voit, 2004), and AGN outbursts may thread clusters with large-scale magnetic fields.
Cavities and shock fronts provide a reliable lower limit to the energy output of AGN independent of the magnetic field and particle content of the jet (Bîrzan et al., 2004; Dunn et al., 2005; De Young, 2006). The existence of well-defined cavities in the hot ICM around radio lobes implies that the magnetic field and relativistic particles are largely confined to the volume of the cavity such that most of the energy output of the AGN is included (radiation losses are usually negligible in these systems). This energy provides a strict lower limit to the gravitational binding energy released by accretion onto the embedded supermassive black hole, and hence the mean growth rate of the hole over the life of the outburst (McNamara et al., 2005; Nulsen et al., 2005a; Rafferty et al., 2006).
This geometric approach is limited at present by the Chandra X-ray Observatory’s ability to resolve cavity boundaries required to measure their sizes (volumes) and the surrounding pressures. This provides a largely parameter free estimate of the work done by radio jets as they inflate the cavities against the surrounding gas pressure (). The method assumes the cavities are close to pressure balance with the surrounding gas, which is justified by the absence of bounding strong shocks, their high detection rate and advanced ages (Bîrzan et al., 2004; Dunn et al., 2005). The total free energy (enthalpy) per cavity is expected to lie in the range – if the pressure is dominated by gas, or if it is dominated by magnetic field. Thus, the free energy depends on the equation of state of the (radio) plasma filling the cavities. The principal sources of uncertainty in the enthalpy estimates are the volume measurements (geometry) and the as yet unknown makeup (equation of state) of the plasma inside the cavities, which combined amount to uncertainties of factors of a few.
The total energy pumped into the ICM by AGN is partitioned into radio emission (which is generally negligible), cavity energy ( for relativistic gas), and “shock energy.” Here “shock energy” refers to the total work done by the expanding cavities on the surrounding gas, which appears as excess thermal, kinetic, and potential energy in the ICM. Its effect is most evident where the expanding cavities drive a detectable shock. Measurements of these quantities have shown that the internal cavity pressures generally exceed the radio equipartition pressures by more than an order of magnitude and that jet (mechanical) power often exceeds synchrotron power by several orders of magnitude. The unavoidable conclusion then is that radio jets possess much larger mechanical powers than expected, with potentially dramatic consequences for quenching cooling flows and cluster heating (Pedlar et al., 1990).
Whether AGN heating of the ICM occurs violently through shocks or outflows, or gently through bubbling, vorticity, etc., or both is poorly understood. Most known cavity systems are associated with Fanaroff-Riley class I radio sources, for which jet ram pressure is probably negligible. In this instance the pressure within the X-ray cavities is expected to be uniform (Heinz et al., 1998), and thus the cavity pressure is well-defined by the external pressure. The ratio of cavity enthalpy to shock energy is governed chiefly by the history of power input to the cavity. Therefore, the nature and history of energy injection can be evaluated using the cavity properties and the surrounding shock front. Here we examine this and other issues, using an analysis of the enormous system of X-ray cavities embedded in a “cocoon” shock in the Hydra A cluster (McNamara et al., 2000; David et al., 2001; Nulsen et al., 2002, 2005b), and we discuss its consequences for cluster heating by the central radio source, and for accretion onto the central supermassive black hole.
In the succeeding analysis, we have adopted a redshift for Hydra A of and a flat CDM cosmology with =70 , =0.3, and =0.7. These assumptions yield a luminosity distance of Mpc, an angular diameter distance of 216 Mpc, and a linear scale of 1.05 kpc per arcsec.
2. Observations and Data Reduction
Hydra A has been observed four times by Chandra with the ACIS detector in imaging mode for a total exposure of 240 ksec. Three of the observations were made with ACIS-S detector at the aimpoint (ObsIDs 576, 4969, 4970) and one (ObsID 575) using the ACIS-I detector. The two shorter exposures were taken early in the Chandra mission when the ACIS detector was operated at the higher focal plane temperature of C. Each dataset was individually reprocessed using CIAO 3.2 and calibration files available in CALDB 3.0. Standard screening was applied to the event files to remove bad grades and pixels. Two of the datasets (ObsIDs 575 and 4969) exhibited strong background flares and required additional filtering. The final, combined exposure time for all four datasets was 227 ksec.
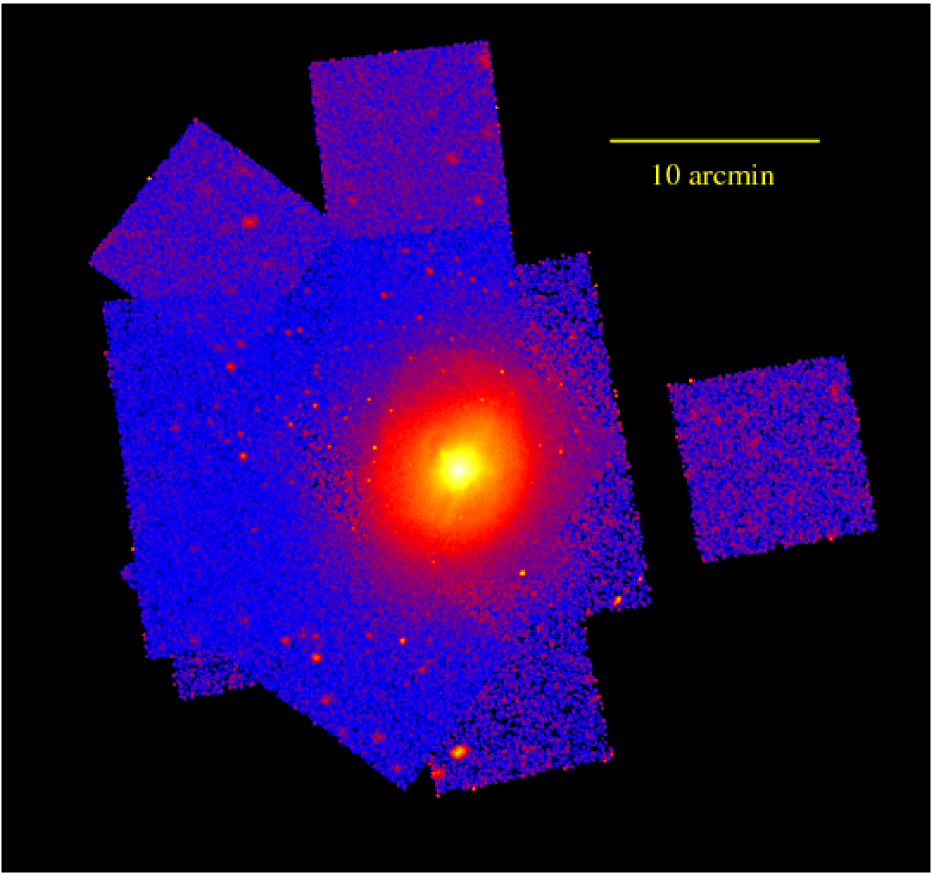
After cleaning, the event files for ObsID’s 575, 576, and 4969 were reprojected to a common tangent point on the sky with ObsID 4970. A number of bright point sources in Hydra A were used to test for potential astrometry errors in the reprojected sky coordinates between fields. Individual background event files were created for each ObsID from the standard ACIS blank-sky event files following the procedure described in Vikhlinin et al. (2005) and reprojected to the common tangent for ObsID 4970. Using the reprojected event files, source and background counts images were created for each CCD in each observation using standard CIAO tools. Matching exposure maps were created for each chip using the CIAO tool expmap. The resulting images for individual CCDs were then added to form mosaics combining all four datasets. The resulting background-subtracted, exposure-corrected mosaic is shown in Figure 1 centered on the radio source 3C 218. All detected point sources were excised prior to extracting spectra and surface brightness profiles.
Due to the higher quality calibration at C, spectral analysis was restricted to the two longer, more recent exposures (4969 and 4979). Collectively, ObsIDs 575 and 576 comprise 17% of the total exposure and neglecting them has little or no effect on the final spectral fits. Count weighted detector response (RMFs) and effective area (ARFs) files were created for extraction regions using the CIAO tools mkacisrmf and mkwarf, including the temporal, spectral, and spatial dependences of the ACIS filter contaminant.
| h | |||||||||
|---|---|---|---|---|---|---|---|---|---|
| Cavity | (kpc) | (kpc) | (kpc) | ( ergs) | ( yr) | ( yr) | ( yr) | ( yr) | ( ergs s-1) |
| A | 20.5 | 12.4 | 24.9 | 8.4 | 2.7 | 4.3 | 8.6 | 5.2 | 2.1 |
| B | 21.0 | 12.3 | 25.6 | 8.2 | 2.7 | 4.4 | 8.7 | 5.3 | 2.0 |
| C | 47.2 | 31.5 | 100.8 | 29.3 | 10.2 | 23.0 | 26.8 | 20.0 | 1.9 |
| D | 29.0 | 20.9 | 59.3 | 14.8 | 6.1 | 13.3 | 16.4 | 11.9 | 1.6 |
| E | 105.0 | 99.7 | 225.6 | 247.9 | 22.3 | 51.7 | 65.3 | 46.4 | 6.8 |
| F | 67.7 | 50.1 | 104.3 | 102.3 | 10.5 | 20.2 | 33.5 | 21.4 | 6.1 |
3. Cluster-scale Radio Cavities & Filling Factor
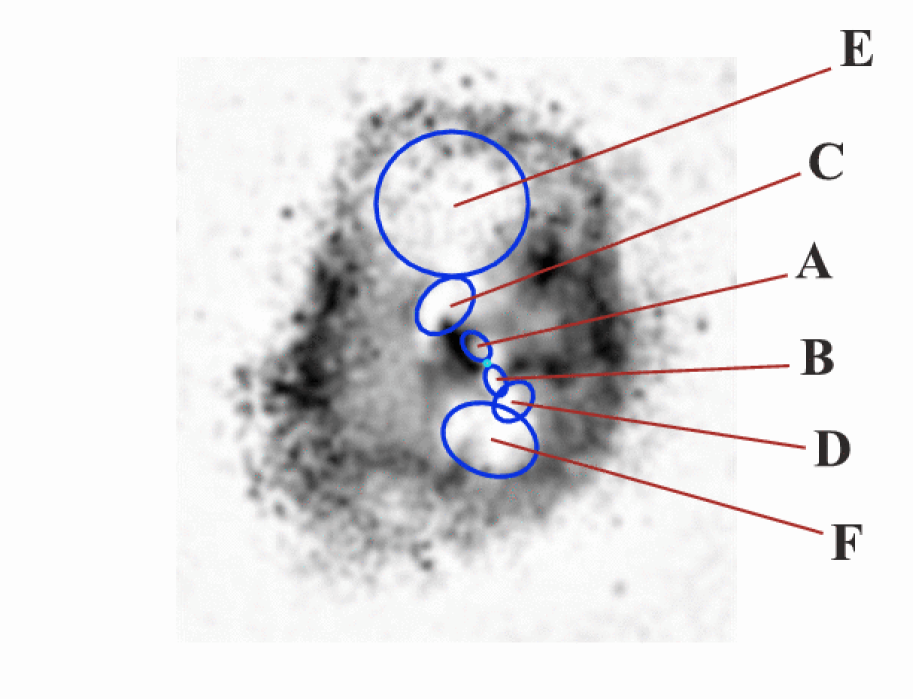
In order to highlight faint cavity structures, an elliptical beta model was fit to the azimuthally averaged surface brightness and subtracted. The residual image shown in Figure 2 reveals at least three pairs of X-ray cavities emanating from the central cD galaxy distributed with a “swiss cheese” topology throughout the inner region of the cluster.
The inner pair of cavities (labeled A and B in Figure 2) are well-known set described by McNamara et al. (2000); David et al. (2001); Nulsen et al. (2002). These cavities are each – kpc in diameter and centered roughly 25 kpc north-south of the central AGN. We also note that the enhanced X-ray emission, relative to the underlying smooth model, immediately to the west of cavity A corresponds to the region of cooler gas seen previously in Nulsen et al. (2002).
A second set of “ghost” cavities (labeled C and D) can be seen beyond the inner pair. The northern-most corresponds to the cavity “C” feature discussed in Nulsen et al. (2005b). This asymmetrical pair of cavities has diameters of kpc and kpc, projected 100 kpc and 60 kpc distant from the north and south cavities, respectively. Finally, two very large cavities (E and F) are projected at radii of 225 kpc and 100 kpc to the north and south, respectively. These cavities have diameters of – kpc and fall just inside a sharp edge in the surface brightness which can also be seen in Figure 2. This edge was interpreted by Nulsen et al. (2005b) as a shock front associated with a 140 Myr old outburst. The estimated Mach number for this shock is roughly 1.2, although the data are not of sufficient quality to detect the 20% jump in temperature expected for such a shock.
This enormous cavity system fills at least 10% of the cluster’s volume within a 300 kpc radius (see below). Table 1 describes the cavities in the system. All appear to be connected, raising the possibilities that they are merging bubbles generated by a series of outbursts, or several attached cavities that have been continuously powered by the AGN over the past several hundred million years.
| a | b | d | atan() | |||||
|---|---|---|---|---|---|---|---|---|
| Cavity | (kpc) | (kpc) | (kpc) | (kpc) | (kpc) | (deg) | ||
| A | 15.97 | 24.9 | 0.90 | 0.06 | 45 | 35 | 65 | 61 |
| B | 16.06 | 25.5 | 0.67 | 0.04 | 19 | 15 | 22 | 37 |
| C | 38.58 | 100.8 | 0.71 | 0.08 | 26 | 70 | 14 | |
| D | 24.62 | 59.3 | 0.59 | 0.05 | ||||
| E | 102.34 | 225.6 | 0.62 | 0.15 | 101 | 193 | 24 | |
| F | 58.26 | 104.3 | 0.71 | 0.09 | 80 | 43 | 118 | 37 |
4. Cavity Geometry & Energetics
The deprojected gas densities and temperatures surrounding the cavities were determined using the techniques described in Wise, McNamara, & Murray (2004) and are consistent with those of David et al. (2001). Values for the surrounding pressures were combined with the volume estimates to calculate the energies of each cavity listed in Table 1. Summing the values for all six cavities from Table 1, the total work done by the jet is ergs, corresponding to a total free energy or enthalpy ( – 4) of 0.8 – ergs. This range is comparable to the energetic output of other supercavity systems MS0735.6+7421: erg (McNamara et al., 2005), and Hercules A: erg (Nulsen et al., 2005a). It is also comparable to the erg Nulsen et al. (2005b) found for the energy associated with the large-scale shock in Hydra A.
Inspection of the cavity energies in Table 1 shows that the outer, larger cavities contain more than an order of magnitude more energy than the original A and B cavity systems. Most of this energy is being deposited into the ICM outside the 100 kpc cooling radius in Hydra A (David et al., 2001; Bîrzan et al., 2004). Less than 10% of the total free energy associated with the cavity system resides inside the cluster’s cooling radius.
A number of factors contribute to the uncertainty in these energy estimates including geometric uncertainties in the size and shape of the cavities, the “filling factor” or fraction of the volume from which X-ray emitting gas is excluded, and the locations of the cavities along the line-of-sight through the cluster. Since these factors also affect the observed X-ray surface brightness profile over the cavities, these profiles can be used to constrain these uncertainties and to test our assumptions about the cavities. For example, the presence of an empty cavity within the cluster emitting volume will produce a decrement in the X-ray surface brightness that depends on the size of the cavity and its depth in the cluster. By measuring these cavity decrements, we can therefore set limits on the placement of the cavity along our line-of-sight through the cluster.
Table 2 gives the decrement for each cavity, , defined to be the ratio of the surface brightness measured at the center of each cavity to the surface brightness at the same radius in the “undisturbed” ICM. The undisturbed ISM is modeled using the the double beta model fit to the azimuthally averaged surface brightness profile (excluding the cavities) of David et al. (2001). This model is described by values of , , core radii of 27.7 kpc and 235.6 kpc, respectively, and a normalization for the more extended, second beta model component relative to the first of 0.0418. To estimate the error in the decrement, , we determined the distribution of values in circular apertures 5 arcsec in radius, centered on the cavity centers. The decrement errors, , quoted in Table 2 represent the widths of these distributions.
If we assume that the width of the cavity along the line of sight is and the underlying surface brightness profile is given by the double beta model fit described above, we can determine the distance, , of the cavity along the line-of-sight. This distance is measured from a plane perpendicular to the line-of-sight which passes through the central AGN. Table 2 lists the values of for each cavity required to reproduce the observed surface brightness decrement . One sigma ranges for , – are also given. Missing entries fall outside the range of surface brightness allowed by this model. These values are insensitive to details of the surface brightness model. Using the single beta model of David et al. (1990) for the outer cavities, or a single beta model for the Chandra data at small radii for the inner cavities gives very similar results.
With the possible exception of cavity A, the results in Table 2 show that the the cavities must be almost devoid of X-ray emitting gas at the ambient temperature and density and lie close to the same plane as the AGN. If their filling factors are less than unity, then they would need to lie even closer to the plane of the AGN. Thus, the surface brightness deficit for most of the cavities is consistent with our key assumptions. Only the deficit of 0.1 for cavity A is marginally smaller than expected. Its elongation along the northern radio “jet” suggests that cavity A may be prolate; however, replacing the effective radius with the semiminor axis in the model only shifts it a little closer to the plane of the AGN, from 45 kpc to 39 kpc. At a distance of 45 kpc, it makes an angle of to the plane of the sky, well within reasonable bounds. However, the alignment of the inner radio lobes (cavities A and B) in the plane of the sky suggests that they should make the same angle to the plane of the sky. Since the other cavities all make smaller angles to the plane of the sky, cavity A appears to be the anomaly. Its low decrement may be due to dense, cool gas lying over the cavity. In any case, cavity A contributes little to the total energy.
By contrast, the deficit for cavity D is too large to be explained by our model. Cavity D lies where the southern radio lobe appears to fold back on itself (Lane et al., 2004, also Figure 3), so that our line-of-sight may be nearly tangent to the lobe axis there. In that case, it would be reasonable to expect its central depth to exceed . If true, the value quoted for cavity D in Table 1 may be an underestimate.
5. Cavity Ages and Powers
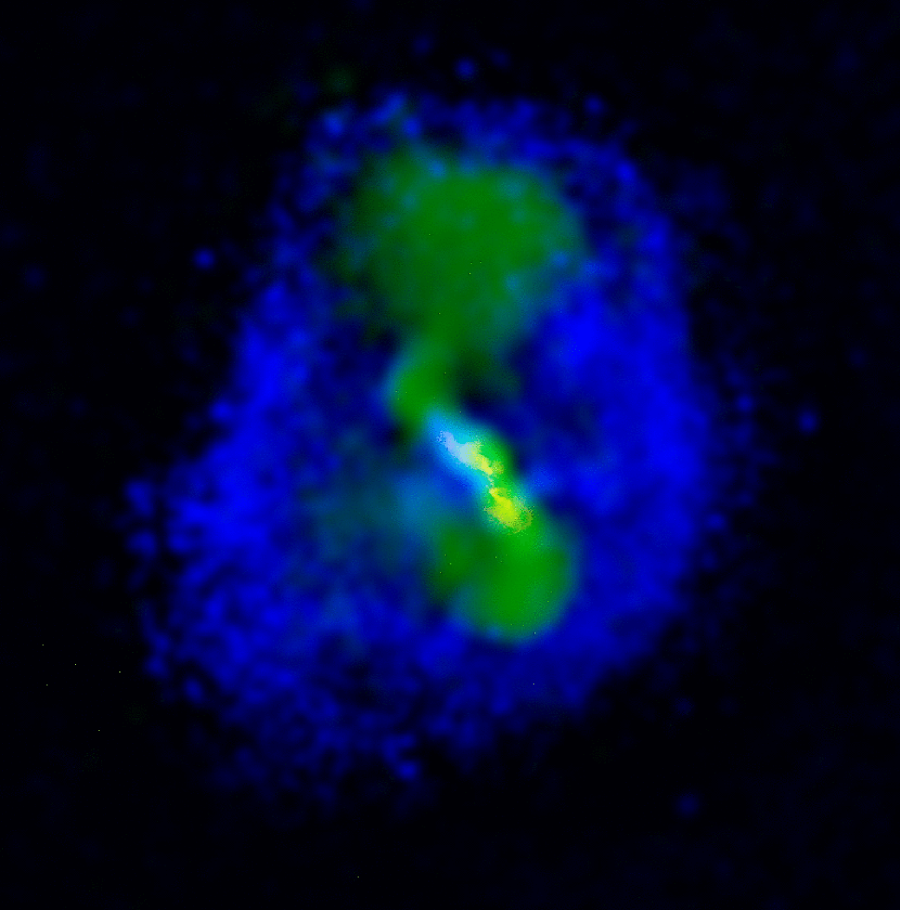
Analogous to the well-known 1.4 Ghz radio emission filling the innermost cavities, low frequency radio observations of Hydra A show that these large-scale cavities also contain relativistic plasma strongly suggesting a connection to the AGN located in the nucleus of the central cD galaxy. This point is illustrated in Figure 3 which overlays the 330 Mhz VLA image of Lane et al. (2004) with the residual X-ray image shown in Figure 2. The existence of multiple cavities implies that the central AGN is periodically rejuvenated producing a series of outbursts.
We can gauge the timescale over which this activity has occurred by determining the ages of these cavities. Following the discussion in Bîrzan et al. (2004), we have estimated the age of each cavity in three ways. First, the age of the cavity was estimated as the time required for it to reach its projected location assuming it traveled at the sound speed. Alternatively, the age was estimated as the time for the cavity to rise buoyantly to its present location. Finally, the age was taken to be the refill timescale (McNamara et al., 2000; Nulsen et al., 2002). Each of these timescales is tabulated in Table 1 along with the mean cavity age, , for the three methods. Cavity ages based on the sound speed typically yield the smallest timescales while refill timescales tend to be the largest (cf Bîrzan et al., 2004). We find mean ages of Myr for cavities A and B, consistent with (Bîrzan et al., 2004) and values ranging between – 200 Myr for cavities C and D. Cavity E could be up to almost 500 Myr old.
Combining the values of given in Table 1 with these age estimates, we can calculate the mean instantaneous power of each cavity as . Here, we have explicitly assumed the cavity is filled predominantly with relativistic plasma, making its enthalpy . The resulting values for are presented in Table 1. Equating with the output of the AGN, the data for the four inner cavities imply that a pair of cavities is created in Hydra A every – 100 Myr for a mean AGN power of ergs s-1. On the face of it, the larger, outermost cavities would seem to be associated with an earlier, more energetic state of activity which occurred 200 – 500 Myr ago with an associated AGN power output of – ergs s-1.
6. Shock Front Age and Power
By fitting simple shock models to the surface brightness discontinuity in Hydra A observed at kpc, Nulsen et al. (2005b) estimated an age for the shock of 140 Myr, smaller than the shortest age of 220 Myr for cavity E found here. At its closest point to the AGN, the projected distance from the shock front to the AGN should be very nearly equal to the actual distance, so that the age estimate based on the shock is likely to be the most accurate. Given their relative locations, it is not surprising that an age based on the closest points of the (supersonic) shock front is smaller than any estimate in Table 1 for the age of cavity E. This result is a reminder that a momentum dominated jet can excavate a remote cavity in considerably less time than it would take for the cavity to rise buoyantly from the AGN. It also illustrates that cavity based ages may be too high, and the total power may be underestimated.
The preceding interpretation presupposes that the cavities do not share energy, whereas the radio and X-ray maps show that they might be interlinked (Figure 3). Furthermore, if the cavities are disconnected, then the jet cannot supply power to the outermost cavities that are chiefly responsible for driving the shock. We should then expect the shock to separate rapidly from those cavities. For example, cavity E needs to be overpressured by a factor close to 2 in order to drive the Mach 1.34 shock to the north (Nulsen et al., 2005b). If it is dominated by relativistic gas, then it can only expand adiabatically by about 19 kpc from its current radius, kpc, before coming to local pressure equilibrium. At a speed of (see below), that would take Myr, leaving a narrow window after it is disconnected from the jet in which cavity E can continue to drive the shock. A more plausible alternative is that the cavities remain interconnected. In that case, energy in the inner cavities is only in transit and cannot be used to estimate jet power (in the absence of a much more sophisticated model). Only the outermost cavities, which are the destination of the energy carried by the jet, can be used to estimate its power. If the northern jet remains connected to cavity E, it is also easier to explain how the cavity remains close to the shock front.
In these circumstances, the proximity of the shock to cavity E suggests another estimate for the power of the northern jet. Radio losses are negligible, so that jet power is divided between cavity thermal energy and work done by the expanding cavity, i.e., . Assuming that evolution of the cavity and shock is approximately self-similar, the radius of the cavity scales with the radius of the shock, giving , for kpc, kpc, keV for the unshocked gas (David et al., 2001) and a shock Mach number of 1.34 (Nulsen et al., 2005b). Thus , for the parameters above and a cavity pressure of . If the pressure of the cavity remains constant, including the increase in thermal energy boosts this by , where is the ratio of specific heats for the lobe plasma. Allowing for a decrease in cavity pressure, , modifies the boost to . For self-similar growth, the cavity pressure follows the external pressure and from above, so that, for in the cavity and we get . Although evolution of the cavity and shock is unlikely to be exactly self-similar, this estimate is better determined than those relying on cavity rise times.
7. History of the outburst
Jet power is divided between thermal energy in the cavities, , and the work done by the cavities on the surrounding gas as they expand, i.e., over the history of the cavities (radiation losses are negligible). The ratio is then a diagnostic for the history of an AGN outburst. Increasing cavity volume and decreasing external pressure both tend to make the cavity pressure decrease with time, so that jet power would need to increase rapidly to maintain constant pressure. Thus, unless the jet power is increasing rapidly, . This ratio is smallest when the jet power is declining.
The observations do not give a clear indication of whether the jets are steady, ramping up, or declining. From § 4, the total of for the cavities is erg, which can be compared to the total energy of erg required for the shock model (Nulsen et al., 2005b). In principle, the latter includes both the thermal energy of the cavities and the work done by them. This shock model is spherical, is fitted to the part of the shock front closest to the AGN, and assumes a single, explosive energy injection event at the cluster center, rather than continuous energy injection via jets. These approximations tend to underestimate the thermal energy of the cavities. Nevertheless, the numbers suggest that the ratio is not much smaller than unity. On this basis, the jet power does not appear to be declining rapidly at present.
On the other hand, the sharp bend in the northern jet at cavity C indicates that the jet may not be momentum dominated at larger radii(Nulsen et al., 2005b). If true, the long rise time of cavity E compared to the age of the shock would require that it was partially inflated in an earlier outburst. The earlier outburst contributes to , but not the current shock, so that would be larger than expected for a single outburst. Jet power may then be declining more rapidly than suggested in the preceding paragraph. We note that the shape of the radio source and the properties of cavity D are also consistent with a sharp bend in the southern jet there (see § 4).
There are other indications that the situation is more complex than we might have imagined. For example, cavities C and D may be kept open by the forces required to deflect the jet. If the total jet power is (§ 5) and half of this passes through the northern jet, then its minimum momentum flux is . The force required to deflect the jet through an angle is then , for a deflection of . If the outer wall of cavity C is cylindrical, with radius of curvature kpc and depth (cf. Table 1), the minimum force per unit area on the cavity wall needed to deflect the jet is . This value is increased by a factor of , if the power of the jet is primarily kinetic energy and its bulk speed is . The gas pressure around cavity C is . Thus, the force required to deflect the jet could keep cavity C open if .
Another issue for the history of the outburst is formation of the innermost cavities. In order to open them and/or keep them open, the pressure in cavities A and B must equal or exceed the pressure of the local ICM. Furthermore, any recent pressure increase (change) must be slow in order to avoid creating new shocks around these cavities. Thus, if the innermost cavities were created by a recent boost in AGN power, then it needs to have been gradual, over a timescale significantly longer than their sound crossing time of Myr (Table 1). The pressure in the ICM around cavities A and B is also an order of magnitude greater than that around the outermost cavities. Since the pressure changes are gradual, we can apply Bernoulli’s theorem to the jet (whether relativistic or not) and the large pressure change requires the bulk speed of the jet flow to become highly supersonic (until a shock is encountered).
In summary, it is unclear whether the existence of multiple cavities requires multiple outbursts. The issues raised here highlight the need for more detailed models in order to investigate the history of this system.
8. Discussion
A deep Chandra image of Hydra A has revealed a complex cavity system in the central 300 kpc of the Hydra A cluster indicating a long and equally complex AGN outburst history energetically equivalent to that of a powerful quasar. The AGN has been active either continuously or intermittently for the past several hundred million years, as it has deposited several erg into the surrounding cluster gas. The corresponding jet power is enough energy to offset radiation losses associated with a several hundred cooling flow (eg. David et al., 2001), and to heat the gas well beyond the cooling region. The cavities occupy percent of the volume within 300 kpc of the center, and they lie within about 40 degrees of the plane of the sky. The cavities are filled entirely by 330 MHz radio emission, demonstrating that low frequency radio emission faithfully traces the energy of the outburst.
The association between the observed radio emission and the X-ray cavities implies that these cavities were created and powered by accretion onto a supermassive black hole embedded in the cD. The inferred mass of the black hole based on the relationships between black hole mass, stellar velocity dispersion, and cD galaxy luminosity corresponds to (Rafferty et al., 2006). The power, , liberated over the lifetime of the event implies an accretion rate of , where we have adopted as the mass to energy conversion efficiency. The range of values depends on the adopted age and total energy of the outburst. By comparison, the Eddington rate for a black hole of this mass is , implying the accretion driving the outburst is in the strongly sub-Eddington regime. The Bondi accretion rate implied by the black hole mass and central gas density taken from (Rafferty et al., 2006) is only , which is too small to power an outburst of this magnitude. On the other hand, there is no shortage of cold fuel near the nucleus. Approximately of neutral hydrogen is present in a circumnuclear disk or torus located within 5-30 pc of the nucleus (Taylor, 1996). This material is enough to fuel the outburst for several tens of thousands to several hundred million years. Additional hydrogen and CO is likely present in a larger circumnuclear disk of gas and star formation (McNamara, 1995) in amounts that do not exceed (Edge, 2001).
References
- Benson et al. (2003) Benson, A. J., Bower, R. G., Frenk, C. S., Lacey, C. G., Baugh, C. M., & Cole, S. 2003, ApJ, 599, 38
- Bîrzan et al. (2004) Birzan, L., Rafferty, D. A., McNamara, B. R., Wise, M. W., Nulsen, P. E. J. 2004, ApJ, 607, 800
- David et al. (1990) David, L. P., Arnaud, K. A., Forman, W., Jones, C. 1990, ApJ, 356, 32
- David et al. (2001) David, L. P., Nulsen, P. E. J., McNamara, B. R., Forman, W., Jones, C., Ponman, T., Robertson, B., Wise, M. 2001, ApJ, 557, 546
- De Young (2006) De Young, D. S., 2006, astro-ph/0605734
- Dunn et al. (2005) Dunn, R. J. H., Fabian, A. C., & Taylor, G. B. 2005, MNRAS, 364, 1343
- Edge (2001) Edge, A. C. 2001, MNRAS, 328, 762
- Fabian et al. (2000) Fabian, A. C., et al., 2000, MNRAS, 318, L65
- Heinz et al. (1998) Heinz, S., Reynolds, C. S., Begelman, M. C. 1998, ApJ, 501, 126
- Lane et al. (2004) Lane, W. M., Clarke, T. E., Taylor, G. B., Perley, R. A., Kassim, N. E. 2004, AJ, 127, 48
- McNamara (1995) McNamara, B. R., 1995, ApJ, 443, 77
- McNamara et al. (2000) McNamara, B. R., Wise, M. W., Nulsen, P. E. J., David, L. P., Sarazin, C. L., Bautz, M., Markevitch, M., Vikhlinin, A., Forman, W. R., Jones, C., Harris, D. E. 2000, ApJ, 534, L135
- McNamara et al. (2005) McNamara, B. R., Nulsen, P. E. J., Wise, M. W., Rafferty, D. A., Carilli, C., Sarazin, C. L., Blanton, E. L. 2005, Nature, 433, 45
- Nulsen et al. (2002) Nulsen, P. E. J., David, L. P., McNamara, B. R., Jones, C., Forman, W. R., Wise, M. 2002, ApJ, 568, 163
- Nulsen et al. (2005a) Nulsen, P. E. J., Hambrick, D. C., D. C., McNamara, B. R., Rafferty, D. A., Birzan, L., Wise, M. W., David, L. P. 2005a, ApJ, 625, L9
- Nulsen et al. (2005b) Nulsen, P. E. J., McNamara, B. R., Wise, M. W., David, L. P. 2005b, ApJ, 628, 629
- Pedlar et al. (1990) Pedlar, A., Ghataure, H. S., Davies, R. D., Harrison, B. A., Perley, R., Crane, P. C., Unger, S. W. 1990, MNRAS, 246, 477
- Rafferty et al. (2006) Rafferty, D. A., McNamara, B. R., Nulsen, P. E. J., Wise, M. W. 2006, ApJ, submitted (astro-ph/0605323)
- Taylor (1996) Taylor, G. B. 1996, ApJ, 470, 394
- Vikhlinin et al. (2005) Vikhlinin, A., Markevitch, M., Murray, S. S., Jones, C., Forman, W. R., & Van Speybroeck, L. 2005, ApJ, 628, 655
- Voit (2004) Voit, G. M. 2004, Rev. Mod. Phys., in press (astro-ph/0410173)
- Voit & Donahue (2005) Voit, G. M. & Donahue, M. 2005, astro-ph/0509176
- Wise, McNamara, & Murray (2004) Wise, M. W., McNamara, B. R., & Murray, S. S. 2004, ApJ, 601, 184
- Wu et al. (2000) Wu, K. K. S., Fabian, A. C., & Nulsen, P. E. J. 2000, MNRAS, 318, 889