via Frascati 33, Monteporzio-Catone (RM), I-00040 Italy 22institutetext: Dipartimento di Fisica, Università di Roma Tor Vergata
Via della Ricerca Scientifica 1, I-00133 Rome, Italy 33institutetext: INAF–Osservatorio Astronomico di Brera via Brera 28, I–20121 Milano, Italy. 33email: cocchia@brera.mi.astro.it 44institutetext: Dipartimento di Astronomia, Università di Bologna
via Ranzani 1, I-40127 Bologna, Italy 55institutetext: INAF–Osservatorio Astronomico di Bologna
via Ranzani 1, I-40127 Bologna, Italy 66institutetext: Max Planck Institüt für Extraterrestrische Physik (MPE)
Giessenbachstr. 1, D–85748 Garching, Germany 77institutetext: Harvard-Smithsonian Center for Astrophysics (CfA)
60 Garden str, Cambridge 02138 MA, USA 88institutetext: INAF–IASF
via Bassini 15, I-20133 Milano, Italy 99institutetext: Dipartimento di Fisica, Università Roma Tre
via della Vasca Navale 84, I–00146 Roma, Italy 1010institutetext: INAF–Osservatorio Astrofisico di Arcetri
Largo Enrico Fermi 5, I-50125 Firenze, Italy 1111institutetext: ASI Science Data Center, ASDC c/o ESRIN
via G. Galilei, 00044 Frascati, Italy
The HELLAS2XMM survey: VIII. Optical identifications of the extended sample. 111Based on observations collected at the European Southern Observatory, Prog. ID 67.A-0401, 68.A-0514, 69.A-0563 and 072.A-0633, and at the Telescopio Nazionale Galileo, Prog. ID 1_15_083. Based also on observations made with XMM-Newton, an ESA science mission.
Abstract
Aims. Hard X-ray, large-area surveys are a fundamental complement of ultra-deep, pencil-beam surveys in obtaining a more complete coverage of the AGN luminosity–redshift plane and finding sizeable samples of “rare” AGN.
Methods. We present the results of the photometric and spectroscopic identification of 110 hard X-ray selected sources from 5 additional XMM–Newton fields, nearly doubling the original HELLAS2XMM sample. Their 2–10 keV fluxes cover the range and the total area surveyed is deg2 at the bright flux limit. We spectroscopically identified 59 new sources, bringing the spectroscopic completeness of the full HELLAS2XMM sample to almost 70% over a total area of deg2 at the bright flux limit. We found optical counterparts for 214 out of the 232 X-ray sources of the full sample down to . We measure the flux and luminosity of the [OIII] emission line for 59 such sources.
Results. Assuming tha most high X–ray-to-optical flux ratio sources are obscured QSOs, we use the full HELLAS2XMM sample and the CDF samples, to estimate their logN–logS. We find an obscured QSO surface densities of 5023 and 100–400 deg-2 down to flux limits of and , respectively. At these flux limits the fraction of X–ray selected obscured QSO turns out to be similar to that of unobscured QSO. Since X–ray selection misses most Compton thick AGN, the number of obscured QSO may well outnumber that of unobscured QSOs.
We find that hard X–ray selected AGNs with detected [OIII] emission span a wide range of with a logarithmic median of (2.140.38). This is marginally higher than that of a sample of optically selected AGNs (median 1.69 and interquatile range 0.30), suggesting that optically selected samples are at least partly incomplete, andor [OIII] emission is not a perfect isotropic indicator of the nuclear power. The seven X–ray Bright, Optically Normal Galaxy (XBONG) candidates in the sample have , while their X-ray and optical luminosities and obscuring column density are similar to those of narrow-line AGNs in the same redshift interval (0.075–0.32). This suggests that while the central engine of narrow-line AGNs and XBONGs looks similar, the narrow-line region in XBONGs could be strongly inhibited or obscured.
Key Words.:
X-ray: diffuse background – Surveys – Galaxies: active – Galaxies: evolution1 Introduction
Deep Chandra and XMM–Newton hard X–ray surveys have been able to detect the sources making the majority of the Cosmic X-ray Background (XRB) below 6–7 keV (Giacconi et al. 2002, Bauer et al. 2004, Moretti et al. 2003, Worsley et al. 2004, Brandt & Hasinger 2005). However, deep surveys cover only a fraction of square degree of sky making difficult to find sizable samples of medium- and high-luminosity sources. To obtain a more complete coverage of the redshift-luminosity plane, complementing deep surveys, and to compute an accurate luminosity function over wide luminosity and redshift intervals, a much larger area, of the order of a few square degrees, needs to be covered. Furthermore, large-area surveys can also provide sizeable samples of “rare” objects. To these purposes, we are carrying out the HELLAS2XMM serendipitous survey using suitable XMM–Newton archival observations (Baldi et al. 2002). As a first step, we have presented in Fiore et al. (2003) the optical identification of 122 hard X-ray selected sources detected in five XMM–Newton fields (hereafter the 1dF sample). Here we report the results of the photometric and spectroscopic identification of 110 X-ray sources from five additional XMM–Newton fields, hereafter the HELLAS2XMM second source sample, nearly doubling the original HELLAS2XMM sample and bringing the total area surveyed to about 1.4 deg2 at a flux limit of .
One of the most interesting findings of the optical identifications of the HELLAS2XMM sample, as well as of other hard X–ray selected Chandra and XMM–Newton surveys (see, e.g., ChaMP: Silverman et al. 2005; SEXSI: Eckart et al. 2005; CLASXS, CDFN, CDFS: Barger et al. 2005; CDFS, CDFN: Giacconi et al. 2002, Hasinger et al. 2003; XMM/2dF Georgakakis et al. 2004; HBS: Della Ceca et al. 2004) is the discovery that AGN activity spans a range of properties much wider than it was thought based on optically and soft X–ray selected AGNs. Indeed, hard X–ray selection provides a more complete view of AGN activity, being more efficient in selecting sources possibly missed by selection in other bands. For example, obscured and low–luminosity AGN several of which are left out in optical or soft X–ray selected samples. While most of optically and soft X–ray selected AGNs have an X–ray-to-optical (Rband) flux ratio X/O 222, where C depends on the chosen X–ray band and optical filter. between 0.1 and 10 (see, e.g., Maccacaro et al. 1988, Laor et al. 1997, Hasinger et al. 1998, Mineo et al. 2000), XMM–Newton and Chandra hard X–ray surveys have selected AGNs with X–ray-to-optical flux ratio well outside this range. In particular, the HELLAS2XMM survey has detected both a population of relatively bright X–ray sources with faint optical counterparts (and thus characterized by high X/O values; Fiore et al. 2003) and several X–ray sources in otherwise inactive and optically bright galaxies (with relatively low X/O ratios; named X–ray bright, optically normal galaxies, XBONGs, Fiore et al. 2000, Comastri et al. 2002).
The former population includes about 15–20% of the sources selected in the 2–10 keV band to have X/O more than one order of magnitude higher than that of typical broad-line, type 1 AGNs. Based on optical spectroscopy (Fiore et al. 2003), optical-to-near–infrared colors (Mignoli et al. 2004), near-infrared (Maiolino et al. 2006) and X–ray spectroscopy (Perola et al. 2004), we concluded that the majority of the HELLAS2XMM sources with X/O are optically obscured QSOs at z. At fainter X–ray and optical fluxes, the situation is less clear, mainly because most of the optical counterparts of the high X/O sources are unaccessible to optical spectroscopy even with 10m-class telescopes.
The XBONGs, on the other hand, are found at low redshift ( 0.1–0.3), with X–ray luminosities between and erg s-1, bright optical counterparts (R), thus relatively low X/O, and absorption–dominated optical spectra without strong nuclear emission (Comastri et al. 2002). It has been suggested that XBONGs selected in Chandra and XMM–Newton surveys are actually typical AGNs classified as normal galaxies just because of some observational biases (dilution of the nuclear spectrum by the host galaxy, inadequate set–up for optical spectroscopy in terms of wavelength range covered, signal-to-noise ratio, spatial resolution, see e.g. Moran et al. 2002, Severgnini et al. 2003, Georgantopoulos & Georgakakis 2005).
In this paper we present the optical identification follow–up observations of five additional fields of the HELLAS2XMM survey and focus the discussion on both the high X/O sources and the XBONGs, providing quantitative constraints to the space density of highly optically obscured, high-luminosity QSOs and proposing a quantitative definition of XBONGs. The paper is organized as follows: Sections 2 and 3 present the results of the optical photometric and spectroscopic identifications of the HELLAS2XMM second source sample; Section 4 discusses our main findings; Section 5 reports our conclusions. A km s-1 Mpc-1, =0.3, cosmology is adopted throughout.
2 Optical identifications
The HELLAS2XMM second source sample includes sources detected in the
2–10 keV band in five XMM–Newton fields: A1835,
IRAS133492438, GD153, Mrk421, BPM16274 (see Baldi et al. 2002 for
details on the observations and X–ray data reduction). We have
obtained relatively deep (exposure time 3–15m per image, limiting
magnitude R=24–25) optical images for the majority of the sources in
these five fields using EFOSC2 at the ESO 3.6m telescope, FORS1 at VLT
and DOLORES at the TNG.
We exclude from the following analysis those
areas, in the five fields, not covered by Rband images. This,
together with the fact that Mrk421 field has been observed in
window mode and that a large-area centered on the A1835 cluster of
galaxies has been excluded from the analysis,
reduces the total area
surveyed to about 0.5 deg2. The total number of hard X–ray
selected sources making the HELLAS2XMM second source sample is
110, bringing the total number of sources in the full HELLAS2XMM
sample with optical coverage to 232 in ten XMM–Newton
fields.
Optical images were bias subtracted, flat–field divided, and flux calibrated using observations of standard stars acquired during each night. Optical and X-ray images were brought to a common astrometric reference frame using bright AGNs (from 5 to 15 AGNs per field). Typical systematic shifts were of the order of 1′′, the maximum shift was of .
Source detection in the optical images was performed using the SExtractor package (Bertin et al. 1996) and we visually searched for optical counterparts of the X–ray selected sources within a conservative matching radius of 6 arcsec from the astrometrically corrected X-ray centroid. For X-ray sources with multiple optical counterparts we provide, in Table 1, the probability P of chance coincidence333 where r is the X–ray–optical displacement and n(R) the number counts of galaxies as a function of their magnitude from Metcalfe et al. (2001) (see also Brusa et al. 2003).
Optical counterparts brighter than R within from the X–ray position were found for 103 sources. For 15 of them there are two candidate counterparts inside the X–ray error–box. Table 1 gives for each source the X–ray position, the position of the most likely optical counterpart (identified on the basis of its magnitude, displacement from the X-ray position and probability of chance coincidence, classification of the optical spectrum), the displacement between the X–ray and optical positions, the X–ray flux and the R magnitude (or lower limit) of the optical counterpart. In three cases, more than one optical source might contribute to the detected X-ray emission (see notes to Table 1).
The average displacement between the X–ray centroid and the position of the most likely optical counterparts is of . For % of the sources the displacement is (see figure 1). These shifts are slightly worse than those found for the HELLAS2XMM 1dF sample (average displacement of and 80% of the sources within , Fiore et al. 2003), most likely because the average off-axis angle (and therefore the average Point Spread Function) of the sources in the second sample is higher than for the sources in the 1dF sample, due to the exclusion of the central parts of two fields (Mrk421 and A1835).

3 Optical spectroscopic redshifts and classification
Our main effort was that of starting to explore the region of high XO values to obtain an optical spectroscopy as uniform as possible regarding the X–ray to optical flux ratio. This has been roughly achived up to =40, which corresponds to R24 for 2–10 keV fluxes of 10-14 . Most of the HELLAS2XMM sources have X–ray flux higher than this figure.
Optical spectra of 59 out of the 110 sources with optical counterparts brighter than R=24 have been obtained using EFOSC2 at the ESO 3.6m telescope, DOLORES at the TNG and FORS1 at the VLT/UT1 during 6 observing runs performed between August 2001 and March 2004. A total of 12 nights at the 3.6m and TNG telescopes and hours of VLT time have been devoted to this program.
Long slit spectroscopy has been carried out in the 3800-10000 Å band with resolution between 7 and 13 Å. Data reduction was performed using both the MIDAS (Banse et al. 1983) and IRAF444IRAF is distributed by the National Optical Astronomy Observatories, which is operated by the Association of Universities for Research in Astronomy, Inc., under cooperative agreement with the National Science Fundation. packages. Wavelength calibrations were carried out by comparison with exposures of He-Ar, He, Ar and Ne lamps. The flux calibration of the spectra was obtained using observations of spectro-photometric standard stars (Oke, 1990) performed within a few hours from the spectroscopy of our sources.
Regardless of the optical spectra, our discriminant for supermassive black hole accretion is high X–ray luminosity; we classify a source as an AGN if it has an X–ray luminosity log ; if a source has an X–ray luminosity log we classify it as a QSO candidate. Following Fiore et al. (2003), objects with permitted emission lines broader than 2000 km/s (FWHM)555Removing the instrumental broadening from the line profile, the adopted velocity threshold corresponds to an intrinsic FWHM of km/s. are classified type 1 AGN or QSO; objects with permitted emission lines narrower than this threshold and strong (equivalent width EW Å) [OIII], MgII, NeV or CIV emission lines are classified type 2 AGN; objects with faint (equivalent width EW Å) [OIII] andor strong [OII] or H and no high ionization emission lines are classified Emission-Line Galaxies (ELGs). In one case the presence of broad emission lines in the optical spectrum cannot be excluded due to the insufficient quality of the spectrum and the classification of the object is therefore uncertain (see notes in Table 1). Objects without strong emission lines but with stellar absorption lines and a red continuum are classified as Early Type Galaxies (ETGs, or XBONGs as they are X–ray bright sources with optical spectra typical of early type galaxies). Table 1 gives for each source the classification of the optical spectrum, the redshift and the X-ray luminosity.
|
|
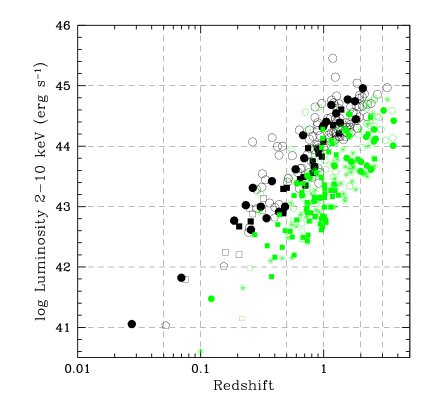
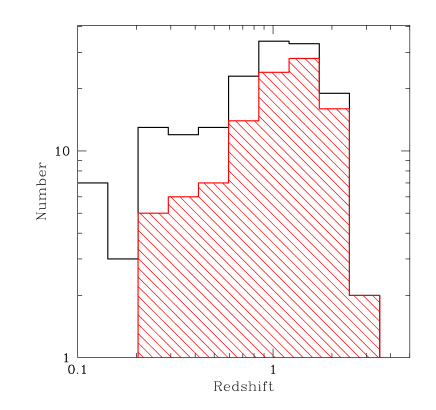
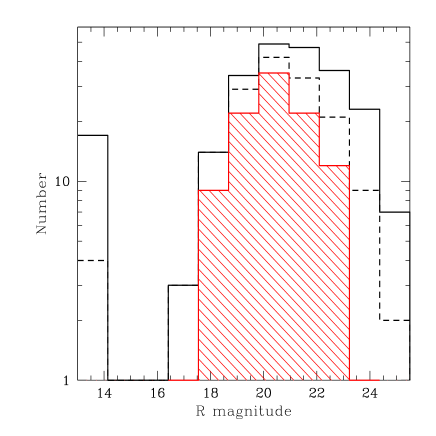
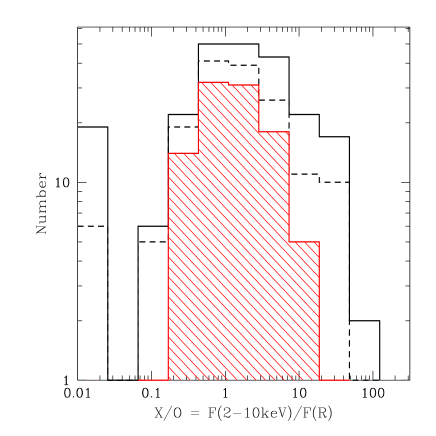
In the c) and d) panels the hatched histograms refer to type 1 AGN only, the dashed histograms to the source population with spectroscopic z, the continuous histograms to the whole source population.
The source breakdown includes: 41 broad-line AGNs (QSOs and Seyfert 1 galaxies, log and log, respectively); 9 narrow-line AGNs (type 2 QSOs and Seyfert 2 galaxies); 5 emission-line galaxies, all with log and therefore all probably hosting an AGN; 2 early-type galaxies, both with log and, therefore, XBONG candidates, probably hosting an AGN; 1 group of galaxies; 1 star. In summary, 57 of the 59 sources with optical spectroscopy are associated with AGN emission, the majority (69%) are type 1 AGNs. This brings the number of confirmed AGNs in the full HELLAS2XMM sample to 155 out of 159 with a spectroscopic redshift.
The four panels of figure 2 show the redshift-luminosity plane, and the redshift, R magnitude, X–ray-to-optical flux ratio histograms for the full HELLAS2XMM sample. The observed fraction of type 1 AGNs increases strongly with redshift, corresponding to of the whole source population with a spectroscopic redshift higher than 1.5. Conversely, the fraction of type 1 AGNs decreases strongly with increasing X–ray-to-optical flux ratio and with the magnitude of the optical counterpart of the X-ray source, with only one of the eleven sources with R23.3 and a spectroscopic redshift identified as a type 1 AGN ( see Fiore et al. 2003, La Franca et al. 2005, Eckart et al. 2006, Silverman et al. 2005, Treister et al. 2005, Steffen et al. 2004 for similar results and more detailed discussions). This suggests that the lack of high–z type 2 AGNs in the sample of spectroscopically identified HELLAS2XMM sources (Fig.2, upper right panel) can be probably due to the incompleteness of the sample: at z1.5 the R–band magnitude of the optical counterparts of type 2 AGN is often beyond the spectroscopic limit of our sample (R). Furthermore, even for objects brighter than the spectroscopic limit, the optical nucleus is so dim that the redshift determination is complex for the lack of observable lines, the so called spectroscopic redshift desert at z=1.5–2.
3.1 Optically obscured AGN
Following Fiore et al. (2003), we limit ourselves to consider two broad AGN categories: optically unobscured AGN, i.e. type 1, broad emission line AGN, and optically obscured AGN, i.e. non type 1 AGN, in which the nuclear optical emission is totally or partly reduced by dust and gas in the nuclear region and/or in the host galaxy. The fraction of optically obscured AGN with respect to the total number of identified X–ray sources is approximately 27% (16 out of 59 X–ray sources, see also the source breakdown). Two examples of such sources are reported in figure 3. The FWHM of GD153_236 (H2XMMJ125654.1+215318; z=0.909, AGN2) is km s-1. Faint [OII] and [OIII] emission is present in the spectrum of A1835_262 (H2XMMJ140130.8+024532; z=0.746, ELG). The latter source is obscured also in the X-ray band, having a 0.5-2 keV flux less than 20 times the observed 2-10 keV flux; to be more quantitative, the X–ray spectral fit yields a rest frame NH(z) cm-2, fixing the spectral energy index (F(E) E) to 0.9. GD153_236 is less extreme in this regard, the X–ray spectral fit yields a rest frame NH(z) = cm-2, fixing the spectral energy index to 0.9. The 2–10 keV intrinsic luminosity is erg s-1 for A1835_262 and erg s-1 for GD153_236, making them obscured QSO candidates.
We are interested in finding a statistical method to select highly obscured QSOs candidate among the still unidentified sample sources in order to estimate their surface density. To this purpose, in the following, we will make use of observed quantities, such as the observer–frame absorbing column NH and the X/O ratio. We use the results of our spectroscopic identifications to calibrate and validate this statistical method.
The observed-frame absorbing column NH(z=0) (computed from the hardness ratios following Fiore et al. 2003) as a function of X/O for the full HELLAS2XMM sample is reported in figure 4 (left panel). We note that the part of the diagram at X/O8 and log NH(z=0) is populated mainly by narrow-line objects. More quantitatively, 16 out of the 20 objects with optical spectroscopy are, according to the definition of Fiore et al. (2003), optically obscured AGNs (i.e., ).
Since the observed log NH=21 would correspond to a rest-frame
column density of log NH = 21.5 at =1, most of these AGNs,
having redshifts z1, are also X–ray obscured (see also Mainieri
et al. 2002). The right panel of figure 4 shows X/O as a
function of the 2-10 keV luminosity for the HELLAS2XMM full source
sample. This figure clearly shows that most optically obscured AGN
with X/O8 have high-luminosities (log L (2- 10 keV) ),
highlighting the efficiency of a selection based on the observed X/O
ratio to find highly obscured QSO candidates.
The number of
spectroscopically identified sources in the HELLAS2XMM sample with
log NH(0)21, X/O8 and
log L(2-10 keV) is 17. 13 of these are optically obscured AGN,
i.e. a fraction of 0.76.
The diagram in the left panel
of figure 5 shows the NH(0) as a function of X/O ratio for
the CDFS and CDFN sources ( Giacconi et al. 2002, Alexander et al.
2003, Barger et al. 2003, Szokoly et al. 2004) selected by Fiore
(2004) by having 2-10 keV fluxes larger than and off
axis angles lower than 10 arcmin. Unfortunately, most of the sources
from these samples with X/O8 and log NH(z=0) do not have a
spectroscopic redshift666As regard the optical classification
of the CDFS and CDFN identified sources we applied, where possible,
our classification criteria. The X–ray fluxes are taken from
Alexander et al. (2003). The catalog reports 2–8 keV fluxes converted
to 2-10 keV fluxes using a power–law model with spectral energy index
=0.8.: in the following analysis we will assume that the
fraction of optically obscured AGN in these faint sources is similiar
to the fraction in the HELLAS2XMM sample, i.e. a fraction of
0.76. Assuming the fraction of optically obscured
QSOs, it is possible to compute their integral number counts
relations which are compared with the logN–logS of the entire samples
in figure 5b). Number counts and relative sky coverages are
also tabulated in Table 2.


|


|
cc
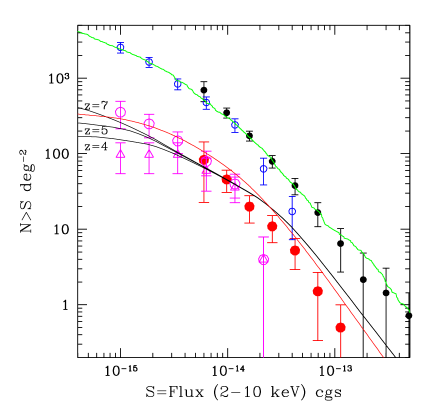
The line of reasoning followed to compute the fraction of optically obscured QSOs implies that the Fiore et al. (2003) relationship between X/O and log L(2–10 keV) may be directly applicable to the CDFS and CDFN sources with the faintest optical counterparts, assuming that also these sources are very likely high-luminosity objects, including them among the optically obscured QSO population. However, Bauer et al. (2004) and Barger et al. (2005) pointed out that the Fiore et al. (2003) relationship could not be valid at faint (R 25.5) optical magnitudes. For this reason, we re-computed the optically obscured QSO number counts by excluding all X-ray sources with optical counterparts fainter than R=25.5 (open triangles in figure 5b). This is probably a lower limit to the ”true” type 2 QSO surface density. In summary, we find a highly obscured QSO density of 45 and 100–350 deg-2 at flux limits of and , respectively (see figure 5b). The fraction of obscured QSOs to the total number of X–ray sources selected in the 2–10 keV band is therefore and between 4–14% at the two flux limits.

|
| F(2-10 keV) | Sky-coverage | Tot. N.C. | QSO2 N.C. | QSO2 N.C.(R25.5) |
|---|---|---|---|---|
| ( ) | (deg2) | (deg-2) | (deg-2) | (deg-2) |
| HELLAS2XMM | ||||
| 11.3 | 1.39 | 5.72.8 | 0.50.5 | |
| 6.93 | 1.37 | 165.1 | 1.61.4 | |
| 4.25 | 1.25 | 388.7 | 5.73.1 | |
| 2.60 | 0.98 | 7915 | 12.06.1 | |
| 1.60 | 0.5 | 17026 | 21.911.3 | |
| 0.98 | 0.11 | 35053 | 50.123.2 | |
| 0.60 | 0.015 | 700210 | 91.173.0 | |
| CDFS+CDFN | ||||
| 4.00 | 0.174 | 179.9 | - | - |
| 2.16 | 0.174 | 6324 | 4.34.6 | 4.34.6 |
| 1.17 | 0.174 | 24050 | 4321 | 3919 |
| 0.63 | 0.174 | 47589 | 8743 | 6537 |
| 0.34 | 0.14 | 840140 | 16274 | 10658 |
| 0.18 | 0.07 | 1640250 | 272130 | 10658 |
| 0.10 | 0.06 | 2560410 | 388200 | 10658 |
3.2 X–ray Bright Optical Normal Galaxies
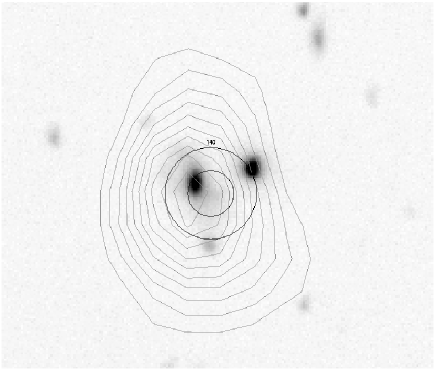
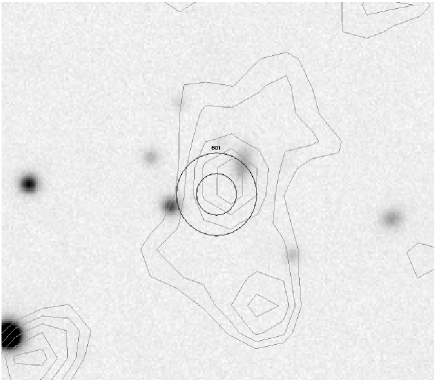
In figure 6 we show the R–band images of the XBONG
candidates with the largest X–ray to optical position difference.
Superimposed are the X–ray position error boxes (3” and 6” black
circles) and the X–ray contours (grey).
Close to the X-ray position
of A1835_140 there are 2 optically bright sources, one within 3”
from the X–ray centroid and the other at 6.6”; both sources are
clearly extended and their morphology is consistent with a spheroid.
No optical point–like nucleus is evident in both sources (see, also,
Civano et al. 2006, in preparation).
The X-ray contours are well
centered on the source we identified as the optical counterpart of the
X-ray source.
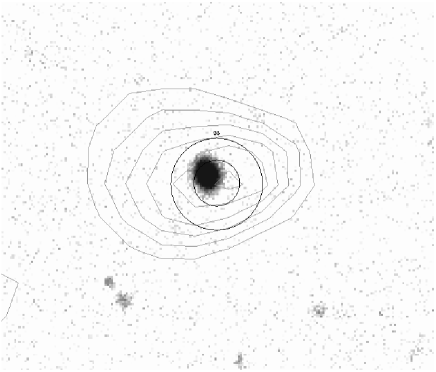
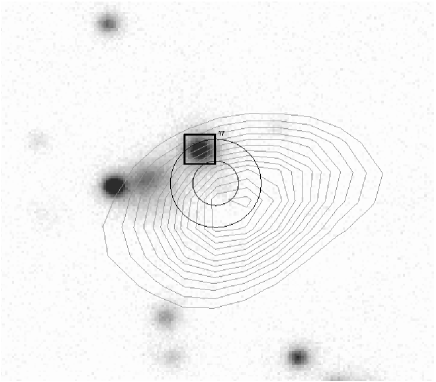
The R-band images of PKS0312_17
(H2XMMJ031124.8-770139) and PKS0312_501 (H2XMMJ030952.2-764927) are
reported in the bottom panels; the optical counterpart identified for
PKS0312_17 lies at 4.6” from the nominal X–ray centroid but it is
coincident with a relatively bright radio source (the square refers to
the radio centroid, 4” width, see Brusa et al. 2003 for details). We
therefore consider this optical source as the most likely counterpart
of the X–ray source. As we can see in fig. 6, the X-ray
centroid of PKS0312_501 provided by the detection alghorithm is
slightly shifted from the peak of the X–ray contours, which is
coincident with the optical countepart. We therefore consider as
reliable also this identification.
A paper discussing in more detail
these sources and presenting near–infrared imaging is in preparation
(Civano et al. 2006). As an example, figure 7 shows the
spectra of 2 XBONGs, which we tentatively classify as early-type
galaxies based on the strong red continuum and the absence of emission
lines (however, note that these spectra do not cover the H
transition).
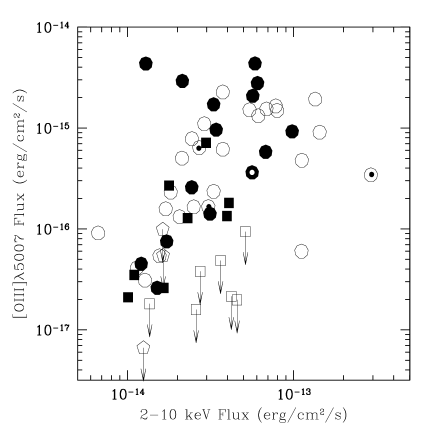
3.3 [OIII] emission
For 59 of the 159 optical spectra of the full HELLAS2XMM sample the [OIII] line falls in the observed wavelength range. We measured777The [OIII] fluxes were measured performing a Gaussian fit of the line using the standard IRAF task splot. significant [OIII] emission in 49 cases: 26 broad-line AGNs, 23 narrow-line AGNs (including 8 objects with optical spectra classified as emission-line galaxies but with 2-10 keV luminosity higher than erg s-1). In the remaining 10 cases, 7 candidate XBONGs and 3 galaxies belonging to groups or small clusters of galaxies, we computed the 3 upper limits (see Table 3).
Figure 8a) shows the [OIII] flux as a function of the 2-10 keV flux, while figure 8b) shows the rest-frame NH (computed using flux ratios, see Fiore et al. 2003) as a function of the ratio between the 2-10 keV and the [OIII] luminosities for the 59 objects. Note that the XBONG candidates, in figure 8a), have sistematically lower [OIII] fluxes compared with other sources with the same X–ray flux and have . The only other HELLAS2XMM AGN with a X–ray–to–[OIII] luminosity ratio well above this value is the broad line AGN A2690_3, a Seyfert 1 galaxy at z=0.433 with a strong broad MgII and lines but very faint [OIII] emission888See http://www.bo.astro.it/hellas/sample.html. Other three HELLAS2XMM AGN have . This suggests that AGNs with small [OIII] emission are probably more common than what was thought before and the the XBONGS are the tip of the iceberg of these source population.
|
|


|

|
4 Discussion
The hard X-ray selection and the good photometric and spectroscopic coverage of the ten HELLAS2XMM fields allow us to probe AGN activity over a wide range of broad band properties. In this paper we focus our attention on two extremes of the AGN activity: on one side, sources with high X–ray-to-optical flux ratio, the majority of which turned out to be the so far “elusive” high-luminosity, highly obscured type 2 QSOs; on the other side, sources with relatively low X–ray-to-optical flux ratios, moderately luminous ( erg s-1) active nuclei in otherwise inactive galaxies, the so called XBONGs.
4.1 The high X/O flux ratio sources
As far as the first topic is concerned, we confirm the finding that about 20% of hard X–ray selected sources have an X–ray-to-optical flux ratio which is, on average, one order of magnitude or more higher than that of optically selected AGNs. Our spectroscopic identifications suggest that 76% of the sources with X/O8 and log NH(z=0) are highly obscured QSOs at =0.7–2 (see also Table 1). This implies a number density of optically obscured QSOs of deg-2 at a flux limit of . Within the reasonable hypothesis that the fraction of obscured QSOs among the sources with X/O8 and log NH(z=0) remains constant down to fluxes of , an obscured QSOs density of deg-2 is implied. A much more conservative estimate of the obscured QSO space density ( deg-2 at ), which should probably be considered as a lower limit, is obtained assuming that all sources with optical counterparts fainter than R=25.5 have X–ray luminosities below the highly obscured QSO threshold.
The three black solid curves in figure 5b) superimposed to the number counts of high-luminosity, highly obscured objects from both HELLAS2XMM and CDFS+CDFN samples are the number counts of obscured QSO predicted by the Comastri et al. (1995, 2001) XRB synthesis models. These models assume an evolution of the X–ray luminosity function parameterized by a pure luminosity evolution (PLE) law [] up to = 1.5 and constant up to a maximum redshift zmax (zmax=4,5,7; see figure 5b). These predictions (depending also on the adopted maximum redshift) lie in between the two number counts obtained assuming that 70% of the high X/O sources are obscured QSOs or including in the obscured QSO sample sources with optical counterparts brighter than R=25.5 only, respectively. The red curve in the figure 5b) represents the prediction obtained by the luminosity dependent density evolution (LDDE) model of the hard X–ray luminosity function described in La Franca et al. (2005). Not surprisingly, the shape of the number counts relations obtained by integrating the PLE and the LDDE models are different. The latter slightly overpredicts the highly obscured QSO number counts at fluxes , while at lower fluxes agrees pretty well with the expectations based on the identification of obscured QSOs with 70% of the high X/O sources (see Section 3.1). The same model predicts that the number of obscured QSO with logL(2-10keV) is comparable to that of unobscured QSO. A similar conclusion was found by Perola et al. (2004) using a smaller source sample (the HELLAS2XMM 1dF sample). However, most of these hard X–ray selected highly obscured QSOs have column densities in the range cm-2 with only a handful of the faintest sources which could be Compton thick (NH 1024 cm-2). According to the most recent version of the AGN synthesis models for the X–ray background (Gilli et al. 2006), the fraction of Compton-thick AGN in deep XMM–Newton and Chandra surveys is expected to be at most a few percent. Indeed, Tozzi et al. (2006) find that only about 4 % of the sources in the CDFS have a 0.5–8 keV spectrum consistent with Compton-thick absorption and/or pure reflection. Therefore, we still may be viewing just the tip of the iceberg of highly obscured sources at high–redshift.
An approach to find highly obscured, Compton-thick, QSOs is to select sources with QSO luminosities in the mid–infrared band and faint or extremely faint near–infrared and optical counterparts. Martinez-Sansigre et al. (2005) estimate that probably more than half of the high-luminosity QSOs are highly obscured, although with large uncertainties. Unfortunately, the X–ray properties of infrared selected sources are not known, and therefore it is difficult to understand how the mid–infrared selection compares with the X–ray one. In particular, it is not clear what is the fraction of the mid–infrared selected highly obscured QSOs which would have been selected by hard X–ray surveys, and whether the mid-infrared selection is truly more efficient in discovering Compton-thick sources. To answer to these questions we can take advantage of the study of fields with both X–ray and mid–infrared coverage; for example, we have under analysis Spitzer observations of 12 HELLAS2XMM sources (Pozzi et al. in preparation). Furthermore, the study of the ELAIS-S1 (Puccetti et al. 2006) and the COSMOS fields, and/or deep X–ray follow-up observations of the mid–infrared selected sources in the Spitzer First Look Survey (Martinez-Sansigre et al. 2005) will certainly bring new light on this topic.
4.2 XBONGs
At the other extreme of the X–ray-to-optical flux ratio distribution, we find the other class of “elusive” AGN (i.e., XBONGs), objects which have Seyfert–like X–ray luminosities but without any signature of nuclear activity in either optical imaging or spectroscopy (Comastri et al. 2002; Moran et al. 2002; Severgnini et al. 2003). In order to provide a quantitative definition of these objects, the flux and luminosity of the [OIII] emission (or their upper limits) are measured for the 59 spectra in the full HELLAS2XMM sample that cover this transition. The HELLAS2XMM AGNs with [OIII] detection have a ratio between 3 and 1000 with a logarithmic median and interquartile range of 2.140.38. This is systematically higher than optically selected sources. As an example, unobscured PG quasars at z0.4 have in the range 6-500 (Laor et al. 1997), Compton thin, Seyfert 2 galaxies have between 3 and 50 while Compton-thick Seyfert 2 galaxies have between 0.03 and 1 (Maiolino et al. 1998, Bassani et al. 1999). All the HELLAS2XMM AGNs have and therefore, as discussed above, no Compton-thick object (log) is likely to be present in the HELLAS2XMM sample. The discrepancy between the ratio of the HELLAS2XMM AGN and optically selected AGNs could be due to the fact that the [OIII] luminosity of the HELLAS2XMM AGN is not corrected for reddening. This correction can be very large for highly obscured sources. Indeed, the typical correction in Bassani et al. (1999) is a factor between 2 and 10, with a few extreme objects with a correction approaching 50. The logarithmic median and its interquartile range of a sample of 24 Compton thin, narrow line AGN from the catalogs of Maiolino & Rieke (1995) and Bassani et al. (1999), obtained without correcting for extinction, plus 17 PG quasar from the Laor et al (1997) sample (41 sources in total), is 1.690.30, lower than the median of the HELLAS2XMM sources. The probability that the two log distributions are drawn from the same parent population is 1.8%, using the Kolmogorov-Smirnov test. The higher ratio of X-ray selected AGN with respect to optically selected AGN is intriguing, because it suggests that the latter samples are at least partly incomplete, and that [OIII] emission is not a perfect isotropic indicator of the nuclear power. However, this must be confirmed by using larger samples with both good X-ray and [OIII] determinations.
Narrow-line AGNs tend to have higher column densities than broad-line AGNs, but we do not see any correlation between the column density and (see figure 8b). On the other hand, XBONG candidates have lower [OIII] fluxes compared with the other sources with similiar X–ray flux (see figure 8a) and have (see figure 8b). This suggests that the ratio is a robust index to define X-ray bright but optically normal galaxies (XBONGs), at least in the X-ray and [OIII] flux ranges covered by the present observations. Note that this classification criterion is nearly independent by the galaxy dilution of the nuclear spectrum, which has been suggested to be a key ingredient in the classification of XBONGs (see Severgnini et al. 2003, Moran et al. 2002, Georgantopoulos & Georgakakis 2005), since it is related to a direct measurement of the line flux and not to its equivalent width. Indeed, the main issue about the XBONGs nature is whether they are just typical AGNs (in terms of both X–ray and line emission luminosity) or, rather, they represent a truly distinct class. Our results strongly point towards the latter hypothesis.
To further investigate this issue, we compared the 7 XBONG candidates to 7 narrow-line AGNs found in the same redshift interval (0.075–0.32). XBONGs and narrow-line AGNs have very similar X–ray luminosity (median log L(2-10 keV)= 42.94 vs. 42.76), optical luminosity (median L(R)= 10.60 vs. 10.77 L⊙), X–ray–to–optical flux ratio (median X/O= 0.35 vs. 0.26) and absorbing column densities (median log NH = 21.8 vs. 21.6). On the other hand, while the narrow-line AGNs have median [OIII] flux and luminosity of and erg s-1, XBONGs have 3 upper limits in the ranges and erg s-1, i.e., 10–50 times lower than narrow-line AGNs. The above findings suggest that while the central engine of narrow-line AGNs and XBONGs is likely to be the same, narrow emission lines in XBONGs are strongly inhibited or obscured.
At least three possibilities are envisaged to explain the lack of optical line emission:
-
•
1) the physical size of the narrow emission-line region could be reduced with respect to normal AGNs, or even absent (see, e.g., Hawkins 2004)
-
•
2) the optical-UV nuclear continuum could be screened by circumnuclear absorbing gas and dust covering a large solid angle at the nuclear engine, so that the ionizing radiation does not (or only partially) reach the narrow emission-line clouds;
-
•
3) the emission lines could be quenched by obscuring dust spatially distributed on larger scales (i.e., kpc dust lanes) as observed in HST images of nearby Seyfert 2 galaxies (Malkan et al. 1998)
To disentangle between these hypotheses, we are pursuing an intensive multiwavelength observing strategy, including further high angular resolution X–ray imaging with Chandra, and spatially resolved optical spectroscopy with the VIMOS Integral Field Unit at VLT.
5 Conclusions
We have obtained optical photometry and spectroscopy for a sample of 110 sources detected in the 2–10 keV band in five additional XMM–Newton fields of the HELLAS2XMM serendipitous survey, covering additional 0.5 deg2 of the sky at the bright flux limit (see Table 2). We report the spectroscopic identification of 59 new redshifts, bringing to 159 the total number of X–ray sources with redshift identifications in the full HELLAS2XMM sample (including the three near-infrared spectroscopic redshifts reported by Maiolino et al. 2006).
Combining the redshift information of the HELLAS2XMM sample with that available in the CDFS and CDFN surveys, the fraction of highly obscured type 2 QSOs is estimated to be of the order of 13% of the total, rather independent from the X–ray flux for F(2-10 keV) . This result is in rough agreement with the Comastri et al. (2001) and La Franca et al. (2005) models and implies that about half of the luminous AGNs (logL(2-10keV)) are obscured.
We find that the 7 XBONG candidates in the full HELLAS2XMM sample have
, while all but one of the other
HELLAS2XMM AGNs have an X–ray-to-[OIII] ratio well below this
value.
Although the sample is very small and, therefore, subject to large uncertainties,
our results suggest that this ratio can be used to efficiently
select XBONG candidates. Multiwavelenght works with further surveys are needed to
strengthen this result.
This research has been partially supported by ASI, INAF–PRIN 270/2003 and MIUR Cofin-03-02-23 grants. We acknowledge an anonymous referee for comments that improved the presentation. We thanks L. Pentericci, P. Tozzi and P. Severgnini for useful discussions.
References
- (1) Alexander, D. M., Bauer, F. E., Brandt, W. N. et al. 2003, AJ, 126, 539
- (2) Baldi, A., Molendi, S., Comastri, A. et al. 2002, ApJ, 564, 190
- (3) Banse, K., Crane, P., Grosbol, P. et al. 1983, The Messanger, 31, 26
- (4) Bassani, L., Dadina, M., Maiolino, R.et al. 1999, ApJS, 121, 473
- (5) Barger, A. J., Cowie, L. L., Capak, P. et al. 2003, AJ, 126, 632
- (6) Barger, A.J., Cowie, L.L., Mushotzky, R.F. et al. 2005, AJ, 129, 578
- (7) Bertin,E. & Arnouts, S. 1996, A&AS, 117, 393
- (8) Bauer, F. E., Alexander, D. M., Brandt, W. N. et al. 2004, AJ, 128, 2048
- (9) Brandt, W.N., Hasinger, G. 2005, ARA&A, 43, 1056
- (10) Brusa, M., Comastri, A., Mignoli, M., et al. 2003, A&A, 409, 65.
- (11) Civano et al. in preparation
- (12) Comastri, A., Setti, G., Zamorani, G., & Hasinger, G. 1995, A&A, 296, 1
- (13) Comastri, A., Fiore, F., Vignali, C. et al. 2001, MNRAS, 327, 781
- (14) Comastri, A., Mignoli, M., Ciliegi, P. et al. 2002, ApJ, 571, 771
- (15) Comastri, A. 2004, in ”Supermassive Black Holes in the Distant Universe”, Ed. A. J. Barger, Kluwer Academic, vol. 308, p.245
- (16) Croom, S. M., Boyle, B. J., Loaring, N. S. et al. 2002 MNRAS, 335, 459
- (17) Della Ceca, R., Maccacaro, T., Caccianiga, A. et al. 2004, A&A, 428, 383
- (18) Eckart, M.E., Laird, E.S., Stern, D. et al. 2005, ApJS, 156, 35
- (19) Eckart, M.E., Stern, D., Helfand, D. et al. 2006, ApJS, 165, 19
- (20) Fiore, F., La Franca, F., Vignali, C. et al. 2000, NewA, 5, 143
- (21) Fiore, F., Brusa, M., Cocchia, F. et al. 2003, A&A, 409, 79
- (22) Fiore, F. 2004, NuPhS, 132, 69
- (23) Georgakakis, A. et al. 2004, MNRAS, 349, 135
- (24) Georgantopoulos, I. & Georgakakis, A. 2005, MNRAS, 358, 131
- (25) Giacconi, R., Zirm, A., Wang, J., et al. 2002, ApJS, 139, 369
- (26) Gilli R., Comastri A., Hasinger G. A&A, submitted
- (27) Hasinger, G., Burg, R., Giacconi, R. et al. 1998, A&A, 329, 482
- (28) Hasinger, G. 2003, proceedings of the Conference: The Emergence of Cosmic Structure, Maryland, Stephen S. Holt and Chris Reynolds (eds), astro-ph/0302574
- (29) Hawkins, M.R.S. 2004, A&A 424, 519
- (30) Kauffmann, G., Heckman, T. M., Tremonti, C. et al. 2003, MNRAS, 346, 1055
- (31) La Franca, F., Fiore, F., Comastri A. et al. 2005, ApJ, 635, 864
- (32) Laor, A., Fiore, F., Elvis, M. et al. 1997, ApJ, 477, 93
- (33) Maccacaro, T., Gioia, I., Wolter, A. et al. 1988, ApJ, 326, 680
- (34) Mainieri, V., Bergeron, J., Hasinger, G., Lehmann, I., Rosati, P., Schmidt, M., Szokoly, G., & Della Ceca, R. 2002, A&A, 393, 425
- (35) Maiolino, R. & Rieke, G.H 1995, ApJ, 454, 95
- (36) Maiolino, R., Salvati, M., Bassani, L. et al. 1998, A&A, 338, 781
- (37) Maiolino, R., Mignoli, M., Pozzetti, L. et al. 2006, A&A, 445, 457
- (38) Malkan, M.A., Gorjian, V., Tam, R. 1998, ApJ, 117, 25
- (39) Martinez-Sansigre, A., Rawlings, S., Lacy, M. et al. 2005, Nature, 436, 666
- (40) Mignoli, M., Pozzetti, L., Comastri, A. et al. 2004, A&A, 418, 827
- (41) Mineo, T., Fiore, F., Laor, A. et al. 2000, A&A, 359, 471
- (42) Moran, E.C., Filippenko, A.V., Chornock, R. 2002, ApJ, 579, L71
- (43) Moretti, A., Campana, S., Lazzati, D., Tagliaferri, G. 2003, ApJ, 588, 696
- (44) Perola, G. C, Puccetti, S., Fiore, F. et al. 2004,A&A, 421, 491
- (45) Puccetti, S., Fiore, F., D’Elia, V. et al. 2006, A&A, 457, 501.
- (46) Oke, J.B. 1990, AJ, 99, 1621
- (47) Severgnini, P., Caccianiga, A., Braito, V. et al. 2003, A&A 406, 483
- (48) Silverman, J.D., Green, P.J., Barkhouse, W.A. et al. 2005, ApJ, 618, 123
- (49) Steffen, A. T., Barger, A. J., Capak, P. et al. 2004, AJ, 128, 1483
- (50) Szokoly, G. P., Bergeron, J., Hasinger, G. et al. 2004, ApJS, 155, 271
- (51) Tozzi, P., Gilli, R., Mainieri, V. et al. 2006, A&A, 451, 457
- (52) Treister, E., Castander, F. J., Maccarone, T. J. et al. 2005, ApJ, 621, 104
- (53) Ueda, Y., Takahashi, T., Ishisaki, Y., & Ohashi, T. 1999, ApJ, 524L, 11
- (54) Worsley, M. A., Fabian, A. C., Barcons, X. et al. 2004, MNRAS, 352, L28
- (55) Zakamska, N. L., Strauss, M. A., Krolik, J. H. et al. 2003, AJ, 126, 2125
| Observation Id | X-ray Position | Optical Position | Offaxis | Prob | F(2-10 keV) | R | Class. | z | log L2-10keV | |
|---|---|---|---|---|---|---|---|---|---|---|
| (J2000) | (J2000) | (arcmin) | (arcsec) | ( cgs) | (erg/s) | |||||
| H2XMMJ140144.9+025332a | 14 01 44.9 +02 53 32 | 14 01 45.0 +02 53 34 | 11.0 | 2.8 | 0.9990 | 5.13 | 18.00 | ETG | 0.2506 | 42.97 |
| 14 01 44.9 +02 53 25 | 6.6 | 0.9171 | – | 20.69 | – | – | – | |||
| H2XMMJ140144.8+024845 | 14 01 44.8 +02 48 45 | 14 01 44.8 +02 48 40 | 11.8 | 4.8 | 1.86 | 24.50 | – | – | – | |
| H2XMMJ140139.6+025722 | 14 01 39.6 +02 57 22 | 14 01 39.5 +02 57 21 | 10.6 | 1.5 | 2.44 | 19.10 | AGN1 | 0.2490 | 42.64 | |
| H2XMMJ140137.1+024604 | 14 01 37.1 +02 46 04 | 14 01 37.3 +02 46 06 | 11.5 | 4.3 | 2.19 | 20.07 | – | – | – | |
| H2XMMJ140132.1+025222 | 14 01 32.1 +02 52 22 | – | 7.9 | – | 1.08 | 23.0 | – | – | – | |
| H2XMMJ140130.8+024532a | 14 01 30.8 +02 45 32 | 14 01 30.6 +02 45 31 | 10.7 | 3.1 | 0.9808 | 4.08 | 20.93 | ELG | 0.7456 | 43.97 |
| 14 01 31.1 +02 45 31 | 4.8 | 0.7087 | – | 23.55 | – | – | – | |||
| H2XMMJ140127.7+025607 | 14 01 27.7 +02 56 07 | 14 01 27.7 +02 56 06 | 7.4 | 0.7 | 57.0 | 19.70 | AGN1 | 0.2645 | 44.07 | |
| H2XMMJ140125.3+024620a | 14 01 25.3 +02 46 20 | 14 01 25.2 +02 46 21 | 9.2 | 1.2 | 0.9970 | 1.29 | 20.99 | AGN2 | 0.4332 | 42.91 |
| 14 01 25.3 +02 46 19 | 1.6 | 0.9493 | – | 23.94 | – | – | – | |||
| H2XMMJ140117.5+024349a | 14 01 17.5 +02 43 49 | 14 01 17.5 +02 43 51 | 10.2 | 2.1 | 0.9979 | 2.70 | 19.60 | AGN1 | 0.3630 | 43.06 |
| 14 01 17.5 +02 43 48 | 1.0 | 0.9866 | – | 23 | – | – | – | |||
| H2XMMJ140115.0+024821 | 14 01 15.0 +02 48 21 | 14 01 15.2 +02 48 19 | 6.0 | 3.4 | 1.66 | 19.75 | AGN1 | 1.5229 | 44.31 | |
| H2XMMJ140109.9+024339a | 14 01 09.9 +02 43 39 | 14 01 09.9 +02 43 39 | 9.7 | 0.2 | 1 | 1.53 | 20.75 | AGN1 | 1.3550 | 44.15 |
| 14 01 09.9 +02 43 37 | 2.4 | 0.9664 | – | ETG | 0.9356 | – | ||||
| H2XMMJ140109.0+025651 | 14 01 09.0 +02 56 51 | 14 01 08.8 +02 56 50 | 4.3 | 3.7 | 2.48 | 22.57 | AGN1 | 1.8330 | 44.67 | |
| H2XMMJ140057.3+023942 | 14 00 57.3 +02 39 42 | 14 00 57.4 +02 39 43 | 13.5 | 1.6 | 3.64 | 19.50 | ETG | 0.2650 | 42.88 | |
| H2XMMJ140053.1+024150 | 14 00 53.1 +02 41 50 | 14 00 53.0 +02 41 51 | 11.4 | 1.3 | 2.07 | 23.61 | – | – | – | |
| H2XMMJ140053.1+030104a | 14 00 53.1 +03 01 04 | 14 00 53.1 +03 01 06 | 8.2 | 1.3 | 0.9985 | 5.02 | 20.18 | AGN1 | 1.3045 | 44.63 |
| 14 00 53.2 +03 01 10 | 5.9 | 0.6339 | – | 22.80 | – | – | – | |||
| H2XMMJ140051.1+025906 | 14 00 51.1 +02 59 06 | 14 00 51.4 +02 59 05 | 6.4 | 4.1 | 2.14 | 18.99 | AGN2 | 0.2564 | 42.61 | |
| H2XMMJ140049.1+025850 | 14 00 49.1 +02 58 50 | 14 00 49.0 +02 58 53 | 6.4 | 3.5 | 1.41 | 21.23 | AGN1b | 1.8222 | 44.42 | |
| H2XMMJ140040.9+025353 | 14 00 40.9 +02 53 53 | 14 00 40.8 +02 53 53 | 5.0 | 1.4 | 1.75 | 24.19 | – | – | – | |
| H2XMMJ140038.7+024322 | 14 00 38.7 +02 43 22 | 14 00 38.6 +02 43 23 | 11.2 | 1.9 | 2.51 | 20.72 | AGN1 | 0.6634 | 43.63 | |
| H2XMMJ140033.3+025810 | 14 00 33.3 +02 58 10 | 14 00 33.4 +02 58 13 | 8.5 | 3.4 | 2.05 | 22.87 | AGN1 | 1.0260 | 44.00 | |
| H2XMMJ140033.0+025740 | 14 00 33.0 +02 57 40 | 14 00 33.3 +02 57 42 | 8.3 | 5.0 | 2.17 | 23.75 | – | – | – | |
| H2XMMJ140019.3+025638 | 14 00 19.3 +02 56 38 | 14 00 19.1 +02 56 40 | 10.9 | 4.0 | 2.33 | 22.52 | AGN1 | 1.1115 | 44.13 | |
| H2XMMJ133807.5+242412 | 13 38 07.5 +24 24 12 | 13 38 07.5 +24 24 11 | 11.3 | 0.7 | 11.9 | 18.30 | AGN1 | 0.6336 | 44.27 | |
| H2XMMJ133712.7+243251 | 13 37 12.7 +24 32 51 | 13 37 12.8 +24 32 54 | 9.9 | 3.6 | 3.89 | 19.60 | – | – | – | |
| H2XMMJ133643.1+242646 | 13 36 43.1 +24 26 46 | – | 8.8 | – | 3.46 | – | – | – | ||
| H2XMMJ133630.2+242625 | 13 36 30.2 +24 26 25 | 13 36 30.0 +24 26 22 | 11.4 | 4.4 | 2.97 | 18.60 | ELG | 0.2551 | 42.75 | |
| H2XMMJ133702.2+242434 | 13 37 02.2 +24 24 34 | 13 37 02.2 +24 24 36 | 3.9 | 1.7 | 1.56 | 21.15 | – | – | – | |
| H2XMMJ133730.6+242306 | 13 37 30.6 +24 23 06 | 13 37 30.8 +24 23 05 | 2.8 | 3.5 | 3.19 | 20.50 | AGN1 | 1.2798 | 44.42 | |
| H2XMMJ133717.9+242148a | 13 37 17.9 +24 21 48 | 13 37 17.9 +24 21 49 | 1.5 | 1.5 | 0.9905 | 1.72 | 22.07 | AGN2 | 0.3431 | 42.81 |
| 13 37 18.0 +24 21 44 | 4.5 | 0.8867 | – | 22.58 | – | – | – | |||
| H2XMMJ133649.4+242004 | 13 36 49.4 +24 20 04 | 13 36 49.3 +24 20 00 | 7.2 | 3.3 | 3.86 | 20.03 | – | – | – | |
| H2XMMJ133714.0+241960 | 13 37 14.0 +24 19 60 | 13 37 14.1 +24 20 01 | 3.2 | 1.7 | 1.61 | 21.16 | AGN1 | 1.5521 | 44.32 | |
| H2XMMJ133637.4+241935 | 13 36 37.4 +24 19 35 | – | 9.9 | – | 2.85 | 24.20 | – | – | – | |
| H2XMMJ133749.2+241942 | 13 37 49.2 +24 19 42 | 13 37 49.5 +24 19 42 | 7.8 | 4.1 | 1.68 | 23.05 | – | – | – | |
| H2XMMJ133724.3+241922 | 13 37 24.3 +24 19 22 | 13 37 24.5 +24 19 23 | 3.9 | 2.8 | 1.48 | 23.29 | – | – | – | |
| H2XMMJ133659.3+241916a | 13 36 59.3 +24 19 16 | 13 36 59.4 +24 19 15 | 5.7 | 1.3 | 0.9953 | 2.30 | 21.75 | ELG | 0.5008 | 43.31 |
| 13 36 59.0 +24 19 11 | 5.6 | 0.9572 | – | 20.7 | – | – | – |
| Id | X-ray Position | Optical Position | Offaxis | Prob | F(2-10 keV) | R | Class. | z | log L2-10keV | |
|---|---|---|---|---|---|---|---|---|---|---|
| (J2000) | (J2000) | (arcmin) | (arcsec) | ( cgs) | (erg/s) | |||||
| H2XMMJ125605.6+220719 | 12 56 05.6 +22 07 19 | 12 56 05.7 +22 07 19 | 13.1 | 1.8 | 4.74 | 20.07 | AGN1 | 1.1450 | 44.47 | |
| H2XMMJ125625.6+220717 | 12 56 25.6 +22 07 17 | 12 56 25.7 +22 07 20 | 9.1 | 3.3 | 2.17 | 20.55 | AGN1 | 1.7310 | 44.56 | |
| H2XMMJ125719.2+220030 | 12 57 19.2 +22 00 30 | 12 57 19.4 +22 00 32 | 5.2 | 3.4 | 1.19 | 21.07 | AGN1 | 1.5060 | 44.15 | |
| H2XMMJ125704.3+220037 | 12 57 04.3 +22 00 37 | 12 57 04.1 +22 00 40 | 2.1 | 4.3 | 0.83 | 23.44 | – | – | – | |
| H2XMMJ125647.4+215946 | 12 56 47.4 +21 59 46 | 12 56 47.2 +21 59 47 | 3.2 | 2.6 | 1.67 | 22.18 | – | – | – | |
| H2XMMJ125602.8+215952 | 12 56 02.8 +21 59 52 | 12 56 02.7 +21 59 52 | 12.8 | 1.4 | 11.1 | 19.10 | – | – | – | |
| H2XMMJ125750.6+215936 | 12 57 50.6 +21 59 36 | 12 57 50.5 +21 59 34 | 12.5 | 2.2 | 2.55 | 18.90 | AGN1 | 0.6150 | 43.56 | |
| H2XMMJ125632.8+215936a | 12 56 32.8 +21 59 36 | 12 56 32.8 +21 59 37 | 6.2 | 1.1 | 0.9989 | 3.07 | 20.10 | AGN1c | 0.5160 | 43.47 |
| 12 56 33.2 +21 59 37 | 5.8 | 0.9341 | – | 21.26 | ELG | 0.2790 | – | |||
| H2XMMJ125709.0+215800 | 12 57 09.0 +21 58 00 | 12 57 08.9 +21 57 57 | 4.8 | 3.1 | 0.67 | 20.79 | AGN1 | 0.9112 | 43.39 | |
| H2XMMJ125629.4+215704 | 12 56 29.4 +21 57 04 | 12 56 29.3 +21 57 06 | 8.1 | 2.3 | 1.27 | 22.41 | AGN1d | 0.6346 | 43.30 | |
| H2XMMJ125732.6+215708 | 12 57 32.6 +21 57 08 | 12 57 32.7 +21 57 08 | 9.5 | 0.9 | 1.39 | 19.40 | – | – | – | |
| H2XMMJ125638.9+215625 | 12 56 38.9 +21 56 25 | 12 56 38.9 +21 56 26 | 7.0 | 1.0 | 1.01 | 22.64 | ELG | 0.4703 | 42.89 | |
| H2XMMJ125712.2+215523 | 12 57 12.2 +21 55 23 | 12 57 12.1 +21 55 22 | 7.4 | 1.6 | 1.14 | 20.78 | AGN1 | 0.8000 | 43.49 | |
| H2XMMJ125637.3+215439 | 12 56 37.3 +21 54 39 | 12 56 37.0 +21 54 36 | 8.7 | 5.2 | 1.08 | 23.71 | – | – | – | |
| H2XMMJ125650.6+215458a | 12 56 50.6 +21 54 58 | 12 56 50.6 +21 54 59 | 7.2 | 0.7 | 0.9996 | 2.65 | 20.00 | AGN1 | 0.6450 | 43.63 |
| 12 56 50.9 +21 54 57 | 4.7 | 0.7478 | – | 22.81 | – | – | – | |||
| H2XMMJ125706.3+215506a | 12 57 06.3 +21 55 06 | 12 57 06.2 +21 55 06 | 7.2 | 1.4 | 0.9737 | 0.99 | 22.85 | AGN1 | 1.8750 | 44.30 |
| 12 57 06.1 +21 55 04 | 3.5 | 0.9292 | – | 22.77 | – | – | – | |||
| H2XMMJ125715.9+215432 | 12 57 15.9 +21 54 32 | 12 57 15.7 +21 54 31 | 8.5 | 2.6 | 1.82 | 19.32 | AGN1 | 0.4011 | 42.99 | |
| H2XMMJ125712.2+215358 | 12 57 12.2 +21 53 58 | 12 57 12.3 +21 53 59 | 8.7 | 1.8 | 1.66 | 20.71 | ELG | 0.6854 | 43.49 | |
| H2XMMJ125640.3+215351 | 12 56 40.3 +21 53 51 | 12 56 40.4 +21 53 51 | 9.0 | 1.5 | 1.17 | 22.53 | – | – | – | |
| H2XMMJ125628.1+215405 | 12 56 28.1 +21 54 05 | 12 56 27.9 +21 54 06 | 10.4 | 2.6 | 5.58 | 19.69 | AGN1 | 1.8670 | 45.04 | |
| H2XMMJ125710.6+215353 | 12 57 10.6 +21 53 53 | 12 57 10.2 +21 53 53 | 8.6 | 5.7 | 2.06 | 19.92 | AGN1 | 0.7977 | 43.74 | |
| H2XMMJ125650.3+215329 | 12 56 50.3 +21 53 29 | 12 56 50.5 +21 53 30 | 8.6 | 3.3 | 1.25 | 18.69 | ETGe | 0.3991 | 42.82 | |
| H2XMMJ125659.0+215347b | 12 56 59.0 +21 53 47 | 12 56 58.8 +21 53 46 | 8.2 | 3.5 | 6.06 | 17.42 | AGN2 | 0.1871 | 42.77 | |
| H2XMMJ125654.1+215318 | 12 56 54.1 +21 53 18 | 12 56 54.1 +21 53 17 | 8.7 | 1.0 | 2.44 | 20.76 | AGN2 | 0.9093 | 43.95 | |
| H2XMMJ125653.7+215125a | 12 56 53.7 +21 51 25 | 12 56 53.6 +21 51 26 | 10.6 | 2.1 | 0.9936 | 5.17 | 20.47 | AGN1f | 0.8940 | 44.26 |
| 12 56 53.4 +21 51 24 | 4.7 | 0.8972 | – | 22.34 | AGN2 | 0.9127 | – | |||
| H2XMMJ125633.1+215147a | 12 56 33.1 +21 51 47 | 12 56 32.9 +21 51 52 | 11.6 | 4.9 | 0.9882 | 2.95 | 19.60 | AGN1c | 0.8950 | 44.01 |
| 12 56 33.0 +21 51 49 | 2.5 | 0.9856 | – | 21.36 | ETG | 0.7533 | – | |||
| H2XMMJ110522.5+381103 | 11 05 22.5 +38 11 03 | 11 05 22.6 +38 11 05 | 11.8 | 2.1 | 2.19 | 19.96 | AGN1 | 1.2585 | 44.23 | |
| H2XMMJ110522.0+381401 | 11 05 22.0 +38 14 01 | 11 05 22.0 +38 14 02 | 12.1 | 1.1 | 5.86 | 11.30 | AGN2 | 0.0276 | 41.05 | |
| H2XMMJ110517.9+381051 | 11 05 17.9 +38 10 51 | 11 05 17.8 +38 10 51 | 10.9 | 1.7 | 2.24 | 22.17 | – | – | – | |
| H2XMMJ110512.3+382129 | 11 05 12.3 +38 21 29 | 11 05 12.8 +38 21 29 | 14.4 | 5.8 | 4.28 | 19.70 | – | – | – | |
| H2XMMJ110509.7+381253 | 11 05 09.7 +38 12 53 | 11 05 09.6 +38 12 55 | 9.5 | 2.7 | 1.39 | 23.41 | – | – | – | |
| H2XMMJ110449.2+381810 | 11 04 49.2 +38 18 10 | 11 04 49.2 +38 18 11 | 9.1 | 1.7 | 2.06 | 18.30 | AGN1 | 1.9451 | 44.65 | |
| H2XMMJ110447.6+380407 | 11 04 47.6 +38 04 07 | 11 04 47.6 +38 04 07 | 8.3 | 0.6 | 1.59 | 21.30 | AGN1 | 2.2670 | 44.69 | |
| H2XMMJ110444.2+381449 | 11 04 44.2 +38 14 49 | 11 04 43.9 +38 14 48 | 5.9 | 4.3 | 3.29 | 7.60 | * | 0.0000 | 40.00 | |
| H2XMMJ110438.2+382500 | 11 04 38.2 +38 25 00 | 11 04 38.1 +38 25 01 | 14.6 | 2.0 | 1.63 | 22.45 | – | – | – | |
| H2XMMJ110437.8+382304 | 11 04 37.8 +38 23 04 | 11 04 37.6 +38 23 02 | 12.6 | 2.1 | 1.57 | 22.06 | – | – | – | |
| H2XMMJ110435.2+382139 | 11 04 35.2 +38 21 39 | – | 11.2 | – | 1.26 | 23.30 | – | – | – | |
| H2XMMJ110431.5+380305 | 11 04 31.5 +38 03 05 | – | 7.9 | – | 1.26 | 23.50 | – | – | – | |
| H2XMMJ110424.9+380024 | 11 04 24.9 +38 00 24 | – | 10.4 | – | 1.54 | 23.50 | – | – | – |
| Id | X-ray Position | Optical Position | Offaxis | Prob | F(2-10 keV) | R | Class. | z | log L2-10keV | |
|---|---|---|---|---|---|---|---|---|---|---|
| (J2000) | (J2000) | (arcmin) | (arcsec) | ( cgs) | (erg/s) | |||||
| H2XMMJ110420.8+380443 | 11 04 20.8 +38 04 43 | 11 04 20.9 +38 04 37 | 6.0 | 6.1 | 1.28 | 23.34 | – | – | – | |
| H2XMMJ110418.2+382047 | 11 04 18.2 +38 20 47 | 11 04 18.3 +38 20 47 | 10.1 | 0.6 | 2.66 | 22.10 | AGN1 | 2.0487 | 44.82 | |
| H2XMMJ110416.2+380241 | 11 04 16.2 +38 02 41 | 11 04 16.0 +38 02 36 | 8.2 | 5.6 | 2.08 | 20.52 | – | – | – | |
| H2XMMJ110414.7+380714 | 11 04 14.7 +38 07 14 | 11 04 14.8 +38 07 15 | 3.8 | 0.9 | 5.70 | 22.75 | – | – | – | |
| H2XMMJ110413.2+382203 | 11 04 13.2 +38 22 03 | 11 04 13.3 +38 22 07 | 11.4 | 4.6 | 1.15 | 21.00 | – | – | – | |
| H2XMMJ110402.8+375950 | 11 04 02.8 +37 59 50 | 11 04 03.0 +37 59 50 | 11.6 | 2.2 | 3.75 | 20.52 | AGN1 | 0.2864 | 42.97 | |
| H2XMMJ110345.8+380546 | 11 03 45.8 +38 05 46 | 11 03 46.3 +38 05 49 | 8.8 | 6.0 | 2.46 | 22.20 | – | – | – | |
| H2XMMJ110343.6+381349 | 11 03 43.6 +38 13 49 | 11 03 43.6 +38 13 49 | 8.2 | 0.5 | 2.80 | 22.85 | – | – | – | |
| H2XMMJ110339.9+380014 | 11 03 39.9 +38 00 14 | 11 03 40.0 +38 00 11 | 13.5 | 3.5 | 3.42 | 19.50 | AGN2 | 0.3078 | 43.00 | |
| H2XMMJ110330.2+381607 | 11 03 30.2 +38 16 07 | 11 03 30.1 +38 16 06 | 11.6 | 1.7 | 1.35 | 22.75 | – | – | – | |
| H2XMMJ110325.8+381212 | 11 03 25.8 +38 12 12 | 11 03 25.9 +38 12 11 | 11.3 | 1.4 | 5.68 | 14.40 | AGN2 | 0.0696 | 41.82 | |
| H2XMMJ110322.6+380945 | 11 03 22.6 +38 09 45 | 11 03 22.8 +38 09 45 | 11.8 | 1.6 | 2.46 | 21.85 | – | – | – | |
| H2XMMJ110318.6+381545 | 11 03 18.6 +38 15 45 | 11 03 18.4 +38 15 44 | 13.5 | 2.6 | 6.87 | 18.98 | AGN1 | 0.3140 | 43.32 | |
| H2XMMJ110317.1+381336 | 11 03 17.1 +38 13 36 | 11 03 17.4 +38 13 38 | 13.2 | 4.0 | 3.66 | 19.51 | AGN1 | 1.2506 | 44.45 | |
| H2XMMJ005019.4515532 | 00 50 19.4 51 55 32 | 00 50 19.5 51 55 30 | 14.5 | 1.6 | 2.50 | 21.60 | – | – | – | |
| H2XMMJ005026.3515929 | 00 50 26.3 51 59 29 | 00 50 26.3 51 59 30 | 11.3 | 1.3 | 1.89 | 22.30 | – | – | – | |
| H2XMMJ005009.4515933 | 00 50 09.4 51 59 33 | 00 50 09.7 51 59 32 | 10.2 | 2.8 | 4.38 | 20.05 | – | – | – | |
| H2XMMJ005030.6520011 | 00 50 30.6 52 00 11 | 00 50 30.8 52 00 10 | 11.0 | 1.9 | 13.5 | 18.78 | AGN1 | 0.4630 | 44.00 | |
| H2XMMJ005030.7520046g | 00 50 30.7 52 00 46 | 00 50 30.9 52 00 48 | 10.5 | 2.4 | 2.62 | 24.08 | AGN2 | 1.3553h | 44.39 | |
| H2XMMJ005043.4520116 | 00 50 43.4 52 01 16 | 00 50 43.7 52 01 17 | 11.4 | 3.1 | 2.02 | 21.18 | – | – | – | |
| H2XMMJ005126.5520220 | 00 51 26.5 52 02 20 | 00 51 26.2 52 02 21 | 16.3 | 3.0 | 4.02 | 20.20 | – | – | – | |
| H2XMMJ005008.4520350 | 00 50 08.4 52 03 50 | – | 6.1 | – | 0.96 | 22.50 | – | – | – | |
| H2XMMJ004953.1520525 | 00 49 53.1 52 05 25 | 00 49 52.9 52 05 24 | 3.9 | 1.9 | 0.95 | 21.65 | – | – | – | |
| H2XMMJ005031.6520630g | 00 50 31.6 52 06 30 | 00 50 31.5 52 06 34 | 6.9 | 4.1 | 1.63 | 24.04 | – | – | ||
| H2XMMJ005017.1520715 | 00 50 17.1 52 07 15 | 00 50 17.4 52 07 18 | 4.6 | 4.5 | 0.71 | 23.40 | – | – | – | |
| H2XMMJ005044.7520735 | 00 50 44.7 52 07 35 | 00 50 44.7 52 07 36 | 8.5 | 0.9 | 1.02 | 19.84 | – | – | – | |
| H2XMMJ005012.3520834 | 00 50 12.3 52 08 34 | 00 50 12.3 52 08 36 | 3.4 | 2.2 | 0.61 | 22.28 | – | – | – | |
| H2XMMJ004959.0521112 | 00 49 59.0 52 11 12 | 00 49 59.0 52 11 10 | 2.3 | 1.4 | 1.05 | 21.26 | – | – | – | |
| H2XMMJ004955.7521231 | 00 49 55.7 52 12 31 | – | 3.3 | – | 0.76 | 22.50 | – | – | – | |
| H2XMMJ004947.6521249 | 00 49 47.6 52 12 49 | 00 49 47.8 52 12 48 | 3.5 | 1.9 | 2.66 | 21.04 | AGN1 | 1.1046 | 44.19 | |
| H2XMMJ004936.7521306a | 00 49 36.7 52 13 06 | 00 49 36.7 52 13 07 | 4.3 | 0.3 | 0.9999 | 0.96 | 20.31 | AGN1 | 0.9290 | 43.57 |
| 00 49 37.2 52 13 07 | 4.6 | 0.9421 | – | 21.56 | – | – | – | |||
| H2XMMJ004950.9521410 | 00 49 50.9 52 14 10 | 00 49 51.1 52 14 13 | 4.8 | 2.9 | 2.22 | 22.30 | – | – | – | |
| H2XMMJ004959.4521412 | 00 49 59.4 52 14 12 | 00 49 59.2 52 14 11 | 5.1 | 1.9 | 1.40 | 21.70 | – | – | – | |
| H2XMMJ004935.2521458 | 00 49 35.2 52 14 58 | 00 49 35.9 52 14 56 | 6.1 | 6.7 | 1.11 | 20.42 | – | – | – | |
| H2XMMJ005007.4521508a | 00 50 07.4 52 15 08 | 00 50 07.4 52 15 08 | 6.3 | 0.6 | 0.9998 | 1.41 | 19.43 | AGN1b | 2.4220 | 44.71 |
| 00 50 07.7 52 15 06 | 3.3 | 0.9563 | – | 22.68 | – | – | – | |||
| H2XMMJ005032.1521543 | 00 50 32.1 52 15 43 | 00 50 32.2 52 15 43 | 9.0 | 0.5 | 6.41 | 19.77 | AGN1 | 1.2224 | 44.67 |
Classification: AGN1; AGN2; ELG=Emission-Line Galaxy; ETG=Early-Type Galaxy; *=Star; a Two possible counterparts within ; b Broad absorption line QSO; c Two nearby objects, a type 1 AGN and an emission-line galaxy; d Tentative classification: low spectrum; e Extended, emission from a group or cluster of galaxies; f Two nearby objects, a type 1 AGN and a type 2 AGN; g Aperture photometry at the position of a bright K source and photometric z (Mignoli et al. 2004); h Near-infrared spectroscopy (Maiolino et al. 2006).
| Observation Id | z | Class. | logL2-10keV | LogF([OIII]) | LogL([OIII]) |
| (erg/s) | (cgs) | (erg/s) | |||
| H2XMMJ054034.2283108 | 0.3794 | AGN2 | 43.44 | -15.44a | 41.12a |
| H2XMMJ054024.7284616 | 0.4844 | AGN2 | 43.02 | -16.35 | 40.43 |
| H2XMMJ053959.0283753 | 0.8420 | AGN1 | 43.93 | -14.96 | 42.31 |
| H2XMMJ053929.5284860 | 0.3171 | AGN1 | 43.55 | -15.32 | 41.08 |
| H2XMMJ053910.7283528 | 0.7700 | AGN1 | 43.95 | -14.64 | 42.55 |
| H2XMMJ053850.9283757 | 0.7630 | AGN1 | 44.2 | -14.82 | 42.36 |
| H2XMMJ031416.4764536 | 0.2456 | AGN1 | 42.74 | -15.3 | 40.87 |
| H2XMMJ031200.4770026 | 0.8410 | AGN2 | 43.79 | -16.59 | 40.68 |
| H2XMMJ031136.0765556 | 0.7090 | ELG | 43.49 | -16.46 | 40.66 |
| H2XMMJ031112.8764706 | 0.7530 | AGN1 | 43.72 | -16.27 | 40.9 |
| H2XMMJ031050.0763904 | 0.3812 | AGN1 | 44.12 | -15.46a | 41.1a |
| H2XMMJ031037.4764713 | 0.6410 | ELG | 43.43 | -15.57 | 41.46 |
| H2XMMJ030951.2765825 | 0.2060 | ELG | 42.66 | -15.87 | 40.14 |
| H2XMMJ030912.1765826 | 0.2651 | AGN2 | 43.3 | -15.03 | 41.2 |
| H2XMMJ235933.4250758 | 0.7380 | AGN1 | 43.88 | -15.63 | 41.52 |
| H2XMMJ000102.4245847 | 0.4331 | AGN1 | 43.85 | -16.22 | 40.46 |
| H2XMMJ000100.2250459 | 0.8504 | AGN1 | 44.66 | -15.04 | 42.24 |
| H2XMMJ000036.6250105 | 0.5917 | AGN2 | 43.64 | -15.85 | 41.11 |
| H2XMMJ000031.7245459 | 0.2839 | AGN1 | 43.35 | -14.83 | 41.47 |
| H2XMMJ000027.7250441 | 0.3362 | AGN1 | 43.43 | -14.78 | 41.67 |
| H2XMMJ000026.0250648 | 0.4331 | AGN1 | 43.03 | -15.8 | 40.88 |
| H2XMMJ003418.5120809 | 0.2327 | AGN2 | 43.04 | -15.24 | 40.88 |
| H2XMMJ204446.4103839 | 0.6941 | AGN2 | 43.84 | -14.77 | 42.33 |
| H2XMMJ204349.2103746 | 0.5556 | AGN1 | 43.82 | -14.88 | 42.02 |
| H2XMMJ140139.6+025722 | 0.2490 | AGN1 | 42.64 | -15.11 | 41.07 |
| H2XMMJ140130.8+024532 | 0.7456 | ELG | 43.97 | -15.74 | 41.42 |
| H2XMMJ140125.3+024620 | 0.4332 | AGN2 | 42.91 | -14.36 | 42.32 |
| H2XMMJ140117.5+024349 | 0.3630 | AGN1 | 43.06 | -15.2a | 41.32a |
| H2XMMJ140051.1+025906 | 0.2564 | AGN2 | 42.61 | -14.53 | 41.67 |
| H2XMMJ140038.7+024322 | 0.6634 | AGN1 | 43.63 | -15.78 | 41.28 |
| H2XMMJ133630.2+242625 | 0.2551 | ELG | 42.75 | -15.15 | 41.05 |
| H2XMMJ133717.9+242148 | 0.3431 | AGN2 | 42.81 | -16.12 | 40.34 |
| H2XMMJ133659.3+241916 | 0.5008 | ELG | 43.31 | -15.89 | 40.92 |
| H2XMMJ125632.8+215936 | 0.5160 | AGN1 | 43.47 | -15.78b | 41.06b |
| H2XMMJ125709.0+215800 | 0.9112 | AGN1 | 43.39 | -16.04 | 41.3 |
| H2XMMJ125629.4+215704 | 0.6346 | AGN1 | 43.30 | -16.51 | 40.51 |
| H2XMMJ125638.9+215625 | 0.4703 | ELG | 42.89 | -16.68 | 40.07 |
| H2XMMJ125712.2+215523 | 0.8000 | AGN1 | 43.49 | -16.39 | 40.84 |
| H2XMMJ125715.9+215432 | 0.4011 | AGN1 | 42.99 | -15.64 | 40.97 |
| H2XMMJ125712.2+215358 | 0.6854 | ELG | 43.49 | -16.59 | 40.5 |
| H2XMMJ125710.6+215353 | 0.7977 | AGN1 | 43.74 | -15.88 | 41.34 |
| H2XMMJ125659.0+215347 | 0.1871 | AGN2 | 42.77 | -14.56 | 41.37 |
| H2XMMJ125654.1+215318 | 0.9093 | AGN2 | 43.95 | -15.59 | 41.75 |
| H2XMMJ110522.0+381401 | 0.0276 | ELG | 41.05 | -14.36 | 39.92 |
| H2XMMJ110402.8+375950 | 0.2864 | AGN1 | 42.97 | -15.21 | 41.09 |
| H2XMMJ110339.9+380014 | 0.3078 | AGN2 | 43.00 | -15.02 | 41.35 |
| H2XMMJ110325.8+381212 | 0.0696 | AGN2 | 41.82 | -14.68 | 40.36 |
| H2XMMJ110318.6+381545 | 0.3140 | AGN1 | 43.32 | -14.81 | 41.58 |
| H2XMMJ005030.6520011 | 0.4630 | AGN1 | 44.00 | -14.71 | 42.02 |
| H2XMMJ053925.8284456 | 0.0750 | ETG | 41.82 | ||
| H2XMMJ031239.3765133 | 0.1590 | ETG | 42.24 | ||
| H2XMMJ031231.2764324 | 0.0520 | ETGc | 41.08 | ||
| H2XMMJ031124.8770139 | 0.3199 | ETG | 42.93 | ||
| H2XMMJ030952.2764927 | 0.2049 | ETG | 42.22 | ||
| H2XMMJ000030.1251214 | 0.1543 | ETGc | 42.07 | ||
| H2XMMJ204420.5104904 | 0.3240 | ETG | 43.16 | ||
| H2XMMJ140144.9+025332 | 0.2506 | ETG | 42.97 | ||
| H2XMMJ140057.3+023942 | 0.2650 | ETG | 43.02 | ||
| H2XMMJ125650.3+215329 | 0.3991 | ETGc | 42.82 |
a [OIII] lines within strong telluric absorption feature at 6900Å ;
b [OIII] lines within strong
telluric absorption feature at 7600Å ;
c Extended, emission from a group or cluster of galaxies;
indicates upper limits.
| IAU name | Id | IAU name | Id | IAU name | Id |
|---|---|---|---|---|---|
| H2XMMJ053925.8284456 | 05370024a | H2XMMJ133714.0241960 | 13390131 | H2XMMJ005030.6520011 | 16274066 |
| H2XMMJ054034.2283108 | 05370008a | H2XMMJ133637.4241935 | 13390133 | H2XMMJ005030.7520046 | 16274069 |
| H2XMMJ054024.7284616 | 05370135a | H2XMMJ133749.2241942 | 13390134 | H2XMMJ005043.4520116 | 16274078 |
| H2XMMJ053959.0283753 | 05370007a | H2XMMJ133724.3241922 | 13390137 | H2XMMJ005126.5520220 | 16274097 |
| H2XMMJ053929.5284860 | 05370003a | H2XMMJ133659.3241916 | 13390140 | H2XMMJ005008.4520350 | 16274117 |
| H2XMMJ053910.7283528 | 05370009a | H2XMMJ125605.6220719 | 15300065 | H2XMMJ004953.1520525 | 16274158 |
| H2XMMJ053850.9283757 | 05370020a | H2XMMJ125625.6220717 | 15300067 | H2XMMJ005031.6520630 | 16274181 |
| H2XMMJ031239.3765133 | 03120018a | H2XMMJ125719.2220030 | 15300142 | H2XMMJ005017.1520715 | 16274197 |
| H2XMMJ031231.2764324 | 03120008a | H2XMMJ125704.3220037 | 15300143 | H2XMMJ005044.7520735 | 16274212 |
| H2XMMJ031124.8770139 | 03120017a | H2XMMJ125647.4215946 | 15300148 | H2XMMJ005012.3520834 | 16274235 |
| H2XMMJ030952.2764927 | 03120501a | H2XMMJ125602.8215952 | 15300151 | H2XMMJ004959.0521112 | 16274292 |
| H2XMMJ031416.4764536 | 03120010a | H2XMMJ125750.6215936 | 15300152 | H2XMMJ004955.7521231 | 16274307 |
| H2XMMJ031200.4770026 | 03120016a | H2XMMJ125632.8215936 | 15300153 | H2XMMJ004947.6521249 | 16274314 |
| H2XMMJ031136.0765556 | 03120181a | H2XMMJ125709.0215800 | 15300176 | H2XMMJ004936.7521306 | 16274320 |
| H2XMMJ031112.8764706 | 03120011a | H2XMMJ125629.4215704 | 15300186 | H2XMMJ004950.9521410 | 16274339 |
| H2XMMJ031050.0763904 | 03120007a | H2XMMJ125732.6215708 | 15300189 | H2XMMJ004959.4521412 | 16274340 |
| H2XMMJ031037.4764713 | 03120028a | H2XMMJ125638.9215625 | 15300193 | H2XMMJ004935.2521458 | 16274349 |
| H2XMMJ030951.2765825 | 03120014a | H2XMMJ125712.2215523 | 15300203 | H2XMMJ005007.4521508 | 16274351 |
| H2XMMJ030912.1765826 | 03120034a | H2XMMJ125637.3215439 | 15300207 | H2XMMJ005032.1521543 | 16274363 |
| H2XMMJ000030.1251214 | 26900013a | H2XMMJ125650.6215458 | 15300208 | ||
| H2XMMJ235933.4250758 | 26900028a | H2XMMJ125706.3215506 | 15300209 | ||
| H2XMMJ000102.4245847 | 26900003a | H2XMMJ125715.9215432 | 15300216 | ||
| H2XMMJ000100.2250459 | 26900002a | H2XMMJ125712.2215358 | 15300219 | ||
| H2XMMJ000036.6250105 | 26900022a | H2XMMJ125640.3215351 | 15300222 | ||
| H2XMMJ000031.7245459 | 26900004a | H2XMMJ125628.1215405 | 15300225 | ||
| H2XMMJ000027.7250441 | 26900001a | H2XMMJ125710.6215353 | 15300226 | ||
| H2XMMJ000026.0250648 | 26900012a | H2XMMJ125650.3215329 | 15300230 | ||
| H2XMMJ003418.5120809 | 15800012a | H2XMMJ125659.0215347 | 15300231 | ||
| H2XMMJ204420.5104904 | 50900061a | H2XMMJ125654.1215318 | 15300236 | ||
| H2XMMJ204446.4103839 | 50900036a | H2XMMJ125653.7215125 | 15300240 | ||
| H2XMMJ204349.2103746 | 50900031a | H2XMMJ125633.1215147 | 15300253 | ||
| H2XMMJ140144.9025332 | 18350140 | H2XMMJ110522.5381103 | 42100102 | ||
| H2XMMJ140144.8024845 | 18350227 | H2XMMJ110522.0381401 | 42100058 | ||
| H2XMMJ140139.6025722 | 18350069 | H2XMMJ110517.9381051 | 42100106 | ||
| H2XMMJ140137.1024604 | 18350258 | H2XMMJ110512.3382129 | 42100269 | ||
| H2XMMJ140132.1025222 | 18350155 | H2XMMJ110509.7381253 | 42100073 | ||
| H2XMMJ140130.8024532 | 18350262 | H2XMMJ110449.2381810 | 42100302 | ||
| H2XMMJ140127.7025607 | 18350095 | H2XMMJ110447.6380407 | 42100197 | ||
| H2XMMJ140125.3024620 | 18350256 | H2XMMJ110444.2381449 | 42100039 | ||
| H2XMMJ140117.5024349 | 18350279 | H2XMMJ110438.2382500 | 42100243 | ||
| H2XMMJ140115.0024821 | 18350240 | H2XMMJ110437.8382304 | 42100258 | ||
| H2XMMJ140109.9024339 | 18350281 | H2XMMJ110435.2382139 | 42100266 | ||
| H2XMMJ140109.0025651 | 18350084 | H2XMMJ110431.5380305 | 42100207 | ||
| H2XMMJ140057.3023942 | 18350033 | H2XMMJ110424.9380024 | 42100229 | ||
| H2XMMJ140053.1024150 | 18350232 | H2XMMJ110420.8380443 | 42100189 | ||
| H2XMMJ140053.1030104 | 18350034 | H2XMMJ110418.2382047 | 42100272 | ||
| H2XMMJ140051.1025906 | 18350048 | H2XMMJ110416.2380241 | 42100212 | ||
| H2XMMJ140049.1025850 | 18350052 | H2XMMJ110414.7380714 | 42100148 | ||
| H2XMMJ140040.9025353 | 18350135 | H2XMMJ110413.2382203 | 42100264 | ||
| H2XMMJ140038.7024322 | 18350283 | H2XMMJ110402.8375950 | 42100237 | ||
| H2XMMJ140033.3025810 | 18350057 | H2XMMJ110345.8380546 | 42100170 | ||
| H2XMMJ140033.0025740 | 18350061 | H2XMMJ110343.6381349 | 42100055 | ||
| H2XMMJ140019.3025638 | 18350080 | H2XMMJ110339.9380014 | 42100231 | ||
| H2XMMJ133807.5242412 | 13390094 | H2XMMJ110330.2381607 | 42100011 | ||
| H2XMMJ133712.7243251 | 13390015 | H2XMMJ110325.8381212 | 42100088 | ||
| H2XMMJ133643.1242646 | 13390060 | H2XMMJ110322.6380945 | 42100116 | ||
| H2XMMJ133630.2242625 | 13390064 | H2XMMJ110318.6381545 | 42100025 | ||
| H2XMMJ133702.2242434 | 13390085 | H2XMMJ110317.1381336 | 42100066 | ||
| H2XMMJ133730.6242306 | 13390103 | H2XMMJ005019.4515532 | 16274019 | ||
| H2XMMJ133717.9242148 | 13390112 | H2XMMJ005026.3515929 | 16274055 | ||
| H2XMMJ133649.4242004 | 13390129 | H2XMMJ005009.4515933 | 16274057 |
To help the comparison with previous HELLAS2XMM publications, we report the IAU names for the HELLAS2XMM
source sample and the previously published ones.
a Sources belonging to the HELLAS2XMM 1dF sample.