Radio sources in the 6dFGS: Local luminosity functions at 1.4 GHz for star-forming galaxies and radio-loud AGN.
Abstract
We have identified 7824 radio sources from the 1.4 GHz NRAO VLA Sky Survey (NVSS) with galaxies brighter than mag. in the Second Incremental Data Release of the 6dF Galaxy Survey (6dFGS DR2). The resulting sample of redshifts and optical spectra for radio sources over an effective sky area of 7076 deg2 (about 17 per cent of the celestial sphere) is the largest of its kind ever obtained. NVSS radio sources associated with galaxies in the 6dFGS span a redshift range and have median . Through visual examination of 6dF spectra we have identified the dominant mechanism for radio emission from each galaxy. 60 per cent are fuelled by star-formation and 40 per cent are fuelled by an active galactic nucleus powered by a supermassive black hole. We have accurately determined the local radio luminosity function at 1.4 GHz for both classes of radio source and have found it to agree well with other recent determinations. From the radio luminosity function of star-forming galaxies we derive a local star formation density of M⊙ yr-1 Mpc-3, in broad agreement with recent determinations at radio and other wavelengths.
We have split the radio luminosity function of radio-loud AGN into bins of absolute -band magnitude () and compared this with the underlying -band galaxy luminosity function of all 6dFGS galaxies to determine the bivariate radio--band luminosity function. We verify that radio-loud AGN preferentially inhabit the brightest and hence most massive host galaxies and show that the fraction of all galaxies which host a radio-loud AGN scales as for , indicative of a similarly strong scaling with black hole mass and stellar mass.
keywords:
surveys – galaxies: active – galaxies: luminosity function, mass function – galaxies: starburst – radio continuum: galaxies1 Introduction
In recent years a new generation of radio surveys has been released covering a large fraction of the celestial sphere down to flux density levels of a few mJy (eg. NRAO VLA Sky Survey (NVSS), Condon et al. (1998); Sydney University Molonglo Sky Survey (SUMSS), Bock et al. (1999) & Mauch et al. (2003); Faint Images of the Radio Sky at Twenty-cm (FIRST), Becker et al. (1995); Westerbork Northern Sky Survey (WENSS), Rengelink (1998)). The vast majority of the radio sources in these surveys are produced by Active Galactic Nuclei (AGN) powered by supermassive black holes in galaxies with a median redshift of (Condon et al., 1998). These dominate the radio source population above flux densities of 10 mJy. Below 10 mJy the surveys contain an increasing fraction of nearby () galaxies whose radio emission is fuelled by ongoing star formation (Condon, 1989). Because radio surveys probe a wide range of redshifts, studying their global properties statistically (eg. through radio source counts or luminosity functions) provides a powerful constraint on the evolutionary properties of massive galaxies throughout the history of the universe. Unfortunately, radio survey data alone are not sufficient to constrain the current models of radio source counts. These models are strongly dependent on the form of the local radio luminosity function (RLF) from which the measured source counts can be extrapolated via evolutionary models (eg. Dunlop & Peacock, 1990; Jackson & Wall, 1999) or compared directly to the measured radio luminosity function of samples selected at higher redshift (eg. Brown et al., 2001; Sadler et al., 2006). The current generation of redshift surveys (eg. Sloan Digital Sky Survey (SDSS), York et al. (2000); 2 degree Field Galaxy Redshift Survey (2dFGRS), Colless et al. (2001); 6 degree Field Galaxy Survey (6dFGS), Jones et al. (2004)) provide a useful tool for calculating the local radio luminosity function, as they provide redshifts for thousands of radio sources in the local universe. The host galaxy spectra provide additional value in this context as they can be used to determine the physical cause of the radio emission from galaxies, thereby disentangling the star-forming galaxy population from the radio-loud AGN.
Table 1 compares the underlying radio-optical samples used in recent measurements of the local radio luminosity function. Sadler et al. (2002) identified NVSS radio sources in the 2dFGRS and derived the local radio luminosity function of both star-forming galaxies and radio-loud AGN; this will hereafter be referred to as the 2dFGRS-NVSS sample. Magliocchetti et al. (2002) identified optical counterparts to FIRST galaxies in the 2dFGRS; this will hereafter be referred to as the 2dFGRS-FIRST sample. Both the radio-selected 2dFGRS samples cover a relatively small area of sky to redshifts of and predominantly comprise radio-loud AGN. In particular the 2dFGRS-FIRST sample detected relatively few star-forming galaxies as the high-resolution FIRST survey resolves out much of the extended radio emission in the disks of nearby galaxies. Best et al. (2005b) identified NVSS and FIRST radio sources in the second data release of the SDSS; this will hereafter be referred to as the SDSS-NVSS/FIRST sample. They optimised their radio-source selection via a hybrid method which used both the resolution of the FIRST survey and the surface brightness sensitivity of the NVSS survey. However, they detected relatively few star-forming galaxies above their adopted flux density limit of 5 mJy. Condon et al. (2002) crossmatched the NVSS catalogue with galaxies brighter than mag. in the Uppsala Galaxy Catalogue (UGC; Nilson, 1973) and constructed a a sample of 1966 radio sources in the local universe across 4.33 sr of the northern sky; this will hereafter be referred to as the UGC-NVSS sample. The wide yet shallow UGC-NVSS sample contained a large population of star-forming galaxies but relatively few radio-loud AGN. Larger numbers of radio-loud AGN are found at higher redshifts.
This paper presents the local radio luminosity function derived from a well-defined subsample of the 7824 radio sources from the NVSS catalogue identified with galaxies observed in the Second Incremental Data Release (DR2) of the 6dFGS; this will be referred to as the 6dFGS-NVSS sample. Galaxies in the 6dFGS-NVSS sample presented in this paper lie at redshifts intermediate between the more distant 2dFGRS-NVSS and SDSS-NVSS/FIRST samples and the nearby UGC-NVSS sample, in an effective sky area much larger than that of the 2dFGRS and SDSS derived samples. 6dFGS-NVSS galaxies are contained in a larger volume of space than any previous local radio source sample, with significant populations of both radio-loud AGN and star-forming galaxies all contained in the one survey.
| UGC-NVSS | 6dFGS-NVSS | 2dFGRS-NVSS | 2dFGRS-FIRST | SDSS-NVSS/FIRST | ||
| Condon et al. (2002) | This paper | Sadler et al. (2002) | Magliocchetti et al. (2002) | Best et al. (2005b) | ||
| Star-forming galaxies | ||||||
| No. Galaxies | 1672 | 4006 | 242 | 177 | 497 | |
| Mag. limit | ||||||
| (mJy) | 2.5 | 2.8 | 2.8 | 1.0 | 5.0 | |
| Area(Sr.)a | 4.33 | 2.16 | 0.10 | 0.07 | ||
| rangeb | ||||||
| median | 0.012 | 0.035 | 0.043 | 0.100 | 0.055 | |
| Volume (Mpc3)c | 7 | 53 | 8 | 22 | ||
| (Gyr)d | 0.543 | 1.30 | 1.89 | 2.94 | 1.89 | |
| M⊙ yr-1 Mpc-3 | 0.018 | 0.022 | 0.031 | |||
| Radio-loud AGN | ||||||
| No. Galaxies | 294 | 2661 | 420 | 372 | 2215 | |
| Mag. limit | ||||||
| (mJy) | 2.5 | 2.8 | 2.8 | 1.0 | 5.0 | |
| Area(sr.)a | 4.33 | 2.16 | 0.10 | 0.07 | ||
| rangeb | ||||||
| median | 0.019 | 0.073 | 0.140 | 0.150 | 0.165 | |
| Volume (Mpc3)c | 7 | 391 | 58 | 40 | ||
| (Gyr)d | 0.543 | 2.44 | 3.44 | 3.44 | 3.44 | |
NOTES:
a For the 2dFGRS-NVSS and 6dFGS-NVSS samples the area is the
effective area as defined in Section 2.3.
b The maximum redshift of each survey has been estimated from the
redshift histogram.
c Volumes are calculated to the maximum redshift of each survey and
reduced by the fraction of sky surveyed.
d is the lookback time in Gyr and is calculated from the maximum
redshift of each survey.
e As Best et al. (2005b) did not calculate the sky area of the SDSS-NVSS/FIRST sample,
we have roughly estimated it from coverage plots.
The radio luminosity function derived in this paper has a number of advantages over previous determinations:
-
•
The Near-Infrared (NIR) and radio input catalogues are from homogeneous surveys with a single instrument, and avoids biases which may result from combining surveys.
-
•
The digital -band magnitudes from the 2MASS XSC are more accurate than those which have been derived from measurements of photographic plates (eg. 2dFGRS, UGC).
-
•
The near-infrared selection of the 6dFGS means it is relatively unaffected by dust in both the target galaxy and our own Galaxy. This means that the radio selected sample will not be biased with respect to the amount of dust in the host galaxy, which can steer surveys away from galaxies with higher star-formation rates. Near-infrared magnitudes are also more closely linked to the old stellar population in galaxies, effectively tipping the balance in favour of massive early type galaxies which preferentially host radio-loud AGN.
-
•
The large sample volume of the 6dFGS contains more radio sources than any previous radio-selected galaxy sample (see table 1).
The structure of this paper is as follows. Section 2 describes the 6dFGS and NVSS surveys and our method of identifying radio sources in the 6dFGS. Section 3 outlines the global properties of 6dFGS-NVSS galaxies. Section 4 examines the population of primary sample objects which are detected in the IRAS-FSC, both as a consistency check for the spectroscopic classification of the sample and to derive the radio-FIR correlation for a larger sample of star-forming galaxies than any obtained to date. Section 5 presents the local radio luminosity function at 1.4 GHz for the radio-loud AGN and star-forming galaxies. Section 6 presents a derivation of the star-formation density at the present epoch. Section 7 presents the bivariate radio-NIR luminosity function of radio-loud AGN. Finally, Section 8 summarises the main results. Throughout, if not explicitly stated, we adopt a CDM cosmology with parameters , , and km s-1 Mpc-1 (Spergel et al., 2003).
2 Sample Selection
2.1 The 6 degree Field Galaxy Survey
The 6 degree Field Galaxy Survey is a spectroscopic survey of about 170 000 objects in the 17 046 deg2 of sky with declination and galactic latitude . The survey was carried out on the 1.2 metre UK Schmidt Telescope at Siding Spring Observatory. The majority of targets (113 988) are near-infrared selected to be complete to an apparent magnitude limit of mag. from the Two Micron All Sky Survey Extended Source Catalogue (2MASS XSC; Jarrett et al., 2000) and comprise the 6dFGS primary sample. The remainder of the survey is filled out by a number of smaller additional target samples selected in various ways at other wavelengths (Jones et al., 2004). The spectroscopic sample considered in this paper consists of the 47 317 objects from the -selected primary sample that have been observed during the period 2002 January to 2004 October and released in the Second Incremental Data Release (DR2; Jones et al., 2005) of the 6dFGS and that overlap with southern part of the NVSS survey ().
6dFGS spectra are obtained through 6 arcsec diameter fibre buttons which correspond to a projected diameter of 6.8 kpc at the median redshift of the survey (). 6dF fibres include an increasing fraction of total galaxy light for higher redshift galaxies, and therefore galaxies with emission-line nuclei are easier to recognise at lower redshift. 6dFGS observations prior to 2002 October were made with reflection gratings and cover a wavelength range of 4000–8400Å. Since 2002 October observations were made with Volume-Phase transmissive Holographic (VPH) gratings, which have provided improved efficiency and data uniformity and cover a wavelength range of 3900–7500Å. Primary target spectra typically have resolution and signal-to-noise ratio (S/N) of 10 pixel-1 allowing redshifts and host galaxy parameters (ie. emission-line ratios) to be readily determined. Redshifts are measured from the spectra using the runz package described by Jones et al. (2004) and assigned a quality class by human operators based on the reliability of the measured redshift. Only or redshifts are expected to be reliable, redshifts are reserved for Galactic sources (see Jones et al., 2005, for a complete description).
The total -band magnitudes () used for selection of 6dFGS primary targets have been derived from isophotal magnitudes () and diameters to an elliptical isophote of mag. arcsec-2 (equation 1 of Jones et al., 2004). These values of are more robust than those quoted in the 2MASS XSC and have therefore been used throughout this paper. The derived magnitudes have typical errors mag. and the near-infrared-selected sample is complete to the survey limit of mag. (Jones et al., 2006).
2.2 The NRAO VLA Sky Survey
The NVSS is a radio imaging survey of the entire sky north of at 1.4 GHz carried out on the Very Large Array (VLA) telescope in its DnC and D configurations. Its principal data products are a set of 2326 continuum images and a catalogue of about fits of elliptical gaussians to discrete sources stronger than . The images have FWHM resolution with position accuracy for sources stronger than 15 mJy, increasing to at the survey limit (Condon et al., 1998). The resolution and positional accuracy of the NVSS makes identification of radio sources with objects on optical survey plates straightforward in the majority of cases. There are 580 419 NVSS catalogue sources which overlap with the 6dFGS; a region bounded by . These sources form the primary 1.4 GHz-selected input catalogue for the 6dFGS-NVSS sample.
2.3 Sky coverage
The 6dFGS uses a tiling algorithm with variable overlap depending on the underlying galaxy density (Campbell et al., 2004). Because of this and because not all 6dFGS tiles were observed in the DR2 (Jones et al., 2005), calculating the exact area of sky surveyed is not straightforward. A method of calculating sky area for surveys with gaps in coverage such as the 6dFGS DR2 was described by Folkes (1999) and was also applied to 2dFGRS-NVSS galaxies by Sadler et al. (2002). This method estimates the area of sky covered by dividing the number of galaxies observed by the mean surface density of galaxies in the survey target list. The surface density of 6dFGS primary targets is 6.7 objects deg-2. 47 317 primary targets north of have been observed in the DR2. Therefore the effective area is 7 076 deg2, or 17.15 per cent of the celestial sphere. Calculation of the effective area in this way also accounts for the 5 per cent fibreing incompleteness of the 6dFGS. However, it takes no account of the small amount of incompleteness due to failed observations (eg. low S/N spectra); this is discussed in more detail in Section 5.
2.4 Crossmatching the 6dFGS primary sample with the NVSS
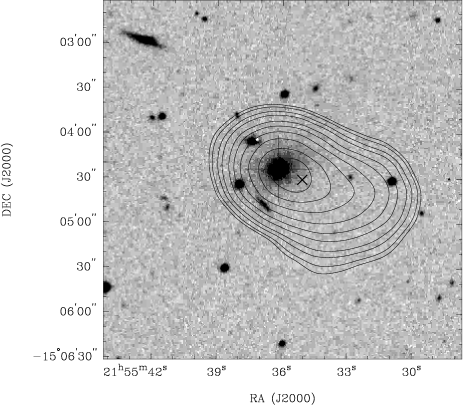
When searching for NVSS radio source identifications of the 6dFGS primary targets we used a method which aimed to maximise both the completeness (ie. all potential radio sources are included) and the reliability (ie. all included radio identifications are genuine) of the database. To ensure a high completeness and reliability of NVSS-2MASS identifications we determine a maximum position offset which includes all possible identifications, construct a list of these identifications and then verify each of them by visually inspecting overlays of radio contours onto optical images. Although checking all identifications by eye is time consuming, in our experience it is the best way to minimise the number of false identifications, as at all separations some radio identifications selected by position offset alone will be chance coincidences. Visual inspection of every radio-optical overlay also allows us to correct the catalogued flux densities of confused or diffuse sources for which the elliptical gaussian model used in the NVSS catalogue does not measure reliable radio source parameters. Our visual identification method closely follows that described by both Condon et al. (2002) & Sadler et al. (2002); the reader is referred to those papers for examples and descriptions of radio source identifications with bright galaxies in optical images.
To include all possible radio source identifications, we decided to consider all radio sources with NVSS-2MASS position offset less than 3 arcmin. This offset was chosen as it is large enough to include the majority of possible multi-component radio galaxies while still smaller than the average separation of unrelated radio-sources in the NVSS catalogue. Of the 74 609 6dFGS primary sample targets north of , 34 097 of them had at least one identification in the NVSS catalogue within 3 arcmin, of which 21 597 were observed in the 6dFGS DR2. We chose to examine the 15 716 6dFGS DR2 galaxies that have a single NVSS identification within 3 arcmin separately from the 5 881 with more than one.
2.4.1 Single-component radio sources


For all 25 096 6dFGS primary targets with a single NVSS catalogue match within 3 arcmin, the solid line in Fig. 1 shows the distribution of position offsets of radio sources from the 6dFGS galaxy (in arcsec). Five random catalogues containing 74 609 positions (the same as the number of all 6dFGS primary targets) and covering the same region of sky as the 6dFGS-NVSS sample were also matched with the NVSS catalogue. For the random positions with only a single NVSS match within 3 arcmin, the average of the 5 resulting distributions of NVSS-2MASS position offsets is shown as a dashed line in Fig. 1. At 40 arcsec the expected number of random matches is the same as the number of real matches so we conclude that all single-component NVSS matches with 6dFGS primary targets that have position offset arcsec are not genuine.
5 829 6dFGS DR2 primary targets with a single NVSS catalogue match within 3 arcmin have position offset arcsec. The dashed line in Fig. 1 implies that at separations arcsec some misassociations are expected. We visually inspected overlays of NVSS radio contours onto images from the SuperCOSMOS Sky Survey (Hambly et al., 2001) for each candidate identification and classified them as follows
-
•
Genuine (5 016 candidates), for objects whose radio-optical identification is unambiguously real.
-
•
False (693 candidates), for objects whose radio-optical identification is unambiguously not real. This is usually because the radio source is identified with another galaxy on the optical image.
-
•
Uncertain (120 candidates), for objects whose radio optical identification is ambiguous. This is usually because two possible host galaxies can be seen within the NVSS position error ellipse.
Fig. 2 shows our hand classification of 6dFGS-NVSS candidates. We find no genuine identifications of single component radio sources with position offset between 30 arcsec and 40 arcsec. The excess of real over random identifications of NVSS radio sources at these separations seen in Fig. 1 is likely to have been caused by the clustering of galaxies as was noted by Best et al. (2005b); at a real galaxy position, there is more likely to be a companion which is the true radio source identification within 100 arcsec than at a random position on the sky. For accepted NVSS-2MASS identifications the increasing range of position offsets with decreasing NVSS flux density reflects the increase in position uncertainties for fainter radio sources (Condon et al., 1998). It is clear that there is no simple NVSS-2MASS offset cutoff which separates real identifications from false identifications. The vast majority of real identifications have small (ie. arcsec) position offsets though there is still about 2 per cent contamination by false identifications with smaller separations at all NVSS flux densities. Conversely, some real identifications are found with offset arcsec. This is due to a number of factors:
-
•
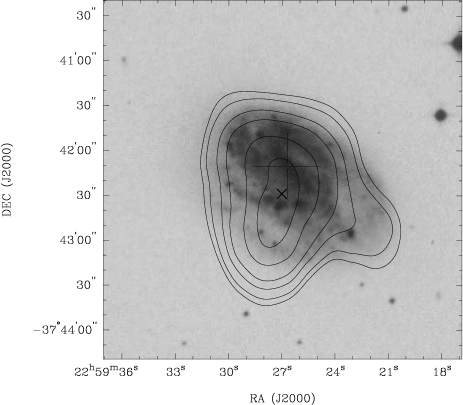
Complex and asymmetric radio sources can have fitted positions in the NVSS catalogue which differ by more than 15 arcsec from the galaxy positions in the 2MASS XSC. Two examples are shown in Fig. 3.
-
•
Some galaxies can appear at the position of one of the lobes of a double radio source whose centroid is associated with another galaxy. This can lead to false identifications of radio sources with offsets arcsec.
-
•
One of a pair of galaxies with small separation can be identified with a radio source which is clearly identified with the other galaxy. This can lead to false identifications of radio sources with offsets arcsec.
We found 120 candidate identifications which had two or more optical galaxies visible on SuperCOSMOS images inside the NVSS position error ellipse (shown as stars in Fig. 2). These candidates were considered too uncertain to make a definitive visual classification. We chose to accept as a genuine match the 55 objects with position offset arcsec for radio sources with and position offset arcsec for radio sources with . This cutoff is shown as a dashed line in Fig. 2. In the region of the figure below this line more than 99 per cent of unambiguous identifications (ie. both genuine and false) are genuine, so we expect that less than 1 per cent of unsure identifications will be misidentified by applying the cutoff.
2.4.2 Multiple-component radio sources
A further 5 881 6dFGS DR2 galaxies had more than one identification in the NVSS catalogue within 3 arcmin. We chose to examine all such candidates by visual examination of SuperCOSMOS images overlaid with NVSS contours. In 3 226 of them, one of the radio components lay within 40 arcsec of the galaxy. These were either the cores of multiple-component radio sources or a single component radio source and other unrelated NVSS radio sources within 3 arcmin. We chose to accept or reject such candidates using the method outlined in Section 2.4.1 for single component radio sources and accepted further 2 716 radio source identifications. We determined NVSS flux densities for accepted multiple-component radio sources by summing the individual catalogued flux densities of each component.
We visually classified the remaining 2 655 candidate multiple-component radio sources which have no NVSS catalogue match within 40 arcsec of the host galaxy. Classification of such objects by eye is straightforward as the sensitivity of the NVSS to extended radio emission makes it easy to identify large connected structures in the radio images. For brighter radio sources, we supplemented our visual classification by double-checking our identifications with previous optical identifications of radio sources from the Revised Third Cambridge catalogue of radio sources (3CR; Laing et al., 1983), the Parkes-MIT-NRAO survey catalogue (PMN; Griffith & Wright, 1993) and the Molonglo Reference Catalogue of radio sources (MRC; Large et al., 1981). A further 37 multiple-component radio sources were identified out of the 2 655 candidates.
2.4.3 Giant radio galaxies
A detection of at least one NVSS radio component within 3 arcmin of the host galaxy is required to identify a radio source using our identification procedure. This implies that we miss any population of Giant Radio Galaxies (GRGs) (Schoenmakers et al., 2001; Saripalli et al., 2005) which have linear sizes in excess of 6 arcmin in radio images and no detection of a core. About half of the GRGs in a sample selected by Saripalli et al. (2005) have lobes that are detected at the limit of the SUMSS catalogue but cores that are not. The space density of GRGs with linear size greater than 5 arcmin measured by Saripalli et al. (2005) is Mpc-3 for , which implies that about 40 such GRGs would be found in the 6dFGS-NVSS sample volume. About 1/3 of these would be missed by our identification procedure (ie. those with linear size arcmin and no detection of a core). GRGs are powerful radio sources and have typical 1.4 GHz radio powers between and W Hz-1. We expect that the incompleteness of the 6dFGS-NVSS sample in this radio power range will be no greater than 1 per cent because of missing GRGs.
2.4.4 Reliability and completeness
It is possible to estimate the reliability and completeness of the database for single component radio sources using the data presented in Fig. 1. We expect our visual classification scheme to be most robust for identifications of radio sources within 15 arcsec of the host galaxy position. Integrating under the dashed line in Fig. 1 out to 15 arcsec and scaling to the number of objects observed implies that 81 random associations with radio sources are expected. During visual classification we rejected 74 candidate matches and therefore an estimated 7 accepted identifications in this region are spurious. The remainder of the accepted matches had offsets between 15 arcsec and 30 arcsec. We expect 238 random associations with offsets in this region and during visual identification rejected 361 candidate matches. This implies that 123 genuine identifications in this region have been spuriously classified as false. We believe that the majority of these spuriously rejected identifications have been made for fainter ( mJy) radio sources many of whose NVSS position errors exceed 10 arcsec. Finally, we accepted no radio source identifications with position offset between 30 & 40 arcsec, however based on the small excess of real over random matches seen in this region of Fig. 1 we expect there to be 51 genuine associations. This means that for single-component radio sources in the final database, 7/5016 accepted matches are spurious, corresponding to a reliability of close to 100 per cent, and (123+51)=174 matches have been erroneously rejected, corresponding to a completeness of 97 per cent. Our estimate of completeness is likely to be a lower limit because many of the excess real over random matches at separations greater than 15 arcsec are associated with galaxy pairs as was noted in section 2.4.1. The reliability and completeness of the 2 716 identifications with more than one NVSS catalogue identification within 3 arcmin and a radio component within 40 arcsec of the host galaxy mimics that of the single-component radio sources.
The reliability and completeness of multiple-component radio source identifications with no NVSS detection with 40 arcsec of the host galaxy is difficult to determine. For the brightest sources, we crossmatched the 6dFGS-NVSS database with well-studied databases of optical identifications from the 3CR, PMN and MRC databases and found no spurious or missing identifications which implies our completeness and reliability are 100 per cent. We assume this extends to fainter radio source identifications in the 6dFGS-NVSS sample. Multiple-component radio source identifications are rare (they comprise per cent of all radio sources in this sample) and we believe these cannot affect the completeness and reliability in a significant way. The missing population of GRGs described in Section 2.4.3 also contributes per cent to the incompleteness of 6dFGS-NVSS identifications.
In summary, we find that the completeness of the 6dFGS-NVSS database is better than 96 per cent (a 3 per cent contribution from missing single-component matches and a per cent contribution from missing multiple-component matches). The reliability of the database is better than 99 per cent. Recently Best et al. (2005b) described a robust identification method utilising both the FIRST and NVSS surveys to find radio sources in the SDSS and their matching procedure had an estimated completeness of 94.4 per cent and reliability of 98.9 per cent. The FIRST survey only covers about 1 per cent of the region observed in the 6dFGS DR2 and we were therefore unable to use their method. We achieve similar (or slightly better) completeness and reliability to them by visually classifying all radio-optical identifications; we believe this is the most robust method of identifying radio sources in optical sky surveys when only the NVSS is available.
2.5 Classification of 6dFGS optical spectra


| Class | Type of spectrum | Number |
|---|---|---|
| Aa | Pure absorption line spectrum. | 2124 |
| Aae | Narrow LINER-like emission lines. | 370 |
| Ae | Emission line AGN. | 370 |
| SF | Star-forming galaxy. | 4625 |
| ? | Unclassifiable or unknown. | 321 |
| star | Galactic star. | 14 |
| Total | 7824 |
The 6dF spectrum of each accepted radio source identification was inspected visually to determine the dominant physical process responsible for the radio emission of each galaxy. We followed the scheme described by Sadler et al. (2002) and classified each spectrum as either ‘AGN’ for spectra indicative of galaxies harbouring a radio-loud active galactic nucleus or ‘SF’ for spectra indicative of galaxies with ongoing star formation. AGNs can have a pure absorption line spectrum like that of a giant elliptical galaxy (classed as Aa); a spectrum with absorption lines and weak narrow LINER-like emission lines (classed as Aae); a conventional Type II AGN spectrum which has nebular emission lines such as [Oii] , [Oiii] or [Nii] which are stronger than any hydrogen Balmer emission lines (H or H) (classed as Ae); or a conventional Type I AGN spectrum with strong and broad hydrogen Balmer emission lines (also classed as Ae). Star-forming galaxies have spectra typical of Hii regions with strong narrow emission lines of H and H dominating the spectrum (classed as SF). Figure 4 shows an example of each type of spectrum. Spectra of galactic stars were classified ‘star’ and spectra for which a classification could not be made (mostly due to a low S/N spectrum) were classed ‘?’. A ‘?’ was also appended to the end of any classification which was not certain. Our visual classification scheme is summarised in Table 2.
To check the reliability of the visual classification scheme a subsample of spectra was classified by both of us and the classifications compared. The two human classifiers agreed well, with disagreement in about 10 per cent of cases. The primary cause of disagreement is between the classification of emission-line AGN (Aae and Ae classes) and the SF class, and occurs for spectra which have line ratios which are borderline between the AGN and SF classes. If only the AGN and SF classes are considered then the two human classifiers disagree only 5 per cent of the time. In their analysis of 2dFGS spectra using the same classification scheme described here, Sadler et al. (2002) found that this scheme agreed well with methods such as principal component analysis (PCA; Folkes, 1999; Madgwick et al., 2002) and classification based upon diagnostic emission line ratios (Jackson & Londish, 2000) both of which have a similar reliability to that of the visual classification presented here.
3 Sample Properties
We matched a total of 7 824 6dFGS DR2 primary targets with radio sources from the NVSS catalogue, corresponding to a radio detection rate of 16.5 per cent. Of the 7 824 detections, 7 672 were identified with a single NVSS component and 152 were identified with more than one. Table 2 summarises the spectral properties of the accepted 6dFGS-NVSS matches. Out of the 7 824 spectra we examined, 321 were unclassifiable (classed as ’?’) and 14 of them were Galactic stars (assigned redshift quality in the 6dFGS). Of the unclassifiable spectra, 302 had redshift quality or , these spectra were too noisy for reliable spectral classification. The remaining 19 unclassifiable spectra had reliable redshift measurements, but did not present enough information for reliable visual classification.
The ratio of star-forming galaxies (SF) to radio-loud AGN in the sample is approximately 60 per cent SF to 40 per cent radio-loud AGN. The fractions of SF to radio-loud AGN in the similarly classified 2dFGRS-NVSS sample (Sadler et al., 2002) are 40 per cent SF to 60 per cent radio-loud AGN. The difference in these relative fractions can be explained by the fainter magnitude limit () of the 2dFGRS, resulting in a larger proportion of detections of more distant radio-loud AGN. It is interesting that in both the 6dFGS-NVSS and 2dFGRS-NVSS samples, over 70 per cent of all radio-loud AGN have absorption-line spectra and would be missed from AGN samples selected on the basis of optical emission lines.
3.1 The data table
| (1) | (2) | (3) | (4) | (5) | (6) | (7) | (8) | (9) | (10) | (11) |
| 6dFGS target | RA | Dec. | Offset | Spectrum | ||||||
| name | (J2000) | NVSS | SUMSS | IRAS FSC | Class | |||||
| (mag.) | (arcsec) | (mJy) | (mJy) | (Jy) | ||||||
| g0000124363113 | 00:00:12.39 | 36:31:13.1 | 12.724 | 0.1169 | 4 | 9.5 | 12.1 | Aa | ||
| g0000141251113 | 00:00:14.12 | 25:11:12.9 | 11.886 | 0.0852 | 4 | 3.8 | 28.4 | Aa | ||
| g0000356014547 | 00:00:35.64 | 01:45:47.4 | 11.267 | 0.0246 | 4 | 15.4 | 2.8 | Aae? | ||
| g0000523355037 | 00:00:52.33 | 35:50:37.2 | 11.330 | 0.0521 | 4 | 0.0 | 48.4 | Aa | ||
| g0001197140423 | 00:01:19.74 | 14:04:23.2 | 12.289 | 0.0867 | 3 | 11.0 | 40.5 | Aae? | ||
| g0001394025852 | 00:01:39.36 | 02:58:52.1 | 12.001 | 0.1013 | 4 | 2.3 | 5.5 | Aa | ||
| g0001453042049 | 00:01:45.29 | 04:20:49.0 | 11.845 | 0.0481 | 4 | 5.0 | 2.8 | Aa | ||
| g0001496094138 | 00:01:49.58 | 09:41:37.8 | 12.304 | 0.1038 | 4 | 13.8 | 3.4 | Aa | ||
| g0001558273738 | 00:01:55.82 | 27:37:38.0 | 10.164 | 0.0283 | 4 | 4.3 | 29.8 | 0.488 | SF | |
| g0001567035755 | 00:01:56.70 | 03:57:54.8 | 12.492 | 0.0226 | 4 | 2.3 | 6.2 | 0.466 | SF | |
| g0001572383857 | 00:01:57.20 | 38:38:56.4 | 12.644 | 0.0547 | 4 | 2.5 | 11.8 | 22.9 | SF | |
| g0002039332802 | 00:02:03.88 | 33:28:02.2 | 11.143 | 0.0289 | 4 | 4.2 | 6.2 | 0.941 | SF | |
| g0002348034239 | 00:02:34.81 | 03:42:38.6 | 10.623 | 0.0215 | 4 | 0.3 | 13.1 | 1.121 | SF | |
| g0002487033622 | 00:02:48.65 | 03:36:21.7 | 11.455 | 0.0208 | 4 | 6.9 | 3.9 | SF | ||
| g0002547354319 | 00:02:54.69 | 35:43:19.4 | 11.677 | 0.0489 | 4 | 24.0 | 4.2 | Aa | ||
| g0002545341408 | 00:02:54.47 | 34:14:08.4 | 10.699 | 0.0226 | 4 | 2.6 | 7.3 | 0.760 | SF | |
| g0002558265451 | 00:02:55.81 | 26:54:51.2 | 11.994 | 0.0665 | 4 | 1.1 | 94.4 | Aa | ||
| g0003051073700 | 00:03:05.06 | 07:37:00.3 | 12.291 | 0.0299 | 4 | 6.3 | 3.7 | Aae | ||
| g0003057015450 | 00:03:05.66 | 01:54:49.7 | 10.156 | 0.0244 | 4 | 1.1 | 7.7 | 0.805 | SF | |
| g0003056295159 | 00:03:05.62 | 29:51:59.3 | 11.741 | 0.0609 | 4 | 6.7 | 27.8 | Aa | ||
| g0003130355614 | 00:03:12.97 | 35:56:13.4 | 10.508 | 0.0499 | 4 | 1.4 | 589.5 | 1123.4 | Aa | |
| g0003321104441 | 00:03:32.13 | 10:44:40.6 | 10.348 | 0.0299 | 4 | 8.0 | 2.5 | Aae? | ||
| g0003449204757 | 00:03:44.90 | 20:47:56.5 | 12.314 | 0.0970 | 4 | 18.8 | 3.2 | 0.274 | SF | |
| g0004029330202 | 00:04:02.86 | 33:02:02.0 | 12.397 | 0.0380 | 4 | 12.9 | 2.4 | 0.447 | SF? | |
| g0004472013413 | 00:04:47.22 | 01:34:12.8 | 11.831 | 0.0239 | 4 | 5.1 | 9.9 | 0.843 | SF | |
| g0004517060058 | 00:04:51.74 | 06:00:57.6 | 12.722 | 0.1080 | 4 | 1.5 | 9.3 | Aa | ||
| g0004576014108 | 00:04:57.57 | 01:41:07.9 | 12.569 | 0.0239 | 4 | 9.3 | 3.6 | SF | ||
| g0005026160715 | 00:05:02.58 | 16:07:15.0 | 11.997 | 0.0339 | 4 | 13.8 | 2.2 | 0.268 | SF | |
| g0005028274253 | 00:05:02.78 | 27:42:52.5 | 11.619 | 0.0333 | 4 | 2.9 | 10.2 | 1.178 | SF | |
| g0005054070536 | 00:05:05.37 | 07:05:36.3 | 10.065 | 0.0128 | 4 | 2.6 | 12.9 | 1.038 | SF | |
Column descriptions:
(1) The target name of the object from the 6dFGS database.
(2) & (3) J2000 Right Ascension and declination of the object from the 2MASS XSC.
(4) Total K-band magnitude calculated from 2MASS isophotal K magnitude according to equation 1 of Jones et al. (2004).
(5) & (6) 6dFGS measured redshift and quality flag as described in Jones et al. (2004). Only redshifts with were
deemed reliable.
(7) The offset in arcsec from the NVSS radio position to the objects position in the 6dFGS database.
(8) The 1.4 GHz flux density in mJy from the NVSS catalogue.
(9) The 843 MHz flux density in mJy for 6dFGS objects with a SUMSS catalogue match within 10 arcsec.
(10) The IRAS FSC flux density in Jy for 6dFGS objects which also appear in additional target sample 126
(see Jones et al., 2004) of the 6dFGS.
(11) The classification of the spectrum as defined in Table 2.
Table 3 shows details of the sample of 6dFGS-NVSS radio sources. The 6dFGS target name is given for each source so that the observed 6dFGS spectra can be obtained or each object can be matched against other 6dFGS additional target samples (Jones et al., 2004). The table also shows 2MASS XSC J2000 positions, derived , redshifts and redshift quality for each source. We list offsets from the given position and integrated 1.4 GHz flux densities for each NVSS radio source. For single component NVSS radio sources with an 843 MHz SUMSS catalogue (version 1.6) detection within 10 arcsec we also list the 843 MHz flux density of the source. The list of SUMSS matches is highly incomplete at present as the 6dFGS DR2 covers little of the sky south of and version 1.6 of the SUMSS catalogue is not complete north of this declination. We plan to thoroughly investigate the properties of SUMSS radio sources in the 6dFGS when the full data releases of both surveys are made available and this will be the subject of a future paper. For objects with a match in the 6dFGS additional target sample selected from the Infrared Astronomical Satellite (IRAS) Faint Source Catalogue (FSC) (Moshir et al., 1993) (programme id 126; Jones et al., 2004) we list the m flux density of the source. The final column of the table shows the visually assigned spectral classification described in Section 2.5.
3.2 Radio source counts
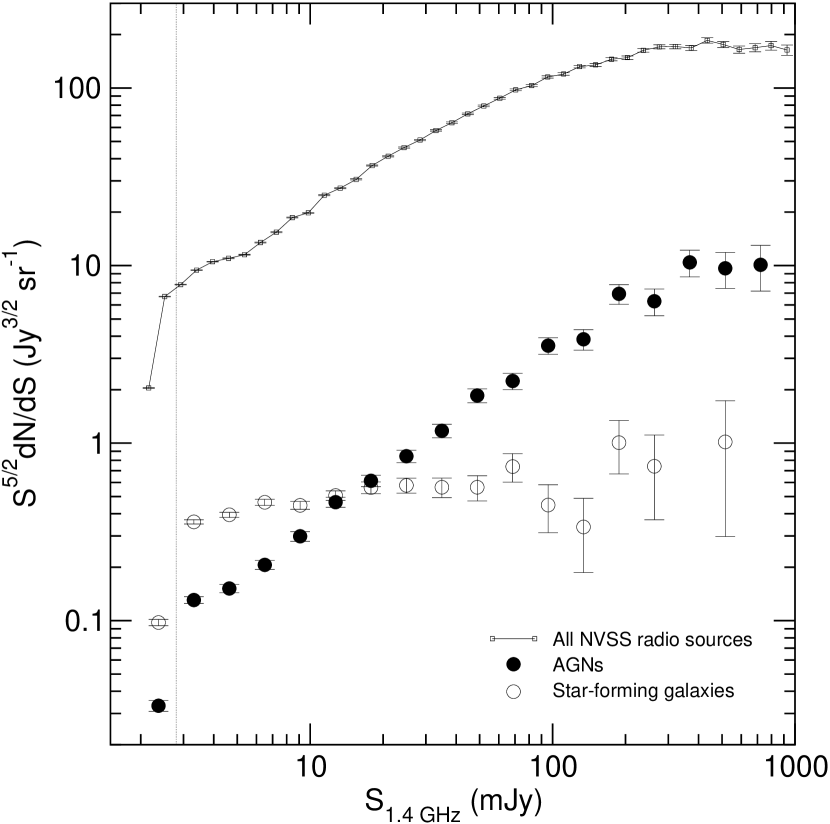
The differential source counts of 6dFGS-NVSS galaxies are plotted in Figure 5. These are plotted in a form in which each bin is weighted by such that counts in a static Euclidean universe would lie on a horizontal line. Counts determined for the radio-loud AGN are plotted as filled circles and those for star-forming galaxies are plotted as open circles. The source counts of all 580 419 NVSS catalogue sources in the same region of sky as the 6dFGS-NVSS sample are shown as squares linked by a solid line. The counts follow an approximate power law between 1 Jy and 2.8 mJy, below which they fall sharply; this is because the NVSS catalogue becomes increasingly incomplete below 2.8 mJy (Condon et al., 1998). The vertical line at 2.8 mJy shown in the figure divides the two smallest bins of the AGN and SF samples. The same falloff can be seen to the left of the vertical line in the counts of the AGN and SF subsamples indicating that this 6dFGS-NVSS sample is complete to a flux density limit of 2.8 mJy.
Radio source catalogues such as the NVSS are known to predominantly contain galaxies powered by radio-loud AGN with a median redshift of (Condon et al., 1998). In the much more nearby () 6dFGS-NVSS sample the source counts of radio-loud AGN follow roughly the same power-law slope as that of all radio sources but only account for roughly 1 per cent of their total number. The source counts of star-forming galaxies stay flat over the range 2.8 mJy to 1 Jy and therefore account for only 0.1 per cent of all sources at 1 Jy rising to 1-2 per cent of all sources at the survey limit. The counts of star-forming galaxies and radio-loud AGN cross over at about 10 mJy, below which star-forming galaxies dominate the population of radio sources. At 1 Jy there are over ten times more radio-loud AGN than star-formers, but the balance changes at lower flux density until at 2.8 mJy there are nearly ten times more star-formers than radio-loud AGN in this volume-limited sample.
3.3 Redshift distribution


Fig. 6 shows the redshift distribution of 6dFGS-NVSS objects. The redshift distribution of all objects is shown in the bottom panel and separate distributions for star-forming galaxies and radio-loud AGN are shown in the middle and top panels respectively. The median redshift of all radio sources in the 6dFGS-NVSS sample is , very close to the median redshift () of the underlying -selected sample (Jones et al., 2004). Star-forming galaxies dominate the lower redshift radio source population and are found at a median redshift of while radio-loud AGN dominate the higher redshift radio source population at a median redshift of .
The optical magnitude limits, radio flux density limits and median redshifts of other radio-optical samples, selected in a similar way to the 6dFGS-NVSS sample, are presented in Table 1. In their analysis of mJy 2dFGRS-NVSS radio sources Sadler et al. (1999) found a median redshift of for all 2dFGRS-NVSS galaxies, for star-forming galaxies and for radio-loud AGN. The 2dFGRS goes more than two magnitudes deeper in than the 6dFGS yet the median redshift of 2dFGRS-NVSS star-forming galaxies is only slightly higher than that found here for 6dFGS-NVSS galaxies, since it is primarily the radio flux density limit of optical-radio samples which limits the maximum distance to which star-forming galaxies can be found. In a survey of 2dFGRS-FIRST radio sources with a fainter flux density limit of mJy, Magliocchetti et al. (2002) found a median redshift for star-forming galaxies of , more than twice that of the NVSS selected samples. Conversely, for radio-loud AGN the median redshifts of the 2dFGRS-NVSS and 2dFGRS-FIRST samples are roughly similar () whereas the median redshift of the 6dFGS-NVSS sample is significantly lower. This is a consequence of the different optical magnitude limits of the 6dFGS and the 2dFGRS; radio-loud AGN fall out of both samples at the optical/near-infrared limit of the spectroscopy.
3.4 Detection rates
Fig. 7 shows the variation in the detection rate of 6dFGS-NVSS radio sources as a function of redshift. The detection rates were calculated by dividing the number of 6dFGS-NVSS galaxies in redshift bins of width 0.01 by the number of the 6dFGS DR2 primary targets with or in each redshift bin. The average NVSS detection rate is shown as a dashed horizontal line in and the median redshift of the 6dFGS-NVSS sample is shown as a dotted vertical line. The NVSS detection rate drops sharply from 34 per cent at to just over 11 per cent at (around the median redshift of the survey). It then rises steadily to over 20 per cent at beyond which results are dominated by counting errors. This fall and subsequent rise in the detection rate with redshift can be explained in terms of the different redshift distributions of the star-forming and radio-loud AGN populations.
Below , star-forming galaxies dominate the radio source population and the detection rate is falling because of the 1.4 GHz flux density limit of the NVSS. Star-forming galaxies have weaker radio powers and fewer are found with increasing redshift because the limiting radio power of the 6dFGS-NVSS sample is increasing with redshift. Above , the detection rate is increasing and radio-loud AGN dominate the radio source population. The population of radio-loud AGN has a higher average radio power so they tend not to fall out of the sample because of the flux density limit of the NVSS. The mag. cutoff of the 6dFGS means that as redshift increases the galaxies left in the survey are on average more luminous in the near-infrared. Radio-loud AGN preferentially reside within these most luminous galaxies (eg. Fig. 8), resulting in an increase in the detection rate of radio-loud AGN.
3.5 Luminosity distribution
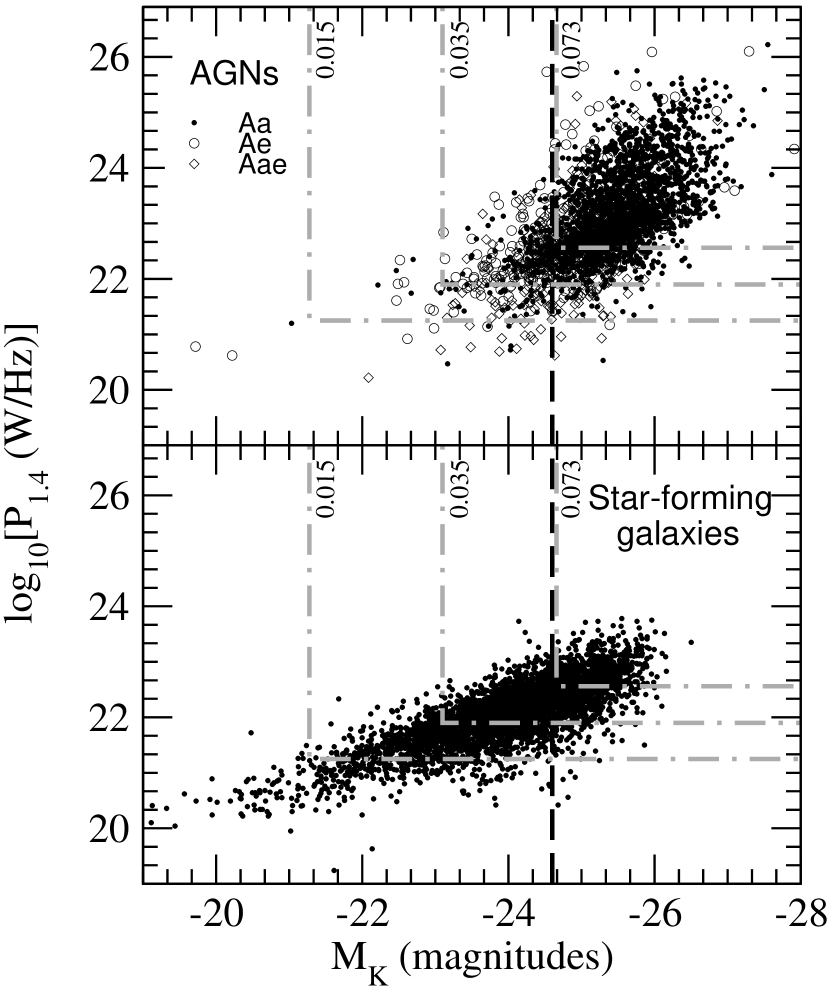
Fig. 8 shows the 1.4 GHz monochromatic radio power (, in units of W Hz-1) vs. the absolute K-band magnitude () for the radio-loud AGN (top) and star-forming galaxies (bottom). Radio power measurements have been -corrected using the usual form, where is the spectral index (). We determined median spectral indices separately for the AGN and SF classes by comparing the flux densities of the 436 galaxies that were also found in version 1.6 of the 843 MHz SUMSS catalogue (Mauch et al., 2003). For the 228 radio-loud AGN the median spectral index was and for the 208 SF galaxies the median spectral index was . These values of have been applied to the -corrections for all calculations of radio power throughout this paper. Both these values are close to the value of often assumed for radio source samples (eg. Sadler et al., 2002; Condon et al., 2002). For most of the galaxies in this sample is negligibly small.
In the -band, -corrections () are similar for galaxies of all Hubble types because different amounts of star formation in different galaxy types only significantly affect galaxy spectra at wavelengths shorter than (Cole et al., 2001; Glazebrook et al., 1995). -band -corrections have been calculated following Glazebrook et al. (1995) who derived from the evolutionary synthesis models of Bruzual & Charlot (1993) assuming an instantaneous burst of star formation at age 5 Gyr. At the small redshifts probed by this dataset , never changes by more than 0.4 magnitudes.
The star-forming galaxies in Fig. 8 span a range of between and , they have median , lower than . Star-forming galaxies, with median (W Hz, have weaker radio powers ( W Hz-1) than radio-loud AGN. Radio-loud AGN are almost all found in objects brighter than , indicative of their preferential location in the brightest galaxies. The median of radio-loud AGN is and they have median radio power (W Hz, almost an order of magnitude brighter than the median radio power of star-forming galaxies. Though star-forming galaxies have lower radio powers, radio-loud AGN span a wide range in radio power from to W Hz-1, indicating that there is no clear observational regime in which star-forming galaxies can be separated from radio-loud AGN purely on the basis of radio power.
4 The FIR-radio correlation
It has been well established that a correlation exists between far-infrared (FIR) and radio continuum emission from normal galaxies (see Helou et al. (1985); Condon & Broderick (1988); Condon et al. (1991); Condon (1992)). This correlation has been attributed to ongoing star formation within the host galaxy, where radio continuum emission is produced by a combination of synchrotron emission from electrons accelerated in the supernova remnants of short-lived massive stars ( with lifetimes yr) and free-free emission from Hii regions ionised by these same massive stars (Condon, 1992). FIR emission is caused by thermal reradiation of dust in Hii regions heated by this same population of massive stars. Though it is understood that recent star formation is the process which drives both the radio continuum and FIR emission of galaxies which lie on the correlation, the actual mechanism that relates non-thermally dominated radio power and thermally dominated FIR luminosity is poorly understood.
The FIR-radio correlation has served as a diagnostic tool for large samples of radio sources, as it can be used to distinguish between galaxies with ongoing star formation and those harbouring a radio-loud AGN. Galaxies falling on the correlation derive their radio emission from star formation, whereas galaxies with a radio “excess” above that expected from the correlation derive their radio emission from the presence of a radio-loud AGN (eg. Condon et al., 2002; Condon & Broderick, 1988). The correlation also constrains models relating star-formation rate to radio emission (Condon, 1992). In this section results from analysis of the population of radio sources in the 6dFGS-NVSS sample with FIR detections in the IRAS FSC are presented, both as a consistency check for the spectral classification of the sample and to examine the correlation for a large sample of normal galaxies.
4.1 Finding IRAS Detections
In addition to the primary -selected sample, the 6dFGS aims to measure redshifts for several additional target samples selected at various wavelengths. One of these additional target lists consists of IRAS FSC galaxies selected at from the IRAS FSC (For a complete description of the 6dFGS additional target samples see Jones et al., 2004). Much of this IRAS FSC additional target sample (which we call the 6dFGS-FSC sample) overlaps with our 6dFGS-NVSS sample. It is therefore straightforward to find IRAS-FSC detections of 6dFGS-NVSS primary target objects by crossmatching their 6dF target ID names. 4 403 6dFGS-FSC targets were observed in the DR2. Table 4 shows the spectral classification of the 2 942 galaxies which are common to the 6dFGS-NVSS sample and the 6dFGS-FSC sample. Predominantly emission line (ie. Ae, Aae, SF) galaxies are detected in the far-infrared as has been observed in other spectroscopic studies of far-infrared selected galaxies (eg. Lawrence et al., 1986; de Grijp et al., 1992; Sadler et al., 2002). The four Aa galaxies detected in the 6dFGS-NVSS-FSC subsample have low S/N and may have been misclassified.
| Spectral class | per cent of total2 | |
|---|---|---|
| SF | 2690 | 58.1 |
| Ae | 138 | 37.3 |
| Aae | 66 | 17.8 |
| Aa | 4 | 0.2 |
| star | 2 | 14.3 |
| ? | 42 | 13.1 |
| Total | 2942 | 37.6 |
NOTES:
1 The number of 6dFGS DR2 objects which are common to both the IRAS FSC and the
NVSS catalogue.
2 The percentage of 6dFGS-NVSS objects that are also 6dFGS-FSC objects.
Condon et al. (2002) noted that the FIR-radio correlation ensures that most far-infrared sources powered by ongoing star formation are also radio sources and vice versa. The FIR/radio ratio for nearby spiral galaxies in the UGC has a mean value of with rms width (Condon & Broderick, 1988). This value of happens to be the ratio between the 280 mJy flux density limit of the IRAS-FSC at m and the limit of the NVSS at 1.4 GHz . 58.1 per cent of spectroscopically classified SF galaxies have 6dFGS-FSC detections leaving 929 SF galaxies with no FIR detection. These missing detections are the result of incompleteness at the flux density limits of the 6dFGS-FSC and 6dFGS-NVSS samples and incomplete sky coverage of the region in the IRAS FSC (Moshir et al., 1993).
When available, m flux densities from the IRAS FSC were also obtained for each 6dFGS-FSC source. For the per cent of objects which did not have a m detection the m flux density was assumed to be twice the m flux density based on the calculated average with a scatter of 0.2 from the bright galaxy sample of Soifer et al. (1989). 60 and flux densities are then converted into the quantity (in units of W m-2) defined by
| (1) |
where and are in Janskys (Helou et al., 1985). is a measure of the total far-infrared flux between 42.5 and 122.5 m.
4.2 The FIR-radio ratio
The radio-FIR correlation is often parametrised by the FIR-radio flux ratio parameter (Helou et al., 1985). This is defined by
| (2) |
where (defined by equation 1) is divided by the factor Hz (the frequency at m) to convert to W m-2 Hz-1. The mean value of with rms scatter for all 2 411 objects with measured flux densities at both 60 and 100 m. is somewhat larger than the value found by Condon et al. (2002) for a more nearby sample of UGC-NVSS galaxies. This discrepancy reflects the large uncertainties associated with fainter IRAS FSC flux densities as well as the larger radio-loud AGN population contained in the present sample. For the subset of 2 242 star-forming galaxies with measured 60 and m flux densities with rms scatter , in close agreement with Condon et al. (2002) for the UGC-NVSS sample. This value also agrees well with results from samples of stronger IRAS sources in spiral galaxies (Condon et al., 1991). For the subset of 169 radio-loud AGN with measured 60 and m flux densities with rms scatter . The larger scatter is expected for radio-loud AGN as these are not expected to be correlated as strongly and the smaller average value is caused by the stronger flux densities of radio-loud AGN.
A cutoff of is often used as a diagnostic to distinguish between star-forming galaxies and radio-loud AGN (eg. Condon et al., 2002), and it appears that the spectroscopic classification of radio sources used in this work agrees well with this diagnostic. Only 10 of the SF galaxies in the combined 6dFGS-NVSS-FSC sample have , the value below which a galaxy is 3 times more radio loud than the mean for star-forming galaxies. These 10 galaxies may come from a class of “composite” radio source, whose radio emission is a mixture of both star-forming and radio-loud AGN activity or they may be candidate “taffy” galaxy pairs which recently suffered a direct collision (eg. Condon et al., 1993). The SF spectral classification of these objects is retained in further analysis.
4.3 Far-infrared colours
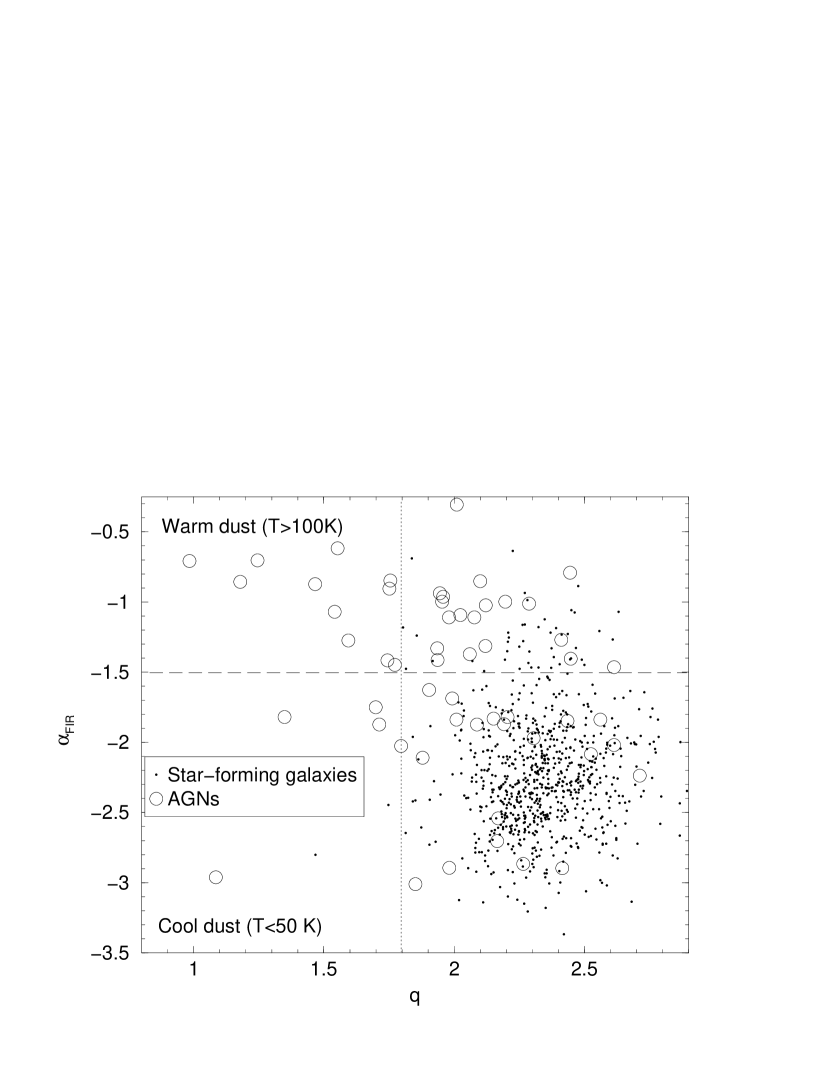
Another diagnostic which can be used to distinguish between radio-loud AGN and star-forming galaxies is the far-infrared spectral index between 60 and 25 m, . is a measure of the temperature of the FIR emitting dust. Star-forming galaxies have cooler ( K) dust emission because of their extended star and gas distributions and therefore have values of . The central engines of AGNs heat the dust to warmer temperatures ( K) and have values of (de Grijp et al., 1992).
Sixty radio-loud AGN and 769 SF galaxies in the sample were detected in the IRAS FSC at 25 m. Fig. 9 plots vs. for these galaxies, comparing the dust temperature of each galaxy with its degree of radio excess. The vast bulk of SF galaxies lie in the lower right of the plot as expected from the radio-FIR correlation. The majority of radio-loud AGN have (many lie outside the boundary on the upper left of Fig. 9) indicating that the FIR spectral index, used in concert with the radio-FIR correlation agrees well with spectral classification as a discriminator of star-forming galaxies and radio-loud AGN.
4.4 Composite optical spectra and IRAS comparisons
For about 90 per cent of the radio-detected 6dFGS galaxies in Table 3, a classification as either AGN or SF (as discussed in Section 2.5) appears straightforward. Most of the galaxies we have classified as SF are detected by IRAS, and almost all of them lie in the lower right-hand quadrant of Fig. 9, as expected if their FIR emission arises from dust heated in star-forming regions. In contrast, the IRAS detection rate of the objects classified as Aa in Table 3 is close to zero, as expected if their inner regions are largely free of gas and dust and their radio emission comes exclusively from an AGN.
For the 10 per cent of galaxies in Table 3 which show optical emission lines with ratios characteristic of an AGN, and which are therefore classified as Aae or Ae, the situation is less clearcut. As discussed by Best et al. (2005b), a possible problem with spectral classification of emission line AGN as radio-loud is that emission-line AGN activity is often be accompanied by star formation (Kauffmann et al., 2003). Even if the AGN is radio-quiet, this associated star formation will give rise to radio emission. For any such galaxy included in the sample, the origin of the radio emission will be star formation, but the optical spectrum could still be dominated by emission lines from a (radio-quiet) AGN, leading us to classify the object as Aae or Ae.
Although the present data are insufficient to disentangle the separate contributions from star formation and the AGN to the radio emission from these galaxies, we can estimate what fraction of them might have been misclassified spectroscopically by comparing our spectroscopic classification with the radio-FIR diagnostic. High resolution Very Long Baseline Interferometry (VLBI) imaging of these sources may be used to distinguish the parsec-scale AGN components of these galaxies from the kpc scale radio structure resulting from star formation (eg. Norris et al., 1992). Such observations are outside the scope of the present paper.
Twenty spectroscopically classified AGN in the 6dFGS-NVSS sample lie in the lower right region of Fig. 9 and would be classified as star-forming galaxies by the radio-FIR diagnostic. This implies that about 1/3 of all spectroscopically classified emission-line AGN (Ae and Aae class) in the 6dFGS-NVSS sample ( 250) fail the radio-FIR diagnostic. It is probable that some of these may be genuinely misclassified as radio-loud AGN from their optical spectra and derive the majority of their radio emission from star formation. Assuming that all absorption-line radio-loud AGN (Aa class) have been correctly classified, the disagreement between spectroscopic classification and the radio-FIR diagnostic for 6dFGS-NVSS AGN is per cent. We estimated a similar reliability for our classification scheme in Section 2.5 from repeated visual inspection of the spectra. It is clear that difficulties in classifying emmision-line spectra with composite or borderline AGN+SF properties are the primary cause of misclassification of radio sources in our sample. We believe that this is a worst-case estimate of the reliability of our spectroscopic classification and note that on the whole the spectroscopic classification technique agrees well with the radio-FIR correlation diagnostic.
Only 38 per cent of objects in the 6dFGS-NVSS sample were detected in the 6dFGS-FSC sample. This makes the radio-FIR correlation diagnostic unsuitable for the sample presented in this paper because a non-detection of a galaxy in the 6dFGS-FSC sample does not preclude it from being a star-forming galaxy in the 6dFGS-NVSS sample. Deeper wide-angle far-infrared surveys are required to detect star-forming galaxies out to the redshifts probed by the current generation of optical redshift surveys.
4.5 The FIR-Radio correlation of 6dFGS galaxies

Fig. 10 shows the radio-FIR correlation ( vs. ) of 6dFGS-NVSS galaxies with a 60 m detection in the IRAS FSC. Spectroscopically classified AGN are plotted as circles and SF galaxies are plotted as dots. The SF galaxies show a strong correlation between radio power and FIR luminosity extending over 4 orders of magnitude though the scatter tends to increase above as was seen for IRAS-FSC detected galaxies in the 2dFGRS-NVSS sample of Sadler et al. (2002). The FIR luminosities show less correlation with radio power for radio-loud AGN; these are found across the whole range of FIR luminosity sampled. Many of them have “excess” radio powers, causing them to lie above the correlation defined by the star-forming galaxies. These radio-excess IRAS galaxies are of interest for understanding the connection between star formation and AGN in galaxies (Drake et al., 2003).
A least-squares line of best fit to the subsample of 2 242 star-forming galaxies for which accurate 60 and 100 m flux densities are available in the IRAS-FSC is also shown in Fig. 10. The line has the form
| (3) |
which is similar to that found in other derivations of the radio-FIR correlation for brighter galaxies (eg. Condon et al. (1991); Condon & Broderick (1988); Devereux & Eales (1989)).
4.6 Ultraluminous infrared galaxies
Ultra-luminous Infrared Galaxies (ULIRGs) with which are powered by a mixture of starburst activity and an AGN (Sanders & Mirabel, 1996) are of interest for understanding the starburst-AGN connection. There are two ULIRGs in the present sample; such objects are extremely rare in the local universe. The nearest known (Arp 220) has redshift . The local ULIRG space density, estimated from the FIR luminosity function of Saunders et al. (1990), is Mpc-3. The enclosed volume of the 6dFGS-NVSS sample (see Table 1) is Mpc3, meaning that less than 4 ULIRGs are expected in the 6dFGS-NVSS volume. Interestingly, Sadler et al. (2002) found 7 ULIRGs in the 2dFGRS-NVSS sample, in a volume of Mpc3 in the redshift range , which implies their space density is Mpc-3 within the more distant 2dFGRS redshift range. This suggests that these objects evolve strongly with redshift and is consistent with their measured evolution of between (Cowie et al., 2004; Sanders, 2004).
5 The local Radio Luminosity Function
The luminosity function () of a sample of astronomical objects is a measure of the variation in their space density with luminosity. The local radio luminosity function (RLF) is the global average space density of radio sources at the present epoch (Auriemma et al., 1977; Condon, 1989). An accurate derivation of the local radio luminosity function is important as a present epoch benchmark for studies of the population of radio sources at higher redshift so that their cosmological evolution can be determined. In this section we derive the local radio luminosity function (RLF) for the 6dFGS-NVSS sample as a whole and for the star-forming galaxy and radio-loud AGN subgroups separately.
5.1 Completeness
The RLF can be calculated directly but requires a sample which is complete to the limits of all the surveys from which it is derived. We therefore must define a subsample of the 6dFGS-NVSS sample which is complete to both its -band magnitude limit and 1.4 GHz flux density limit. In the -band, the 2MASS XSC from which the 6dFGS primary sample is selected is complete and reliable well below the mag. limit of the 6dFGS (Jarrett et al., 2000; Jones et al., 2006). The 6dFGS primary sample may also miss populations of radio sources in the local universe either because their hosts appear stellar on optical plates (eg. QSOs, BL Lacs or compact galaxies) or because they are too blue in colour to be detected in the 6dFGS primary sample (eg. Seyfert galaxies). A selection of such objects were observed as additional targets during the 6dFGS under programme id. 125 (Jones et al., 2004). A full analysis of them will be the subject of a future paper.
The sharp drop in the source counts of NVSS radio sources below 2.8 mJy (Fig. 5) indicates that the NVSS catalogue is incomplete below this limit. We applied a 1.4 GHz flux density limit of 2.8 mJy to the 6dFGS-NVSS sample when calculating the RLF. The same flux density limit was used by Sadler et al. (2002) to measure the luminosity function of 2dFGRS-NVSS radio sources. There are 6 961 6dFGS-NVSS galaxies with mJy, of which 6 667 have 6dFGS DR2 measured redshift . Of these, 3 997 were assigned spectral class SF, 2 652 were assigned AGN and 18 were unclassified. These 18 unclassified spectra with measured redshifts were classified on the basis of their measured radio power: those with W Hz-1 (9) were classed as SF and those with W Hz-1 (9) were classed as AGN.
We corrected the measured luminosity function for incomplete sampling of the celestial sphere by the 6dFGS DR2 and for spectroscopic incompleteness of the 6dFGS-NVSS sample. To account for incomplete sampling of the celestial sphere we normalised all volumes by the effective area of the 6dFGS-NVSS sample derived in Section 2.3. Of the 6 961 6dFGS-NVSS objects meeting our selection criteria, 280 had spectra which were too poor in quality to determine a redshift and 14 were associated with galactic stars. The poor quality spectra arose for a myriad of reasons which were primarily instrumental (eg. broken fibres, misplaced buttons etc.) and are expected to be a random subset of the data. The spectroscopic incompleteness of 4 per cent causes the luminosity function to be underestimated, so values of have been increased by 4 per cent to compensate.
5.2 Calculating the luminosity function
We have measured the radio luminosity function using the method of Schmidt (1968). is the maximum volume in which a galaxy will satisfy all of the sample selection criteria, which in the case of the 6dFGS-NVSS sample are mJy, mag. and .
We have corrected the measured RLF for galaxy clustering at a distance centred on our own Galaxy using
| (4) |
(Peebles, 1980), as discussed by Condon et al. (2002). Here is the expected overdensity near our own Galaxy, or the space density () of local galaxies divided by the average space density () of all galaxies, is the slope and the correlation scale length from a power-law fit, , of the two-point correlation function in redshift space. The two-point correlation function of local radio sources has been derived from a subset of the 6dFGS-NVSS sample (Mauch, 2006), and is adequate to describe clustering of radio sources centred on our own galaxy. Derivations of and for radio sources in the 6dFGS-NVSS sample yielded values of and . has a power-law form for distances Mpc, and for Mpc. Therefore to correct for the local overdensity, we have multiplied the volume within by equation 4 to calculate for Mpc. In practise, is always much larger than the local clustering volume, and so this correction has made little difference to the results.
5.3 Results
| All galaxies | Star-forming galaxies | Radio-loud AGN | |||||||
| (W Hz-1) | (mag-1 Mpc-3) | (mag-1 Mpc-3) | (mag-1 Mpc-3) | ||||||
| 20.0 | 3 | 3 | |||||||
| 20.4 | 46 | 43 | 3 | ||||||
| 20.8 | 116 | 103 | 13 | ||||||
| 21.2 | 319 | 296 | 23 | ||||||
| 21.6 | 654 | 589 | 65 | ||||||
| 22.0 | 1266 | 1106 | 160 | ||||||
| 22.4 | 1496 | 1119 | 377 | ||||||
| 22.8 | 1138 | 588 | 550 | ||||||
| 23.2 | 658 | 133 | 525 | ||||||
| 23.6 | 378 | 26 | 352 | ||||||
| 24.0 | 259 | 259 | |||||||
| 24.4 | 183 | 183 | |||||||
| 24.8 | 81 | 81 | |||||||
| 25.2 | 49 | 49 | |||||||
| 25.6 | 16 | 16 | |||||||
| 26.0 | 3 | 3 | |||||||
| 26.4 | 2 | 2 | |||||||
| Total | 6667 | 4006 | 2661 | ||||||


Table 5 lists the measured local radio luminosity function for the star-forming galaxies, radio-loud AGN and the 6dFGS-NVSS sample as a whole. The 4 006 star-forming galaxies have , the 2 661 radio-loud AGN have and all the 6 667 radio sources in the combined sample have . The value for radio-loud AGN is more than from the value of expected if there were no significant clustering or evolution in the sample. Some evolution of the radio-loud AGN population is probable over the 1–2 Gyr lookback time of the 6dFGS-NVSS sample. The local radio luminosity function of all 6dFGS-NVSS galaxies is shown in Fig. 11; its statistical errors are of order 1 per cent or less over 5 decades of radio luminosity. Separate local radio luminosity functions for both star-forming galaxies and radio-loud AGN are shown in Fig. 12. These cross over at W Hz-1, star-forming galaxies dominate the population of radio sources below this power and radio-loud AGN dominate the population above it.
Galaxy luminosity functions are commonly fitted by the Schechter function (Schechter, 1976). This function turns over more steeply toward high luminosities than radio luminosity functions of star-forming galaxies. Instead the radio luminosity function is commonly fitted by the parametric form given by
| (5) |
as was used to fit the luminosity function of IRAS galaxies by Saunders et al. (1990). The best-fitting parameters of equation 5 for 6dFGS-NVSS star-forming galaxies are:
Equation 5 is inadequate to describe the RLF of radio-loud AGN and we have instead fitted these data with a 2 power-law function analogous to the optical luminosity function of quasars:
| (6) |
(Brown et al., 2001; Dunlop & Peacock, 1990). The best fitting parameters of equation 6 for 6dFGS-NVSS radio-loud AGN are:
The curves plotted in Fig. 12 show the fits of equations 5 and 6 to the star-forming galaxies and radio-loud AGN respectively. The radio luminosity function of all 6dFGS-NVSS galaxies is the sum of the two contributions from star-forming galaxies and radio-loud AGN, as shown in Fig. 11. The curve in this figure is the sum of the two separate fits to the radio luminosity function for the star-forming galaxies and radio-loud AGN.
5.4 Discussion
The radio luminosity function of active galaxies maintains a power-law form for about 5 orders of magnitude before turning over above W Hz-1. This power-law form of the radio-loud AGN luminosity function can only continue to fainter powers if it does not exceed the space density of the luminous galaxies in which radio-loud AGN preferentially reside. Taking the best fit Schechter function to the B-band luminosity for early-type galaxies in the 2dFGRS from Madgwick et al. (2002), and assuming that radio-loud AGN typically live in the brightest early type galaxies (see Fig. 8, top), the space density of early-type galaxies with () is Mpc-3 (for km s-1 Mpc-1). The space density of radio-loud AGN with W Hz-1 from the 6dFGS-NVSS luminosity function of Fig. 12 is Mpc-3. If the power-law form for radio-loud AGN continues to fainter radio powers a maximum must be reached at W Hz-1, just beyond the limit of the present data. Though there is some evidence (eg. from Fig. 8) that radio-loud AGN of lower radio power may live in less luminous host galaxies which have higher space density.
In recent models, in which the radio-loud AGN luminosity function is interpreted as the distribution of the time spent by an AGN at a given radio power, the strong variability of radio-loud AGN is related to the heating of cooling flows in galaxies and clusters (eg. Nipoti & Binney, 2005; Best et al., 2006). From a fit to the radio luminosity function of 2dFGRS-FIRST radio sources, Nipoti & Binney (2005) predict that the AGN luminosity function will turn over at W Hz-1, just at the faint limit of the 6dFGS-NVSS luminosity function. Such models are poorly constrained by observational data at present and require further constraints on the relationship between the mechanical luminosity of heating of cooling flows by radio jets in AGN as well as a more detailed understanding of the X-ray luminosity function of AGN.
5.5 Comparison of recent RLF measurements
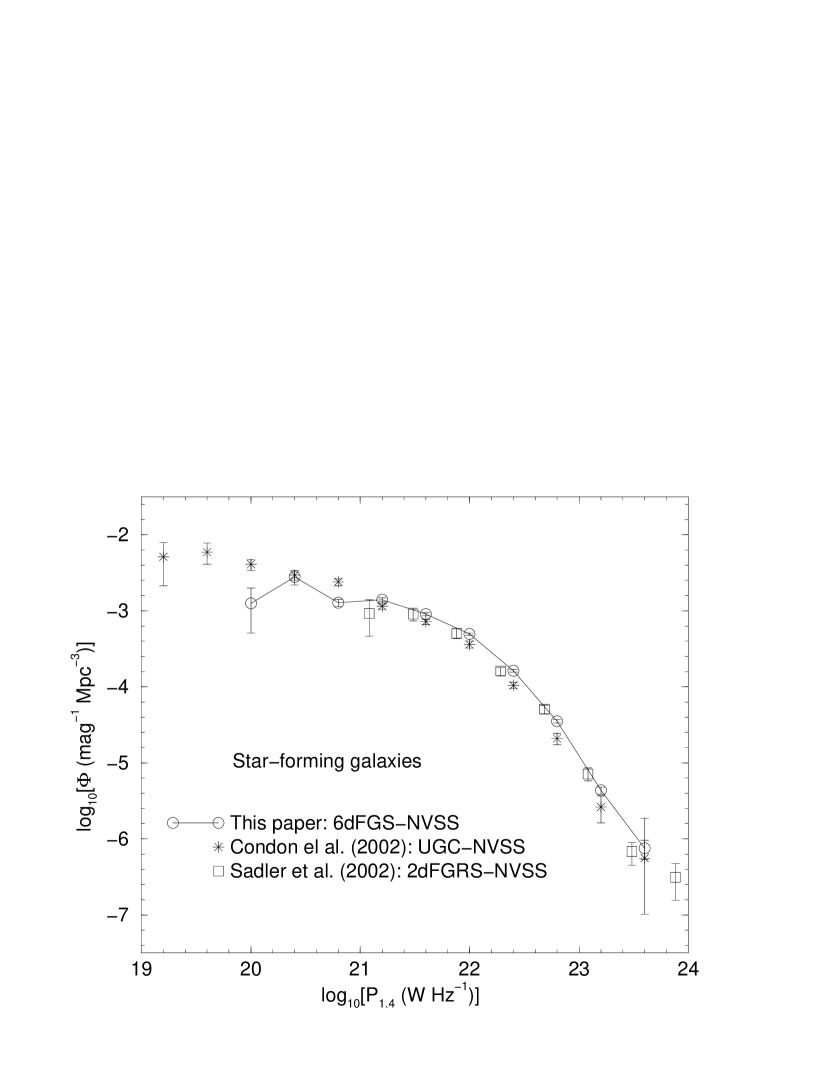

Fig. 13 shows a comparison of the RLFs of 6dFGS-NVSS galaxies with those of UGC-NVSS galaxies and 2dFGRS-NVSS galaxies. Values of the 2dFGRS-NVSS luminosity function have been shifted from their published values to km s-1 Mpc-1. The properties of these three surveys are compared in Table 1. We make no comparison of our measured RLF with that measured from SDSS-NVSS/FIRST galaxies because the normalisation of the SDSS-NVSS/FIRST RLF is tied to the 2dFGRS-NVSS RLF which it follows very closely over the complete range of radio powers sampled (Best et al., 2005b). We also do not make any comparison with the 2dFGRS-FIRST RLF because the FIRST survey is insensitive to the large-scale radio emission seen in many nearby radio sources. We therefore believe that Magliocchetti et al. (2002) have underestimated the total flux density of many of the radio sources in the 2dFGRS-FIRST sample. The 6dFGS-NVSS sample presented here samples a larger volume of space than the other radio source samples and probes lookback times intermediate between the nearby UGC-NVSS sample and the more distant 2dFGRS-NVSS one. These three luminosity functions are all drawn from the same radio source catalogue and differ only in the optical/near-infrared samples from which they are selected. The agreement between them is striking.
5.5.1 Star-forming galaxies
The 6dFGS-NVSS luminosity function of star-forming galaxies in the upper panel of Fig. 13 agrees with the other two over the range W Hz-1. The falloff at the W Hz-1 point is caused by the small numbers of low luminosity star-forming galaxies in the 6dFGS sample volume and can also be seen at the lowest radio powers in the luminosity function of 2dFGRS-NVSS galaxies. The UGC-NVSS luminosity function extends about an order of magnitude deeper in radio power for star-forming galaxies, reflecting the larger number of low-luminosity radio sources detected in a flux density limited sample covering a larger solid angle. The 6dFGS-NVSS luminosity function of star-forming galaxies does not fall as steeply as the other two at the highest radio powers ( W Hz-1). We believe this is caused by the near-infrared selection of the 6dFGS-NVSS sample.
5.5.2 Radio-loud AGN
The radio-loud AGN luminosity function of 6dFGS-NVSS galaxies agrees well with the UGC-NVSS radio-loud AGN luminosity function. The UGC-NVSS radio-loud AGN sample consists of only 294 objects and is therefore not as well constrained. Most of the large error bars in the UGC-NVSS radio-loud AGN luminosity function overlap with the 6dFGS-NVSS points. A power-law fit to the 6dFGS-NVSS luminosity function below is
| (7) |
and to the 2dFGRS-NVSS luminosity function is
| (8) |
The 2dFGRS-NVSS luminosity function has the same power-law form as the 6dFGS-NVSS luminosity function over nearly four orders of magnitude. The present data are insufficient to measure any possible evolution over the narrow redshift range of to between the two samples.
6 The star-formation density at the present epoch
Radio emission from star-forming galaxies is the product of massive () stars which have short lifetimes ( yr). Roughly 90 per cent of this radio emission comes from non-thermal synchrotron electrons, which have been accelerated in the remnants of type II supernovae, and the remainder comes from ionised hydrogen gas in Hii regions heated by the most massive stars. This means that the radio luminosity of star-forming galaxies is roughly proportional to the rate of recent ( yr) star-formation (Condon, 1992). It is therefore possible to use the star-forming galaxies in this sample to estimate the present epoch star-formation density of the universe for galaxies with mag., which is the zero point of the Madau diagram (Madau et al., 1996). Estimates of the local star-formation density made from radio surveys are particularly robust as they are free from the effects of dust extinction. Effects of extinction are minimised in the 6dFGS-NVSS sample, as the radio selection is made from a near-infrared galaxy sample.
6.1 Calculating the star-formation density

It is possible to estimate the local star-formation density as a function of star-formation rate directly from the radio luminosity function using a method described by Cram (1998) and Haarsma et al. (2000). Assuming a typical Salpeter-like initial mass function of the form
| (9) |
between 0.1 and 100, the star-formation rate of stars more massive than 0.1 (in yr-1) can be calculated from the 1.4 GHz radio power by the relation
| (10) |
(Sullivan et al., 2001). The star-formation density can then be determined as a function of star-formation rate by multiplying the star-formation rate by the space density of radio sources, or simply
| (11) |
in yr-1 mag.-1 Mpc-3. Fig. 14 shows equation 11 for the luminosity function of 6dFGS-NVSS star-forming galaxies. Star-forming galaxies in the 6dFGS-NVSS sample trace star-formation rates between 0.1 and 500 yr-1, though the major contribution to the local star-formation density comes from galaxies with star-formation rates around 10 yr-1 as has been seen in other determinations of the star-formation density of the local universe (eg. radio; Sadler et al. (2002) and H; Gallego et al. (1995)).
Integrating underneath the curve in Fig. 14 gives an estimate of the global star-formation density at the present epoch (). The vast majority of radio sources in this sample contribute to the integral near its maximum at 10 yr-1; the less certain points below this maximum make little contribution to the integral. This implies that the global star-formation density will be accurately constrained by the data. Rather than compute the global star-formation density from the binned data in Fig. 14 it is preferable to compute directly from a sum over each sample galaxy. This is done by computing the local power density function (),
The total radio power produced per unit volume of space (in units of W Hz-1 Mpc-3) is just the integral over all radio powers of the power density function
| (12) |
which can be calculated directly as the sum over all galaxies of . is directly proportional to the star-formation rate density and is computed using the relation
| (13) |
the factor comes from the conversion between star-formation rate and radio power in equation 10.
6.2 Results
The global power density of star formation at the present epoch implied by the 6dFGS-NVSS sample is W Hz-1 Mpc-3. This translates to a global star-formation density
| (14) |
The uncertainty in quoted here is purely statistical and takes no account of the errors arising from the conversion from to star-formation rate in equation 10. Errors in this conversion come primarily from predicting the star-formation rate from the Type II SNe rate, which contributes 90 per cent of the radio power at 1.4 GHz (Sullivan et al., 2001), from models of the total radio spectral energy per Type II supernova and from the assumption of a Salpeter-like initial mass function in equation 9.
Values for measured from the UGC-NVSS and 2dFGRS-NVSS samples are shown in Table 1. The value of for 6dFGS-NVSS galaxies is intermediate between values those for the other samples. Condon et al. (2002) derived yr-1 Mpc-3 for the UGC-NVSS sample of 1672 star-forming galaxies and Sadler et al. (2002) derived yr-1 Mpc-3 (converted to km s-1 Mpc-1) for 242 star-forming galaxies from the 2dFGRS-NVSS sample. Differences in the measured values of between the three radio samples are likely to be caused by their different optical/near-infrared magnitude limits. Fainter and hence less massive galaxies can make a significant contribution to the local star formation density (Brinchmann et al., 2004). For example, from Fig. 15 of Brinchmann et al. (2004) we estimate that the magnitude limit of the 6dFGS-NVSS means the sample misses at least yr-1 Mpc-3 of the local star-formation density measured from H. The 2dFGRS-NVSS sample on the other hand has an optical limit about 2 magnitudes fainter than the 6dFGS-NVSS sample and misses only a negligible amount of local star formation. Further differences between the three samples are probably the result of evolution in the star-formation density over the narrow redshift range.
Uncertainties in the relationship between monochromatic radio power and star-formation rate do not affect models describing the relationship between star-formation rate and luminosities at shorter wavelengths. However, dust extinction within the Hii regions where star formation occurs contributes increasingly to the model uncertainties at these shorter wavelengths. The value of measured here has been compared with other recent determinations measured from a broad range of wavelengths by Hopkins & Beacom (2006). The interested reader is referred to this paper for more information. The general agreement (usually to within a factor of 2) between values of at different wavebands is reassuring.
7 Bivariate radio-NIR luminosity functions
The local RLF of radio-loud AGN presented in section 5 contains large numbers of galaxies in most bins of radio power, which enables us to split it into statistically significant subclasses. In particular, the local radio luminosity functions can be broken into bins of absolute -band magnitude () to examine the radio properties of galaxies of different near-infrared luminosities. The near-infrared selection of the 6dFGS-NVSS sample is of particular importance here, as the -band galaxy luminosity is an extinction-free estimator of the mass of the old stellar population in galaxies. The vast majority of radio-loud AGN reside in early type galaxies whose absolute -band magnitude gives an indication of their bulge mass which in turn is correlated with the black hole mass (eg. Marconi & Hunt, 2003). It is therefore possible to examine how the properties of radio-loud AGN may vary with black-hole mass.
One of the first bivariate radio-optical luminosity functions was determined by Auriemma et al. (1977) from a sample of radio detections of bright elliptical galaxies. They showed that the probability of an elliptical galaxy to host a radio-loud AGN increases strongly as a function of optical luminosity. Further studies using larger samples of elliptical galaxies were carried out by Sadler et al. (1989) and Ledlow & Owen (1996) who verified the result of Auriemma et al. (1977) and found that the break in radio luminosity function scaled strongly with host galaxy luminosity. More recently Best et al. (2005a) used the SDSS-NVSS/FIRST sample of 2 215 galaxies to calculate accurate bivariate radio luminosity-mass functions, from both host-galaxy mass and black-hole mass. They found that the fraction of galaxies hosting a radio-loud AGN increases strongly as a function of both galaxy and black hole masses. Best et al. (2005a) also argued that there was no evidence for any dependence of the break luminosity on black hole mass.
Here, we measure the bivariate radio-NIR luminosity function for the first time which we can compare with bivariate radio-optical luminosity functions. The 6dFGS-NVSS bivariate luminosity function is calculated from accurate observed quantities measured from homogeneous all-sky surveys. We therefore avoid any errors which may arise from calculating the bivariate luminosity function from derived quantities. For example the large observed scatter in the relation of 0.3 dex (Tremaine et al., 2002) is a significant source of error in the bivariate radio luminosity versus black-hole mass function measured by Best et al. (2005a).
7.1 Calculating the bivariate luminosity function
When separating the radio luminosity function into bins it is preferable to define a normalised, or fractional luminosity function
| (15) |
which is the radio luminosity function of galaxies in bin ( in Mpc-3) divided by the volume density ( in Mpc-3) of all galaxies with absolute magnitude in the -magnitude bin . The radio luminosity function in each -band magnitude bin is calculated using the method (Schmidt, 1968) in 1-magnitude radio luminosity bins of width 0.4 in . This gives in units of mag-1 Mpc-3. With this definition represents the fraction of all galaxies in the absolute near-infrared magnitude bin that have radio power between and .
To determine , the volume density of galaxies with absolute near-infrared magnitude , it is convenient to use the -band galaxy luminosity function . It is important that the -band luminosity function used be subject to the same selection criteria as the radio sample, so as not to introduce biases from cosmic variance into the data. We use the determination of the 6dFGS K-band luminosity function described by Jones et al. (2006). Its error bars are much smaller than those in the 6dFGS-NVSS luminosity function and are therefore ignored when calculating .
7.2 The bivariate radio-NIR luminosity function of radio-loud AGN
| () | () | () | () | |||||||||
|---|---|---|---|---|---|---|---|---|---|---|---|---|
| (W Hz-1) | ||||||||||||
| 20.4 | 1 | 1 | ||||||||||
| 20.8 | 3 | 7 | 1 | |||||||||
| 21.2 | 7 | 10 | 4 | |||||||||
| 21.6 | 16 | 38 | 8 | |||||||||
| 22.0 | 31 | 76 | 49 | |||||||||
| 22.4 | 19 | 189 | 161 | 5 | ||||||||
| 22.8 | 8 | 148 | 380 | 14 | ||||||||
| 23.2 | 4 | 57 | 359 | 105 | ||||||||
| 23.6 | 2 | 44 | 209 | 93 | ||||||||
| 24.0 | 14 | 167 | 77 | |||||||||
| 24.4 | 6 | 99 | 74 | |||||||||
| 24.8 | 3 | 33 | 42 | |||||||||
| 25.2 | 1 | 10 | 36 | |||||||||
| 25.6 | 1 | 4 | 10 | |||||||||
| 26.0 | 2 | |||||||||||
| Total | 91 | 594 | 1487 | 456 | ||||||||

Table 6 lists and Fig. 15 shows for radio-loud AGN in four bins of . Below the broad break between and W Hz-1 seen in the RLF in Fig. 12 can be seen in the brightest bins (). In the faintest 2 bins (), the data do not extend to high enough radio powers to detect a break. In the brightest bins of the fractional luminosity function turns over below the radio power at which . It is probable that this turnover is caused by the normalisation of the fractional luminosity function; a larger fraction of radio sources cannot be measured at a given because nearly all available galaxies are detected. The turnover occurs at fainter radio powers in less luminous galaxies, this is probably because both less luminous galaxies and less powerful radio sources have higher space density.
There is a clear decrease with radio power in the fraction of galaxies which are radio-loud AGN for all , reflecting the decrease in space density of radio-loud AGN with increasing radio power. For a given radio power, there is a strong increase in the fraction of galaxies which are radio-loud AGN with brightening . More luminous galaxies are therefore more likely to host a radio-loud AGN as has been seen in previous determinations of the fractional radio-optical luminosity function of elliptical galaxies. To properly quantify this effect we determine the fractional luminosity function in its integral form.

7.3 The integral bivariate radio-NIR luminosity function of radio-loud AGN
The integral form of the fractional luminosity function at a particular radio power () is calculated in each bin from the sum of between the largest bin of radio power () to . It measures the fraction of all galaxies which are radio sources with powers greater than in each bin. It is not straightforward to calculate the error at each point of because the points are not independent. For this reason we calculated errors in each radio power bin of using bootstrap analysis with iterations.
Fig. 16 shows the fractional luminosity function of radio-loud AGN in integral form in four bins of , with bootstrap errors. With the available data, radio powers at which 40-50 per cent of galaxies are detected as radio-loud AGN are reached at the brightest bins. The function has approximately the same shape for all bins of though this breaks down above which is caused by the turnover in discussed in Section 7.2. Best et al. (2005a) also found a ceiling in the bivariate radio luminosity-mass function of SDSS-NVSS/FIRST galaxies at the 30 per cent level. We determine the dependence of (the fraction of all galaxies that are radio loud) on by scaling to remove the dependence on . The best-fitting scaling factor for is ; clearly, the probability of a galaxy to host radio-loud AGN is a strong function of its -band luminosity.
Given that the majority ( per cent) of the radio-loud AGN in the 6dFGS-NVSS sample reside in early-type galaxies, their total -band luminosity should be close to or equal to their near-infrared bulge luminosity (). Assuming this, the -band luminosities of these radio-loud AGN are indicative of the black-hole mass of the galaxy via the - correlation (Marconi & Hunt, 2003). The precise scaling is uncertain though, as it is unclear at this stage of the precise contribution from disks to the -band luminosity of the radio-loud AGN in our sample. An accurate derivation of the -band bulge luminosity of all 6dFGS galaxies is beyond the scope of this paper. Accurate velocity dispersions will be measured from spectra of the 15 000 brightest elliptical galaxies in the 6dFGS(Jones et al., 2004). We expect to detect about 30 per cent of these in the NVSS (see Fig. 16). A full analysis of these galaxies will be the subject of a future paper.
8 Conclusion
In this paper we have derived a catalogue of 7 824 radio sources from the NVSS catalogue which have been observed in the 6dFGS DR2 -selected primary sample. The main results of this paper are:
-
•
The median redshift of all radio sources in the sample is , which is similar to that of the 47 317 -band selected galaxies from which the radio sources were selected. 60 per cent of 6dFGS-NVSS primary targets are spectroscopically identified as star-forming galaxies which form a much more nearby population () and 40 per cent of 6dFGS-NVSS primary targets are identified as radio-loud AGN which form a more distant population ().
-
•
Star-forming galaxies and radio-loud AGN have quite distinct distributions in the plane of radio power vs. absolute magnitude. Star-forming galaxies tend to have radio powers W Hz-1, though they have a wide range of absolute magnitudes. The radio-loud AGN span a wide range in radio power but are almost all found in the most luminous near-infrared galaxies with .
-
•
2 690 star-forming galaxies and 208 radio-loud AGN were detected at 60 m in the IRAS Faint Source Catalogue. All of the star-forming galaxies with IRAS-FSC detections in the 6dFGS-NVSS sample are found to lie on the radio-FIR correlation, with average FIR-radio flux ratio parameter with rms scatter , in close agreement with the results of other recent radio-FIR surveys (UGC-NVSS; Condon et al., 2002). Many of the 208 radio-loud AGN with IRAS-FSC 60 detections also lie on the radio-FIR correlation. However, these tend to have hotter IRAS 60-25 m colours. The combination of the radio-FIR correlation and the 60-25 m colour as a means of AGN/Star-forming classification for radio sources agrees with spectroscopic classification for more than per cent of all galaxies, which is reassuring considering the differences in these classification techniques.
-
•
We have measured accurate and homogeneous local radio luminosity functions at 1.4 GHz of star-forming galaxies and radio-loud AGN. The luminosity functions presented here agree well with recent determinations of the local radio luminosity function derived from different optical samples (eg. UGC-NVSS; Condon et al. (2002), 2dFGRS-NVSS; Sadler et al. (2002)).
-
•
The star-formation density at the present epoch has been measured from the 6dFGS-NVSS sample and was found to be M⊙ yr-1 Mpc-3, in agreement with previously derived values at radio and other wavelengths.
-
•
We have split the radio luminosity function of radio-loud AGN into four bins of and compared with the -band luminosity function of all 6dFGS galaxies to calculate a fractional luminosity function . We find that for radio-loud AGN increases strongly as a function of near-infrared luminosity, which in turn is indicative of an increasing probability for a galaxy to host a radio-loud AGN with increasing black-hole mass.
Acknowledgements
We would like to thank the Anglo-Australian Observatory staff at the UK Schmidt Telescope and the entire 6dFGS team for ensuring the success of the 6dFGS. We thank D. Heath Jones for providing early versions of the 6dFGS -band galaxy luminosity function for analysis. We thank the referee for carefully reading the paper and useful comments which improved the final version. This research uses the NVSS radio survey, carried out using the National Radio Astronomy Observatory (NRAO) Very Large Array. The NRAO is a facility of the National Science Foundation operated under cooperative agreement by Associated Universities, Inc. Tom Mauch acknowledges the financial support of an Australian Postgraduate Award. Elaine M. Sadler acknowledges support from the Australian Research Council through the award of an ARC Australian Professorial Fellowship.
References
- Auriemma et al. (1977) Auriemma C., Perola G. C., Ekers R. D., Fanti R., Lari C., Jaffe W. J., Ulrich M. H., 1977, A&Ap, 57, 41
- Becker et al. (1995) Becker R. H., White R. L., Helfand D. J., 1995, ApJ, 450, 559
- Best et al. (2006) Best P. N., Kaiser C. R., Heckman T. M., Kauffmann G., 2006, MNRAS, 368, L67
- Best et al. (2005a) Best P. N., Kauffmann G., Heckman T. M., Brinchmann J., Charlot S., Ivezić Ž., White S. D. M., 2005a, MNRAS, 362, 25
- Best et al. (2005b) Best P. N., Kauffmann G., Heckman T. M., Ivezić Ž., 2005b, MNRAS, 362, 9
- Bock et al. (1999) Bock D. C.-J., Large M. I., Sadler E. M., 1999, ApJ, 117, 1578
- Brinchmann et al. (2004) Brinchmann J., Charlot S., White S. D. M., Tremonti C., Kauffmann G., Heckman T., & Brinkmann J., 2004, MNRAS, 351, 1151
- Brown et al. (2001) Brown M. J. I., Webster R. L., Boyle B. J., 2001, AJ, 121, 2381
- Bruzual & Charlot (1993) Bruzual A. G., Charlot S., 1993, ApJ, 405, 538
- Campbell et al. (2004) Campbell L., Saunders W., Colless M., 2004, MNRAS, 350, 1467
- Cole et al. (2001) Cole S., et al., 2001, MNRAS, 326, 255
- Colless et al. (2001) Colless M., et al., 2001, MNRAS, 328, 1039
- Condon (1989) Condon J. J., 1989, ApJ, 338, 13
- Condon (1992) —, 1992, ARA&A, 30, 575
- Condon et al. (1991) Condon J. J., Anderson M. L., Helou G., 1991, ApJ, 376, 95
- Condon & Broderick (1988) Condon J. J., Broderick J. J., 1988, AJ, 96, 30
- Condon et al. (2002) Condon J. J., Cotton W. D., Broderick J. J., 2002, AJ, 124, 675
- Condon et al. (1998) Condon J. J., Cotton W. D., Greisen E. W., Yin Q. F., Perley R. A., Taylor G. B., Broderick J. J., 1998, AJ, 115, 1693
- Condon et al. (1993) Condon, J. J., Helou, G., Sanders, D. B., & Soifer, B. T. 1993, AJ, 105, 1730
- Cowie et al. (2004) Cowie L. L., Barger A. J., Fomalont E. B., Capak P., 2004, ApJL, 603, L69
- Cram (1998) Cram L. E., 1998, ApJL, 506, L85
- de Grijp et al. (1992) de Grijp M. H. K., Keel W. C., Miley G. K., Goudfrooij P., Lub J., 1992, A&ApS, 96, 389
- Devereux & Eales (1989) Devereux N. A., Eales S. A., 1989, ApJ, 340, 708
- Drake et al. (2003) Drake C. L., McGregor P. J., Dopita M. A., van Breugel W. J. M., 2003, AJ, 126, 2237
- Dunlop & Peacock (1990) Dunlop J. S., Peacock J. A., 1990, MNRAS, 247, 19
- Folkes (1999) Folkes S. o., 1999, MNRAS, 308, 459
- Gallego et al. (1995) Gallego J., Zamorano J., Aragon-Salamanca A., Rego M., 1995, ApJL, 455, L1
- Glazebrook et al. (1995) Glazebrook K., Peacock J. A., Miller L., Collins C. A., 1995, MNRAS, 275, 169
- Griffith & Wright (1993) Griffith M. R., Wright A. E., 1993, AJ, 105, 1666
- Haarsma et al. (2000) Haarsma D. B., Partridge R. B., Windhorst R. A., Richards E. A., 2000, ApJ, 544, 641
- Hambly et al. (2001) Hambly N. C., et al., 2001, MNRAS, 326, 1279
- Helou et al. (1985) Helou G., Soifer B. T., Rowan-Robinson M., 1985, ApJL, 298, L7
- Hopkins & Beacom (2006) Hopkins A. M., Beacom J. F., 2006, arXiv:astro-ph/0601463
- Jackson & Londish (2000) Jackson C. A., Londish D. M., 2000, Publications of the Astronomical Society of Australia, 17, 234
- Jackson & Wall (1999) Jackson C. A., Wall J. V., 1999, MNRAS, 304, 160
- Jarrett et al. (2000) Jarrett T. H., Chester T., Cutri R., Schneider S., Skrutskie M., Huchra J. P., 2000, AJ, 119, 2498
- Jones et al. (2006) Jones D. H., Peterson B. A., Colless M., Saunders W., 2006, MNRAS, 369, 25
- Jones et al. (2005) Jones D. H., Saunders W., Read M., Colless M., 2005, Publications of the Astronomical Society of Australia, 22, 277
- Jones et al. (2004) Jones D. H., et al., 2004, MNRAS, 355, 747
- Kauffmann et al. (2003) Kauffmann G., et al., 2003, MNRAS, 346, 1055
- Laing et al. (1983) Laing R. A., Riley J. M., Longair M. S., 1983, MNRAS, 204, 151
- Large et al. (1981) Large M. I., Mills B. Y., Little A. G., Crawford D. F., Sutton J. M., 1981, MNRAS, 194, 693
- Lawrence et al. (1986) Lawrence A., Walker D., Rowan-Robinson M., Leech K. J., Penston M. V., 1986, MNRAS, 219, 687
- Ledlow & Owen (1996) Ledlow M. J., Owen F. N., 1996, AJ, 112, 9
- Madau et al. (1996) Madau P., Ferguson H. C., Dickinson M. E., Giavalisco M., Steidel C. C., Fruchter A., 1996, MNRAS, 283, 1388
- Madgwick et al. (2002) Madgwick D. S., et al., 2002, MNRAS, 333, 133
- Magliocchetti et al. (2002) Magliocchetti M., et al., 2002, MNRAS, 333, 100
- Marconi & Hunt (2003) Marconi A., Hunt L. K., 2003, ApJL, 589, L21
- Mauch (2006) Mauch T., 2006, Ph.D. Thesis, University of Sydney
- Mauch et al. (2003) Mauch T., Murphy T., Buttery H. J., Curran J., Hunstead R. W., Piestrzynski B., Robertson J. G., Sadler E. M., 2003, MNRAS, 342, 1117
- Moshir et al. (1993) Moshir M., et al., 1993, VizieR Online Data Catalog, 2156
- Nilson (1973) Nilson P., 1973, Uppsala general catalogue of galaxies. Acta Universitatis Upsaliensis. Nova Acta Regiae Societatis Scientiarum Upsaliensis - Uppsala Astronomiska Observatoriums Annaler, Uppsala: Astronomiska Observatorium, 1973
- Nipoti & Binney (2005) Nipoti C., Binney J., 2005, MNRAS, 361, 428
- Norris et al. (1992) Norris, R. P., Roy, A. L., Allen, D. A., Kesteven, M. J., Troup, E. R., & Reynolds, J. E., 1992. In ASP Conf. Ser. 31: Relationships Between Active Galactic Nuclei and Starburst Galaxies, page 71.
- Peebles (1980) Peebles P. J. E., 1980, The large-scale structure of the universe. Research supported by the National Science Foundation. Princeton, N.J., Princeton University Press, 1980. 435 p.
- Rengelink (1998) Rengelink R., 1998, Ph.D. Thesis, Leiden University
- Sadler et al. (2006) Sadler E. M., et al., 2006, MNRAS, submitted
- Sadler et al. (1989) Sadler E. M., Jenkins C. R., Kotanyi C. G., 1989, MNRAS, 240, 591
- Sadler et al. (1999) Sadler E. M., McIntyre V. J., Jackson C. A., Cannon R. D., 1999, Publications of the Astronomical Society of Australia, 16, 247
- Sadler et al. (2002) Sadler E. M., et al., 2002, MNRAS, 329, 227
- Sanders (2004) Sanders D. B., 2004, Advances in Space Research, 34, 535
- Sanders & Mirabel (1996) Sanders D. B., Mirabel I. F., 1996, ARA&A, 34, 749
- Saripalli et al. (2005) Saripalli L., Hunstead R. W., Subrahmanyan R., Boyce E., 2005, AJ, 130, 896
- Saunders et al. (1990) Saunders W., Rowan-Robinson M., Lawrence A., Efstathiou G., Kaiser N., Ellis R. S., Frenk C. S., 1990, MNRAS, 242, 318
- Schechter (1976) Schechter P., 1976, ApJ, 203, 297
- Schmidt (1968) Schmidt M., 1968, ApJ, 151, 393
- Schoenmakers et al. (2001) Schoenmakers A. P., de Bruyn A. G., Röttgering H. J. A., van der Laan H., 2001, A&Ap, 374, 861
- Soifer et al. (1989) Soifer B. T., Boehmer L., Neugebauer G., Sanders D. B., 1989, AJ, 98, 766
- Spergel et al. (2003) Spergel D. N., et al., 2003, ApJS, 148, 175
- Sullivan et al. (2001) Sullivan M., Mobasher B., Chan B., Cram L., Ellis R., Treyer M., Hopkins A., 2001, ApJ, 558, 72
- Tremaine et al. (2002) Tremaine S., et al., 2002, ApJ, 574, 740
- York et al. (2000) York D. G., et al., 2000, AJ, 120, 1579