Radio galaxies in the 2SLAQ Luminous Red Galaxy Survey: I. The evolution of low–power radio galaxies to
Abstract
We have combined optical data from the 2dF-SDSS Luminous Red Galaxy and QSO (2SLAQ) redshift survey with radio measurements from the 1.4 GHz VLA FIRST and NVSS surveys to identify a volume–limited sample of 391 radio galaxies at redshift . By determining an accurate radio luminosity function for luminous early–type galaxies in this redshift range, we can investigate the cosmic evolution of the radio–galaxy population over a wide range in radio luminosity.
The low–power radio galaxies in our LRG sample (those with 1.4 GHz radio luminosities in the range 1024 to 1025 W Hz-1, corresponding to FR I radio galaxies in the local universe) undergo significant cosmic evolution over the redshift range , consistent with pure luminosity evolution of the form (1+)k, where . Our results appear to rule out (at the 6–7 level) models in which low–power radio galaxies undergo no cosmic evolution. The most powerful radio galaxies in our sample (with radio luminosities above 1026 W Hz-1) may undergo more rapid evolution over the same redshift range.
The evolution seen in the low–power radio-galaxy population implies that the
total energy input into massive early–type galaxies from AGN heating
increases with redshift, and was at least 50% higher at
(the median redshift of the 2SLAQ LRG sample) than in the local universe.
keywords:
galaxies: radio continuum — galaxies: luminosity function — galaxies: active — AGN: evolution1 Introduction
The strong cosmic evolution of the most powerful radio galaxies was deduced more than forty years ago from radio source counts (Longair 1966), which imply that the space density of powerful radio galaxies at redshift was roughly a thousand times higher than in the local universe (Doroshkevich, Longair & Zeldovich 1970, Dunlop & Peacock 1990).
Far less is known about the cosmic evolution of the lower–power radio galaxies which comprise the overwhelming majority of the local radio AGN population. Relatively few low–power radio galaxies have been observed at redshifts beyond , partly because classical flux–limited radio surveys like the Cambridge 3CR (Laing, Riley & Longair 1983) and Molonglo MRC (Large et al. 1981) sample only a narrow range in radio luminosity at any given redshift (see e.g. Blundell et al. 2002); but the observed distribution of radio source counts implies that low–power radio sources cannot evolve as rapidly as the most powerful sources do (Longair 1966).
This finding led to the development of two classes of model for the cosmic evolution of radio–loud active galaxies: single-population models, in which the rate of evolution varies with radio power (Dunlop & Peacock 1990), and dual–population models, in which the radio–source population is assumed to be made up of a low–luminosity non–evolving component and a high–luminosity rapidly–evolving component (Jackson & Wall 1999). In the dual–population models, the two populations have been variously been identified with FR I and FR II radio galaxies111Fanaroff & Riley (1974) divided radio galaxies into two classes based on the observed morphology of their radio emission and showed that this morphology correlates with radio luminosity, with the less luminous (FR I) objects having a jet-like appearance and the more luminous (FR II) objects having edge-brightened radio hotspots. Later work (Bicknell 1995) showed that the classification appears to have a physical basis, since FR II radio galaxies have jets which remain relativistic over scales of tens to hundreds of kiloparsec, whereas FR I radio jets rapidly decelerate to sub-relativistic velocities. As a result, models of radio-galaxy evolution often treat FR I and FR II radio galaxies as separate populations which may evolve in different ways. (Wall 1980; later expanded by Jackson & Wall 1999 to include BL Lac objects and flat–spectrum QSOs as the beamed counterparts of FR I and FR II objects respectively); or with objects having weak and strong optical emission lines, independent of their radio morphology (Willott et al. 2001).
Several recent studies imply that low–power radio galaxies (i.e. those with 1.4 GHz radio luminosities near or below the FR I/FR II divide at W Hz-1) undergo little or no cosmic evolution. In the model of Jackson & Wall (1999), which is consistent with both radio source counts and the observed redshift distribution of 3CR sources, there is strong cosmic evolution of FR II radio galaxies but no evolution of the FR I population. Clewley & Jarvis (2004) also found no increase in the comoving density of radio sources with luminosities below P W Hz-1 over the redshift range .
In contrast, Brown, Webster & Boyle (2001) found significant luminosity evolution (of the form , where ) for a sample of low–power radio galaxies over the redshift range . Snellen & Best (2001) found two distant FR I radio galaxies in the small area of sky covered by the Hubble Deep Field; from which they argue that FR I radio galaxies must be significantly more abundant at than in the nearby universe. Willott et al. (2001) also suggest that the comoving space density of low–luminosity radio galaxies rises by about 1 dex between and .
The tight relation between the mass of luminous early–type222Throughout this paper, we use the term “early–type galaxy” to refer to both luminous, passively–evolving distant galaxies (LRGs) and giant E/S0 galaxies in the local universe. galaxies and the mass of their central supermassive black holes (Magorrian et al. 1998) implies that the evolution of galaxies and their central black holes are intimately related. There is also increasing evidence that radio jets can regulate and prevent star formation in luminous early–type galaxies by heating the interstellar gas and stopping the onset of cooling flows (Binney & Tabor 1995; Rawlings & Jarvis 2004; Birzan et al. 2004; Springel, Di Matteo & Hernquist 2005). Since most radio galaxies have radio luminosities well below the FR I/FR II break for most of their lifetimes, improving our understanding of the cosmic evolution of these lower–power radio galaxies is an essential first step in understanding their effects on the star–formation history of massive galaxies. This is particularly important in the context of recent semi–analytic models of galaxy evolution which incorporate AGN heating (e.g. Croton et al. 2006; Bower et al. 2006), as we discuss in §6.4 of this paper.
Previous studies in this area have relied strongly on the analysis of radio source–counts and/or on the use of photometric redshifts to derive distances. However, the most direct and accurate way to measure the cosmic evolution of low–power radio galaxies is to compare the radio luminosity function (RLF) observed at different redshifts. This requires a large volume–limited (rather than flux–limited) sample of radio sources which is reasonably complete over a wide range in radio power. Such samples can now be assembled by combining a large optical redshift survey with a sensitive, large–area radio continuum survey; this technique has been used to measure accurate RLFs for galaxies in the local universe (Sadler et al. 2002; Best et al. 2005a,b; Mauch & Sadler 2006). In this paper, we extend the same technique to higher redshift () by using optical spectra from the 2SLAQ LRG survey (Cannon et al. 2006) and radio data from the VLA FIRST (Becker et al. 1995) and NVSS (Condon et al. 1998) surveys.
Throughout this paper, we use = 70 km s-1 Mpc-1, = 0.3 and = 0.7.
2 The 2SLAQ LRG survey
During 2003–5, the 2SLAQ (2dF–SDSS LRG And QSO) survey used the 2dF multi–object spectrograph on the Anglo–Australian Telescope to obtain optical spectra of over 11,000 luminous red galaxies (LRGs) with -band magnitude 19.8 and redshifts in the range . Full details of the source selection, sample properties and spectroscopic observations are discussed by Cannon et al. (2006), and only a brief outline is given here.

The total co-moving volume sampled by the 2SLAQ LRG survey out to the median redshift of =0.55 is just over 108 Mpc3, i.e. a larger volume than that sampled by the 2dF Galaxy Redshift Survey (2dFGRS; Colless et al. 2001), which covered a larger area of sky to a shallower redshift limit (up to for the most luminous galaxies).
2.1 Colour selection of 2SLAQ LRGs
The 2SLAQ LRG sample was selected using (Fukugita et al. 1996) photometry from the Sloan Digital Sky Survey (SDSS; York et al. 2000) in two narrow strips along the celestial equator covering a total area of about 180 deg2. The colours used for selection were the SDSS extinction-corrected modelMag colours as described by Stoughton et al. (2002), and the colour selection criteria were similar to those used by Eisenstein et al. (2001) to select SDSS LRGs, modified as described by Cannon et al. (2006) to select target objects in the redshift range . A (dereddened) cutoff magnitude of =19.8 was applied along with the cuts in and colour.
Figure 1 shows the colour cuts used to select target 2SLAQ LRGs for the spectroscopic survey. As discussed in detail by Cannon et al. (2006), LRGs whose light is dominated by an old, passively–evolving stellar population are expected to lie along a vertical track in this diagram, with . In this redshift range, the colour of early–type galaxies becomes rapidly redder with increasing as the 4000 break moves through the band, whereas the colour remains almost constant.
The dashed line sloping downward from left to right in Figure 1, defined by setting a constant value of 1.6 for the quantity
is used to separate LRGs from star–forming galaxies, which lie to the left of this line at . The lines sloping upwards from left to right in Figure 1, defined by constant values of
select early–type galaxies at increasingly high redshift for larger values of (Eisenstein et al. 2001; Cannon et al. 2006)
Two main samples of LRGs were observed. The primary sample (Sample 8) consists of objects with at a surface density such that most targets can be accessed in a single pass. This sample has over 90% completeness both spatially and in terms of redshift reliability. A secondary sample (Sample 9) contains mostly lower-redshift objects with ; it is photometrically homogeneous and has high redshift completeness but very variable spatial coverage.
The photometric selection technique worked very successfully; over 90% of the objects observed were LRGs in the target redshift range. As discussed by Wake et al. (2006), these galaxies lie well above the ‘knee’ in the optical luminosity function and have –band luminosities in the range 2–15 L∗.
2.2 2dF spectroscopy
All the 2SLAQ spectra were obtained with the 2dF fibre spectrograph (Lewis et al. 2002), and the observing and reduction techniques are described in detail by Cannon et al. (2006). The wavelength coverage of the 2dF spectra was typically 5000–7250 Å, as shown in Figure 2. In the redshift range targeted by the 2SLAQ survey, the main features seen in the 2dF spectra are the Ca II H and K absorption lines and 4000Å break.

For 2SLAQ galaxies with redshifts above , the H line is shifted out of the 2dF wavelength range and the only observable strong emission line is [O II] 3727Å, which is seen in the spectra of just over 25% of the radio–detected 2SLAQ LRGs. Higher–excitation emission lines of [Ne V] 3426Å and [Ne III] 3870Å are also detected in a few 2SLAQ LRGs (like J092203.20004443.5 in Figure 2), as discussed later in §4.3. The great majority () of radio–detected 2SLAQ LRGs show absorption–line spectra like the galaxy in Figure 2(a), and only a handful have an eA spectrum like that shown in 2(d).
3 Radio source identifications
We adopted a two–step approach similar to that described by Best et al. (2005a) to identify radio sources associated with the 2SLAQ LRGs, using radio–source catalogues from both the VLA FIRST survey (Becker et al. 1995) and the NVSS (Condon et al. 1998)
The FIRST and NVSS radio surveys have complementary properties. NVSS, with a 45 arcsec beam, accurately samples the total flux density of extended radio sources. FIRST, with a 5 arcsec beam, has higher spatial resolution but at the expense of resolving out extended radio emission on scales larger than a few arcseconds (and hence underestimating the total flux density of galaxies with extended radio components). We therefore use the FIRST positions to identify 2SLAQ radio galaxies and the NVSS flux densities to calculate the radio luminosity function.
3.1 Background
The surface density of bright galaxies (B19.5 mag.) is low enough that reliable radio identifications can usually be made from the NVSS survey alone (see e.g. Sadler et al. 2002, Mauch & Sadler 2006). For fainter objects, however, more accurate radio positions are needed. Best et al. (2005a) have developed a multi-stage method using information from both FIRST and NVSS to produce a sample of radio–source IDs with high completeness and reliability, and have used this to identify the radio counterparts of galaxies ( mag.) in the second data release of the SDSS.
Experience shows that the measured radio luminosity function of volume–limited galaxy samples such as the SDSS and 2dFGRS is very robust against small changes in the way the sample is selected. For example, the RLFs measured by Best et al. (2005a) for local AGN and star–forming galaxies agree well with those measured by Sadler et al. (2002) and Mauch & Sadler (2006) even though slightly different radio identification criteria were used in all three investigations.
In this study we use a similar approach to that of Best et al. (2005a), though with some modifications as described below. In particular, we check all our candidate FIRST radio IDs visually on radio–optical overlay plots. This matches the procedure used by Mauch & Sadler (2006) to identify a large sample of radio galaxies from the 6dF Galaxy Survey (Jones et al. 2004), which we use here as the local benchmark to measure the redshift evolution of the radio luminosity function.
We carried out the radio–source identification in three stages:
-
•
Early in the project, we performed a series of tests on the 2003 version of the 2SLAQ LRG input photometric catalogue. This allowed us to estimate both the reliability of the final radio sample and the expected number of extended double and multiple radio sources, as described in §3.2.1.
-
•
Once the 2SLAQ spectroscopic observations were complete, we cross-matched the final spectroscopic catalogue with the FIRST survey. This allowed us to identify a sample of 367 2SLAQ LRGs associated with FIRST radio sources (see §3.3.1).
-
•
We also cross-matched the 2SLAQ LRG spectroscopic catalogue with the NVSS catalogue as discussed in §3.3.2. This allowed us to identify six very extended radio sources with angular sizes greater than 1 arcmin, as well as 22 weak radio sources which were not listed ∈the FIRST catalogue. The NVSS catalogue provides accurate total flux densities for most of the sources identified in the FIRST catalogue.
3.2 Tests using the 2SLAQ LRG photometric catalogue
3.2.1 Radio–source identification
Of the 70,582 galaxies listed in the 2003 2SLAQ LRG input photometric catalogue, 60,290 (85%) lay within the region of sky covered by the FIRST radio catalogue. We checked for possible matches of these galaxies with FIRST radio sources, using a 30 arcsec maximum offset between the radio and optical positions (because both our own tests and the study by Best et al. (2005a) showed that only a handful of genuine radio IDs are expected at larger separations). For the redshift range covered by the 2SLAQ LRGs (), 30 arcsec corresponds to a projected linear distance from the optical galaxy of 160–220 kpc. The few radio galaxies with radio lobes more distant than this are best identified in the lower-resolution NVSS images as discussed below.

A total of 2,782 of the LRGs in the input catalogue (4%) had one or more FIRST radio sources within 30 arcsec of the optical position, and so were candidate radio galaxies. We repeated the matching process using a set of ‘random’ positions offset by 10 arcmin from the position of each galaxy in the 2SLAQ input catalogue. This Monte Carlo test allows estimation of the number of unrelated foreground or background radio sources which are seen by chance. Figure 3 plots the number of sources seen in 2SLAQ and random fields as a function of the offset between radio and optical positions. Note that the vertical axis is logarithmic, so the excess of sources at separations arcsec is very large. As expected, the number of matched sources approaches the value expected by chance for offsets larger than about 20 arcsec.
The population of FIRST radio sources within 30 arcsec of a 2SLAQ LRG will be
a mixture of the following:
(a) Single radio sources which are genuinely associated with a 2SLAQ
galaxy.
(b) Components of double or triple radio sources which are genuinely associated with a 2SLAQ galaxy.
(c) Unrelated foreground or background radio sources. The likely numbers of such objects
can be estimated from Monte Carlo tests.
(d) Components of single, double or triple radio sources associated
with neighbouring galaxies at the same redshift as the 2SLAQ galaxy.
For each 2SLAQ LRG with a candidate radio source within 30 arcsec,
we overlaid radio contours from the FIRST survey onto greyscale optical
images (taken mainly from
the SDSS DR3, with a small number from the SuperCOSMOS images). These overlays were
then inspected by at least two team members, who flagged each candidate source as
‘accept’ or ‘reject’ based on the following guidelines:
(i) All sources less than 3.0 arcsec from a 2SLAQ galaxy were accepted as genuine IDs.
(ii) A single FIRST source separated by 3–10 arcsec from a 2SLAQ galaxy is
accepted as an ID if (a) it is spatially resolved and extended in the direction of the
optical galaxy, (b) the separation is no larger than the projected major axis of the radio
source, and
(c) no other optical object closer to the radio position is visible on the overlay images.
(iii) Two FIRST components of similar flux density are accepted as IDs if the
optical galaxy lies within 5.0 arcsec of the radio centroid (unless another optical object
is closer).
(iv) Where three or more FIRST components are present, a decision on whether each is associated
with the optical galaxy is based on visual inspection alone.
3.2.2 The effects of clustering
Of the 2,871 FIRST matches with the 2SLAQ input photometric catalogue, 1602 (56%) were classified as genuine associations with 1362 2SLAQ galaxies. This corresponds to a radio detection rate of 2.3% for the 2003 2SLAQ input catalogue. Of the accepted radio galaxies, 87% had a single FIRST component, 10% were doubles and 3% were resolved into three or more FIRST components. Our Monte Carlo tests imply that the excess of ‘real’ over ‘random’ sources in this sample should be roughly 175040. This is significantly higher than the 1602 sources we accepted as genuine associations with 2SLAQ galaxies, and at first glance might suggest that we have failed to recognize up to 150 genuine matches of FIRST radio sources with galaxies in the 2SLAQ input catalogue.
However, as noted by Best et al. (2005a), Monte Carlo tests will not give a reliable estimate of completeness if the 2SLAQ galaxies are strongly clustered. If the overall space density of galaxies is higher in the vicinity of a 2SLAQ LRG, then the probability of finding a radio source within 30 arcsec of the LRG will also be higher. For the 2003 2SLAQ input catalogue, we have a statistical excess of 14840 radio sources which are not identified with 2SLAQ galaxies but also cannot be explained by chance associations of foreground or background objects. If these excess radio sources are associated with LRGs which are clustered near 2SLAQ galaxies but fall below the magnitude cutoff of the 2SLAQ catalogue, and if we assume the same 2.3% radio detection rate for these slightly fainter LRGs as for the 2SLAQ galaxies, we would require an excess of about 6500 LRGs within 30 arcsec of a 2SLAQ LRG. This in turn implies that 11% of 2SLAQ LRGs have another LRG within 30 arcsec on the sky (a projected separation of 190 kpc for redshift =0.55), which is consistent with the observed level of clustering in the 2SLAQ LRG sample (Ross et al. 2006).
3.3 Identification of radio galaxies in the 2SLAQ spectroscopic catalogue
3.3.1 Cross-matches with the FIRST and NVSS radio–source catalogues
The 2SLAQ LRG input catalogue was revised and expanded in 2004, so the final LRG spectroscopic sample is not a simple subset of the 2003 input catalogue discussed above. We therefore repeated the matching process described in §3.2.1 for the 14,978 galaxies in the final spectroscopic LRG sample. The overlap with the FIRST survey area was significantly higher for the final spectroscopic catalogue (96.5%) than for the 2003 input catalogue (85%), giving us near–complete radio data for the spectroscopic sample333The fraction of galaxies with Galactic latitude is significantly lower in the final spectroscopic catalogue than in the 2003 input catalogue. Since the FIRST survey has incomplete coverage of regions within 20 degrees of the Galactic Plane, its overlap with the final spectroscopic catalogue is correspondingly higher than the 85% overlap with the 2003 input photometric catalogue..
The lower–resolution NVSS is more sensitive to large–scale radio emission than the FIRST survey, and so provides a better measure of the total flux density of extended radio sources (Condon et al. 1998). We independently cross-matched the 2SLAQ spectroscopic catalogue with the NVSS, both to measure more accurate total flux densities for sources identified through matching with FIRST and also to search for extended or low surface–brightness radio sources which might have been missed in the FIRST survey.
Following Best et al. (2005a), we searched for NVSS radio components within 3 arcmin of the optical position of each LRG. This search radius is large enough to include both lobes of any extended or multi-component radio galaxy, but smaller than the 10 arcmin separation typical of unrelated NVSS sources. It is important to note, however, that the probability of finding an unrelated NVSS source within 3 arcmin of an arbitrary position on the sky is high (30%, see Fig. 6 of Condon et al. 1998), and even the probability of finding two unrelated sources within 3 arcmin is 10%.
Of the 14,978 galaxies in the final LRG spectroscopic catalogue, 4378 had a single NVSS source within 3 arcmin of the optical position, and a further 1316 had two or more NVSS sources within 3 arcmin. We excluded all the single-component matches with offsets larger than 30 arcsec, since Mauch & Sadler (2006) found that genuine matches of nearby galaxies with a single NVSS source all have radio–optical separations smaller than 30 arcsec. This left 375 candidate single-component NVSS matches in addition to the 1316 candidate multi-component matches.

We checked all the candidate NVSS identifications by visually inspecting overlays of FIRST and NVSS radio contours onto optical images of each galaxy (since the FIRST contours usually allow us to unambiguously identify the host galaxy of a candidate NVSS radio source). This visual inspection yielded a list of 322 2SLAQ LRGs which appeared to be genuinely associated with one or more NVSS radio sources. 271 of these galaxies were already identified with FIRST radio sources; but the remaining 51 galaxies had no corresponding source in the FIRST catalogue, and are discussed in §3.3.2 below.
The NVSS matching process allowed us to identify additional radio components, offset more than 30 arcsec from the 2SLAQ galaxy position, for several 2SLAQ LRGs which had already been matched with FIRST sources. One of these, J003754.59002717.4, is shown in Figure 4 and is a newly-discovered giant radio galaxy with a linear size of 2.0 Mpc. Only the relatively weak central component of this source was identified in our original FIRST matching, but the two radio hotspots, each more than 2 arcmin from the 2SLAQ position, were easily found by inspection of the NVSS overlay plot.

3.3.2 Comparison of 1.4 GHz flux densities measured by NVSS and FIRST
Figure 5 compares the total NVSS and FIRST flux densities for 2SLAQ LRGs which were detected in both radio surveys. Note that for sources weaker than about 10 mJy, the catalogued FIRST flux densities tend to be systematically lower than those measured by NVSS, mostly due to the radio emission of extended sources being resolved out by the smaller FIRST beam (Becker et al. 1995; Ivezic et al. 2002).
As noted above, our NVSS cross-matching identified a further 51 candidate NVSS identifications of 2SLAQ LRGs which were not matched with radio sources in the FIRST catalogue. While these could be variable radio sources, it is more likely that at the higher resolution of the FIRST survey their peak surface brightnesses fall below the 1 mJy/beam limit of the FIRST catalogue. Three of these objects are associated with wide double sources which are listed in the FIRST catalogue but have no catalogued FIRST components within 30 arcsec of the 2SLAQ galaxy. Many of the remaining objects have a weak radio source at the 2SLAQ position which is visible in the FIRST survey image but too faint to be listed in the FIRST catalogue. As noted in §3.1, the identification of distant LRGs with faint radio sources cannot be done reliably using NVSS data alone. Of the 51 NVSS radio identifications without a FIRST catalogue match, we therefore chose to accept as genuine IDs the 22 galaxies which had a weak source visible in FIRST images at (where is the local rms noise level in the FIRST image), and within 3 arcsec of the optical 2SLAQ position. This is a conservative approach aimed at maximizing the reliability of our 2SLAQ radio IDs, and we recognize that it may have a small effect on the completeness of our radio sample, as discussed in §3.5.2.
3.3.3 Statistics of the radio matches
| Selection | Sample 8 | Sample 9 | All |
|---|---|---|---|
| All objects | 10072 | 3977 | 14978 |
| Reliable redshift (Q3) | 9307 | 3607 | 13784 |
| Median | 0.55 | 0.47 | 0.52 |
| Median M0.2,r (mag.) | |||
| Effective area (deg2) | 141.7 | 93.5 | |
| FIRST coverage | 98.3% | 95.5% | 96.5% |
| Radio detections: all | 303 | 71 | 391 |
| Reliable redshift (Q) | 292 | 70 | 378 |
| Radio detection rate | 3.1% | 1.9% | 2.7% |
Tables 1 and 2 summarise the results of matching the LRGs in the 2SLAQ spectrocopic sample with the NVSS and FIRST radio catalogues. The overall radio detection rate for LRGs in the spectroscopic sample is close to 3%; but is significantly higher for the galaxies in Sample 8 (%) than for those in Sample 9 (%).
The difference in radio detection rates is related to the higher median redshift of the Sample 8 LRGs compared to those in Sample 9, and a plot of radio detection rate versus redshift shows a smooth rise in detection rate from about 1.4% at to 3.6% at and above. The detection rate increases with redshift because radio galaxies are preferentially found in the most massive (and luminous) LRGs (see §4.2 of this paper). Because of the apparent magnitude limit of the 2SLAQ sample, these very luminous LRGs make up an higher fraction of the 2SLAQ galaxies as the redshift increases.
| No. of FIRST | No. of | % of total |
| components | galaxies | |
| Uncatalogued | 22 | 6% |
| 1 | 317 | 81% |
| 2 | 36 | 9% |
| 3 | 9 | 2% |
| 4 | 3 | 1% |
| 5+ | 4 | 1% |
| Total | 391 |
3.4 The final radio data table
Table 3 lists the 391 2SLAQ galaxies identified with catalogued FIRST and/or NVSS radio sources. The columns of Table 3 are as follows:
-
(1)
The 2SLAQ name, set by the J2000 co-ordinates of each galaxy.
-
(2)
The 2SLAQ sample to which the galaxy belongs (see Figure 1 and Cannon et al. 2006).
-
(3)
The dereddened -band () apparent magnitude from SDSS photometry. The 2SLAQ spectroscopic LRG catalogue has a magnitude cutoff of mag.
-
(4)
The optical position (J2000.0) at which the 2dF fibre was placed.
-
(5)
The radio position, taken from the FIRST catalogue for single sources. For radio sources with more than one FIRST component, the position given is the radio core (if visible) or the flux–weighted radio centroid.
-
(6)
The peak radio flux density at 1.4 GHz (in mJy), from the FIRST catalogue (Becker et al. 1995).
-
(7)
The total 1.4 GHz flux density from the FIRST catalogue. For extended and multiple radio sources with more than one entry in the FIRST catalogue, the flux density quoted here is the sum of all the components.
-
(8)
The number of FIRST radio components associated with each 2SLAQ galaxy.
-
(9)
The total 1.4 GHz flux density from the NVSS catalogue. For radio sources with more than one NVSS component, the flux density quoted here is the sum of all the components. A handful of sources had a single NVSS component and two FIRST components, only one of which is genuinely associated with the 2SLAQ galaxy. In this case, the listed NVSS flux density of these sources was reduced in proportion to the flux–density ratio of the associated and unassociated FIRST components.
-
(10)
The error on the total NVSS flux density.
-
(11)
The number of NVSS radio components associated with each 2SLAQ galaxy.
-
(12)
The heliocentric redshift measured from 2SLAQ optical spectra.
-
(13)
The 2dF redshift quality code Q, where Q=4 or 5 are excellent–quality redshifts (99% reliable), Q=3 is acceptable (95% reliable) and Q=0, 1 or 2 indicates a poor–quality or highly-unreliable redshift. Galaxies with Q3 were excluded from further analysis because their redshifts are highly uncertain.
-
(14)
The extinction–corrected –band absolute magnitude M0.2,r for each galaxy, calculated using the method described by Wake et al. (2006). This incorporates both a -correction and a further correction for the passive evolution of the stellar population, and represents the absolute magnitude which each LRG would have if observed through a standard SDSS -band filter redshifted to .
-
(15)
The total radio luminosity at 1.4 GHz, calculated by assuming a mean spectral index (where flux density S) and the usual -correction of the form .
-
(16)
Notes on individual galaxies.

3.5 Reliability and completeness of the final radio sample
3.5.1 Reliability
The great majority of the galaxies in Table 3 (81%) are associated with single–component FIRST sources, and Monte Carlo tests show that these can be identified with a high degree of reliability (fewer than 1% will be chance associations of unrelated objects). For galaxies with multiple FIRST components, which are accepted on the basis on visual inspection, the reliability should also be high (Best et al. (2005a) assumed their visual analysis to be 100% reliable). We therefore estimate that the reliability of our final 2SLAQ radio sample is at least 98%, similar to the overall reliability of 98.9% quoted by Best et al. (2005a) for their lower–redshift SDSS sample.
3.5.2 Completeness
In assessing the overall completeness of our final radio sample, we need to examine the completeness of both the optical and the radio samples. Only a subset of the 2SLAQ LRG photometric catalogue was observed spectroscopically, but we can account for this by calculating the effective area of sky covered by the 2dF spectroscopic sample as described in §5.1. For the luminosity function calculations presented in §5, the only remaining incompleteness on the optical side comes from the small fraction of galaxies for which the measured redshift is unreliable (i.e. objects with Q2 in Table 3). Of the radio–detected LRGs in Table 1, 378/391 have a reliable 2dF redshift so the spectroscopic incompleteness of our sample is about 3%.
On the radio side, the NVSS catalogue is essentially complete for radio sources with flux densities above 2.8 mJy, as can be seen from Figure 32 of Condon et al. (1998). This is supported by the number counts of 2SLAQ radio sources shown in Figure 6, which account for roughly 5% of all 1.4 GHz radio sources in the flux–density range 2.8–500 mJy based on the source counts presented by Hopkins et al. (2003). Below the NVSS completeness limit of 2.8 mJy the number counts in Figure 6 start to fall off and our radio sample becomes seriously incomplete, reflecting the well-known incompleteness of the FIRST catalogue for faint, extended radio sources.
Our decision to reject candidate NVSS IDs for which we could find no corresponding source at the 3 level in the FIRST images (see §3.3.2) may also affect the completeness level of our final sample. If all 15 of the rejected NVSS objects with flux density above 2.8 mJy are actually genuine IDs and should have been included in our sample, this would represent a radio incompleteness of 2%.
As discussed in §5, we set a radio flux–density limit of 2.8 mJy in our calculation of the radio luminosity function. If the NVSS catalogue is essentially complete above this limit, then the overall incompleteness of our 2SLAQ radio sample is roughly 5% (i.e. 3% spectroscopic incompleteness, plus up to 2% incompleteness in the radio catalogue) for sources with radio flux densities above 2.8 mJy. We therefore estimate that our sample of 2SLAQ radio galaxies is at least 95% complete and 98% reliable down to the magnitude and flux–density limits used for the luminosity function calculations in §5.
4 Characteristics of the LRG radio–galaxy population
4.1 Physical mechanisms for the radio emission
In the 2SLAQ redshift range (), even the weakest radio sources in the FIRST and NVSS catalogues will have radio luminosities above 1024 W Hz-1. In the local universe, radio sources above this level are almost invariably associated with active galactic nuclei (AGN) rather than star–forming galaxies (Condon 1992; Sadler et al. 2002; Best et al. 2005a). Since the photometric selection of the 2SLAQ LRG sample also excludes galaxies with ongoing star formation, we expect all the radio galaxies identified in Table 3 to be powered by an AGN.
| Absolute mag. | All 2SLAQ | Radio-det. | Radio det. |
|---|---|---|---|
| M0.2,r | LRGs | LRGs | rate (%) |
| to | 8 | 0 | 0.0 |
| to | 71 | 0 | 0.0 |
| to | 514 | 1 | 0.2 |
| to | 2870 | 26 | 0.9 |
| to | 4271 | 143 | 3.3 |
| to | 2063 | 140 | 6.8 |
| to | 429 | 54 | 12.6 |
| to | 35 | 9 | 25.7 |
| to | 4 | 2 | 50.0 |
| Total | 10265 | 375 | |
| Median M0.2,r | |||
| (3.7 L∗) | (5.3 L∗) |
4.2 Redshift and luminosity distribution
The radio galaxies in the 2SLAQ LRG sample are significantly more luminous than the 2SLAQ LRG sample as a whole, as can be seen from Table 4. This is not unexpected, since the probability that an early–type galaxy will be a radio galaxy is known to rise sharply with optical luminosity (Auriemma et al. 1977; Sadler, Jenkins & Kotanyi 1989, Best et al. 2005b).
Figures 7 and 8 show that the 2SLAQ radio sample is close to volume–limited, with no strong correlation between either absolute magnitude or radio luminosity and redshift. In particular, Figure 7 shows that the mean redshift of the 2SLAQ radio galaxies is almost independent of their radio luminosity, making this an excellent sample for measuring the radio luminosity function. The smaller number of low–power ( W Hz-1) radio galaxies at redshifts above is due to the flux–density limit of the NVSS and FIRST catalogues, and causes the mean redshift to drop slightly at the lowest radio luminosities. This flux limit is taken into account when calculating the radio luminosity function, and so does not affect the sample completeness.

Figure 8 shows the relatively sharp cutoff in absolute magnitude M0.2,r caused by the mag. cutoff of the 2SLAQ LRG sample. Although the 2SLAQ LRGs span a wide range (almost three orders of magnitude) in radio luminosity, their range in optical luminosity is much narrower, corresponding to only one order of magnitude (roughly 2–20 L∗).
Since Wake et al. (2006) find no evolution in the number density of these bright LRGs over the redshift range beyond that expected from the passive evolution of their stellar population, it is straightforward to match the 2SLAQ sample with local early–type galaxies of similar luminosity in order to study the evolution of their radio properties.

4.3 Optical emission lines
4.3.1 The fraction of galaxies with optical emission lines
We visually inspected all the spectra of radio–detected 2SLAQ galaxies to check for the presence of optical emission lines. Where seen, this is noted in Table 3. In most cases the only detected emission line is [O II] at 3727Å, which is seen in 27% of 2SLAQ radio galaxies. Thus, like most low–power radio galaxies in the local universe (Owen, Ledlow & Keel 1995), the majority of 2SLAQ radio galaxies do not show strong optical emission lines and would not have been recognized as AGN on the basis of their optical spectra alone.
4.3.2 [O II] emission
The 3727Å [O II] emission line can be excited both by star–forming regions and by an AGN; but it can also occur when neither of these is present, through photoionization by the old, hot post–AGB stars which should exist in all luminous early–type galaxies (Bressan et al. 1994). As a result, detection of the [O II] line alone gives little or no useful information about either the ionization state of the gas or the dominant physical process responsible for ionizing it.
Measurement of the observed ratios of other common emission lines such as H, H, [O III] and [N II] (e.g. Veillueux & Osterbrock 1987) can distinguish star–forming galaxies from those in which the gas is ionized by an AGN, but such measurements are not possible for most of the LRGs in our 2SLAQ sample because the relevant emission lines are redshifted out of the 2dF spectral range.
4.3.3 [Ne III] and [Ne V] emission lines
Thirteen of the galaxies in Table 3 (3.4% of the radio sample) show both strong [O II] emission lines and weaker emission lines of [Ne III] 3869 Å and/or [Ne V] 3426 Å, as seen in Figure 2(c). The presence of these additional high–excitation emission lines strongly suggests that the dominant ionizing source in these particular galaxies is an active nucleus.
The fraction of radio–detected LRGs with detected [Ne III] and [Ne V] emission lines, though low, is significantly higher than in the 2SLAQ LRG sample as a whole. We estimate that only of a sample of 744 good–quality 2SLAQ LRG spectra show visible [Ne III] and [Ne V] emission lines, so the line is roughly eight times more common in the radio–detected subsample than in the LRG population as a whole. We stress once again, however, that the majority of the low–power radio galaxies in the 2SLAQ sample are optically ‘normal’ and do not show strong optical emission lines in their spectra.
4.3.4 Comparison with the full 2SLAQ LRG sample
As noted by Roseboom et al. (2006), the relatively low S/N of the 2SLAQ spectra makes it difficult to measure the equivalent widths of weak emission lines accurately. They therefore used a cutoff in [O II] emission–line equivalent width of 8 Å to define an emission–line LRG, and found that 15% of the 2SLAQ LRGs lay above this cutoff.
Our visual classification of emission–line galaxies in Table 3 selects objects with almost exactly the same range in [O II] equivalent width as the ‘em’ and ‘em+a’ galaxies discussed by Roseboom et al. (2006). For a sample of 162 galaxies in common, 24/26 (92%) of the Roseboom et al. (2006) objects with [O II] EW8.0Å are listed by us as having [O II] emission, compared to only 11/136 (8%) of the EW 8.0Å objects. If we drop the equivalent width cutoff to 7.0 Å, the agreement is even better, with 93% of galaxies above the cutoff and only 5% of those below the cutoff classifed in Table 3 as showing [O II] emission.
The fraction of galaxies with [O II] emission in the full sample of 5,697 2SLAQ LRGs measured by Roseboom et al. (2006) is 15.1% if we adopt an EW cutoff of 8 Å, and 17.7% for an EW cutoff of 7 Å. This is lower than the 27% [O II] detection rate for the 2SLAQ radio galaxies in Table 3, but the difference needs to be assessed carefully. The emission–line luminosity of elliptical and S0 galaxies correlates with absolute magnitude, in the sense that luminous galaxies are more likely than smaller galaxies to show emission lines in their spectra (Phillips et al. 1986). To compare the emission–line properties of 2SLAQ radio galaxies with those of the full LRG sample therefore, we need to compare sets of objects which are carefully matched in optical luminosity. Such a comparison is outside the scope of the present paper, but will be included in a later paper in this series.
5 The radio luminosity function at of Luminous Red Galaxies at z=0.4 to 0.8
5.1 Area covered by the 2SLAQ spectroscopic survey
As discussed by Cannon et al. (2006), the spectroscopic coverage of the 2SLAQ LRG sample is not uniform and has both overlapping fields and gaps on the sky. Determining the total area of sky covered by the 2SLAQ spectroscopic sample is therefore a necessary first step in measuring the radio luminosity function.
Cannon et al. (2006) estimated the effective area of the 2SLAQ LRG spectroscopic survey as 135 deg2 for Sample 8 and 90 deg2 for Sample 9, based on the number of galaxies observed and their surface density on the sky. Since an accurate measurement of effective area is crucial to the normalization of the measured radio luminosity function, we have recalculated the 2SLAQ LRG survey area using the same methodology applied by Wake et al. (2006) to calculate the optical luminosity function for the 2SLAQ LRGs.
Both the completeness and the area were calculated using a mask which is constructed by repeatedly running the 2dF ‘configure’ program on a random distribution of points in one field. This creates a random catalogue of roughly 5 million points, with a distribution covering all the possible positionings of a 2dF fibre. A random catalogue for the entire survey was then constructed by placing this single random 2df field distribution at every field centre which was observed in the survey. Regions which are not in the input catalogue were removed, since the edges of some of our fields lay outside the region covered by the input catalogue. This final random catalogue contained about 400 million data points.
The final mask was based on a grid with 3030 arcsec pixels covering the whole survey area. Those pixels which contained at least one random point were flagged, and the mask was used to calculate both the area and the completeness. To calculate the area, we simply summed the pixels which were flagged as containing a random point; this yielded a total area of 186.2 deg2. To determine the completeness, we divided the number of LRGs with a redshift in the masked region by the number of LRGs from the input catalogue in the masked region. This allows calculation of the effective area for each spectroscopic sample, which is simply the total area multiplied by the completeness. For galaxies with spectra whose quality is good enough to measure a reliable redshift (Q3), we calculate an effective area of 141.7 deg2 for Sample 8 and 93.5 deg2 for Sample 9. These are roughly 4–5% higher than the values estimated by Cannon et al. (2006).
In this study, we must also account for the small fraction of the 2SLAQ survey area (mostly at low Galactic latitude) for which radio data from the FIRST survey are not available. For the 2SLAQ spectroscopic sample, 1.7% of galaxies in Sample 8 and 4.5% of galaxies in Sample 9 lie outside the region of sky covered by the FIRST source catalogue. The smaller overlap between FIRST and Sample 9 is because more of the Sample 9 fields are at lower galactic latitude than the region covered by FIRST. After accounting for the area not covered by FIRST, we have a final effective area of 139.3 deg2 and 89.3 deg2 for Samples 8 and 9 respectively.
5.2 Calculation of the radio luminosity function
We derived the radio luminosity function for 2SLAQ LRGs by applying the method (Schmidt 1968) to the 251 2SLAQ LRGs which belong to Sample 8 or 9 and have a 1.4 GHz flux density of 2.8 mJy or more. We calculated for each object using the maximum and minimum redshift limits at which each object could be placed and still satisfy both the optical and radio selection criteria of our sample. The upper and lower redshift limits set by the optical colour and magnitude cutoffs for the 2SLAQ sample were calculated using the same method as Wake et al. (2006) for their calculation of the optical luminosity function, while the radio upper limits were set by the redshift at which each source fell below the 2.8 mJy flux limit (there is no lower redshift limit for our radio selection criteria). The value of adopted for the th sample galaxy is:
| (1) |
where is the effective area of samples 8 and 9 in steradians as listed in Table 1, and and are the (all-sky) volumes enclosed by upper and lower redshift limits and . Table 5 lists the radio luminosity function which we measured for 2SLAQ LRGs in the redshift range .
| Local AGN: M | 2SLAQ LRG | |||
| L1.4 | N | N | ||
| (W Hz-1) | (mag-1 Mpc-3) | (mag-1 Mpc-3) | ||
| 23.6 | 328 | |||
| 24.0 | 255 | |||
| 24.4 | 178 | 61 | ||
| 24.8 | 80 | 102 | ||
| 25.2 | 49 | 52 | ||
| 25.6 | 15 | 22 | ||
| 26.0 | 3 | 9 | ||
| 26.4 | 2 | 3 | ||
| 26.8 | 1 | |||
| 27.2 | 1 | |||
| V/V | 0.5190.006 | 0.4550.018 | ||
5.3 Evolution of the radio–galaxy population to 0.7
5.3.1 Comparison with the local radio–galaxy population
We can now determine the evolution of the radio–galaxy population out to by comparing the 2SLAQ radio luminosity function with the RLF of similar galaxies in the local universe. For our local benchmark, we need a large, uniform survey which covers a large volume at (so that evolutionary effects within the sample volume can be neglected).
We chose to use as our comparison sample the large dataset of nearby radio galaxies identified by Mauch & Sadler (2006) from the second data release of the 6dF Galaxy Survey (6dFGS; Jones et al. 2004). The 6dFGS DR2 contains spectra of about 45,000 galaxies brighter than K=12.75 mag. in the near–infrared K–band, and the 6dFGS radio galaxies identified by Mauch & Sadler span the redshift range with a median redshift of 0.073. The large sample volume ( Mpc3) and shallow depth of the 6dFGS survey allow us to derive an accurate radio luminosity function with which to compare our 2SLAQ results.
We note that passive evolution of the optical luminosity function of luminous red galaxies over the redshift range has little effect on the results of this study, since radio galaxies are known to be almost exclusively associated with the most massive and luminous galaxies at all redshifts out to (Rocca–Volmerange et al. 2004). However, we have corrected the optical luminosities of the 2SLAQ galaxies to their equivalent value at using the same correction factors for passive evolution as Wake et al. (2006) The values of M0.2,r for 2SLAQ LRGs in this paper should differ by less than 0.1 mag from the M(r) values measured for similar galaxies at .
Since the 2SLAQ LRG sample effectively excludes galaxies with absolute magnitudes fainter than M, we also chose to compare the 2SLAQ RLF with a local RLF calculated for a sample with a similar cutoff in optical luminosity. The optical luminosity function for 6dFGS galaxies (Jones et al. 2006) has M=21.0 mag. and M=23.8 mag., so we adopted a cutoff in absolute magnitude of M mag. (i.e. one magnitude brighter than M) for our local sample in order to match the luminosity cutoff of the 2SLAQ sample as closely as possible. In practice, since the probability that an early–type galaxy will be a radio galaxy rises very sharply with optical luminosity, this luminosity cut has almost no effect on the measured RLF for local galaxies — only six of the 337 6dFGS radio galaxies with radio luminosities P W Hz-1 are excluded by our cutoff in MK.

Figure 9 compares the 6dFGS and 2SLAQ RLFs for the range in radio luminosity for which they overlap. The 2SLAQ RLF is higher than the local value at all luminosities, but the difference is most striking for the most powerful radio galaxies in our sample. This can be seen more clearly in Figure 10, which plots the ratio of the space densities of 2SLAQ and 6dFGS radio galaxies. Figure 10 strongly suggests that low–power radio galaxies undergo cosmic evolution, though their evolution is less dramatic than that seen in powerful radio galaxies.

5.3.2 The redshift evolution of low–power radio galaxies
The redshift evolution of a galaxy population can be investigated by comparing the measured luminosity function of the same population at two or more epochs. Any shift in the luminosity function is usually represented by one of two simple extremes: luminosity evolution, in which the luminosity functions are matched by shifting one of them horizontally; and density evolution, in which the shift is vertical. These alternatives are equally plausible for a pure power–law luminosity function, but can in principle be distinguished if the luminosity function undergoes a change in slope at some luminosity.
As noted by Peacock (1999) the physical motivation for either of these descriptions is weak. Both luminosity and density evolution assume that the overall shape of the luminosity function remains the same at all epochs, which may not be the case. Luminosity evolution suggests a population whose overall luminosity declines with time, while density evolution implies a set of objects which have constant luminosity but a range of lifetimes. It is likely that neither of these simple models completely describes the physical processes which actually occur. Our main goal in this paper, however, is to determine whether low–power radio galaxies evolve with redshift and even a simple parameterization of the luminosity function is an adequate tool for testing this.
To quantify the evolution of low–power radio galaxies, we follow earlier studies in assuming that the redshift dependance can be represented by pure luminosity evolution of the form
(Boyle et al. 1988). We then find the best-fitting value for by dividing the radio power of each galaxy by for and minimising the value from the rebinned local and 2SLAQ RLFs for each . Error estimates are determined by computing the value of for which , which is equivalent to (Lampton, Margon, & Bowyer 1976). The fit of was only made for W Hz-1 to avoid contamination by the more strongly–evolving high–power radio galaxies in the 2SLAQ sample. The best fitting value for is , which implies that low–power radio galaxies in the redshift range probed by the 2SLAQ sample are significantly more luminous than those in the local sample. The hypothesis that low–power radio galaxies undergo no cosmic evolution can be ruled out at the 6.7 level. Figure 11 shows the 6dFGS and 2SLAQ RLFs shifted to redshift =0 assuming the fitted form for the evolution.

In summary, we find that low–power radio galaxies with P W Hz-1 undergo significant cosmic evolution over the redshift range . Our observations are consistent with these low–power radio galaxies undergoing pure luminosity evolution of the form (1+)k where . This is close to the value of found by Hopkins (2004) for the luminosity evolution of the radio emission from star–forming galaxies over a similar redshift range.
5.3.3 The redshift evolution of powerful radio galaxies
Although the number of powerful radio galaxies in our 2SLAQ sample is relatively small, there is some evidence that they undergo more dramatic evolution than their lower–power counterparts. Figure 10 implies that the number density of the most powerful (P W Hz-1) radio galaxies in our sample could be at least ten times higher at than in the local universe, though this is highly uncertain because of the small number of objects observed in this luminosity range. The 6dFGS radio–galaxy sample covers a volume of Mpc3, i.e. almost four times the 2SLAQ volume, but has only four galaxies with radio luminosity above 1026 W Hz-1, whereas the smaller 2SLAQ volume contains at least ten radio galaxies more powerful than W Hz-1. We therefore stress that the small number of powerful radio galaxies seen at low redshift is not a volume effect.
If we assume the same luminosity evolution of the form (1+)2 which fits the low–power sample, then the observation of four P W Hz-1 radio galaxies in the 6dFGS volume implies that we would expect to see 1.23 radio galaxies with P W Hz-1 in the 2SLAQ sample volume. Five are actually observed, so Poisson statistics imply a probability of 0.7% that the difference is due to chance. If we also take into account the formal uncertainty in the four high–power 6dFGS sources, then the significance level drops to 3–4%. The small number of very powerful radio galaxies in the 6dFGS and 2SLAQ samples therefore limits what we can say about their cosmic evolution at this stage. We note however that the observed number of powerful ( W Hz-1) radio galaxies in the 2SLAQ sample is consistent with a population undergoing the kind of rapid density evolution reported by Willott et al. (2001), who found an increase of 3 dex in the space density of the most powerful radio galaxies over the redshift range . This implies a number density increasing as approximately , i.e. ten times as many radio galaxies at powers above 1026 in the 2SLAQ sample at as in the 6dFGS at , which is close to the value seen in Figure 10.
6 Discussion
6.1 Environment of the 2SLAQ radio galaxies
As discussed briefly in §3.2.2, radio–source statistics suggest that many of the 2SLAQ galaxies lie in highly–clustered environments. The 2SLAQ sample also contains at least two “head–tail” radio galaxies (J135058.43003633.5 and J143432.65010457.3 in Table 3), which are often tracers of high–redshift rich clusters (e.g. Blanton et al. 2003).
The clustering properties of the overall 2SLAQ LRG sample have recently been studied by Ross et al. (2006), who note that the 2SLAQ spectroscopic sample is biased against close (30 arcsec) pairs of galaxies because of the minimum fibre separation set by the 2dF positioner (the so-called “fibre collision problem”). In general, the 2SLAQ spectroscopic catalogue omits about 65% of objects which are within 30 arcsec of another 2SLAQ galaxy, about half of those within 1 arcmin and virtually none of those with separations larger than about 3 arcmin. Figure 12 shows an example of a pair of 2SLAQ radio galaxies which are almost certainly members of a cluster at . In this case the angular separation is just over 30 arcsec, and both galaxies were observed spectroscopically. The velocity difference between these two radio galaxies is 420 km s-1, typical of the velocity dispersion of galaxies in a modest-sized cluster or large galaxy group.

6.2 The two–point correlation function for 2SLAQ radio galaxies
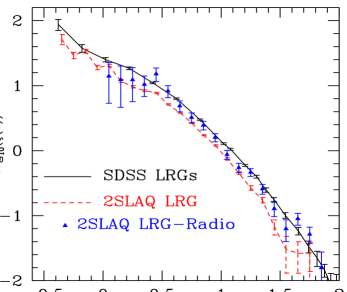
We investigated the clustering properties of the 2SLAQ radio galaxies in a more quantitative way by calculating the redshift–space two–point correlation function between the 2SLAQ radio galaxies and the full LRG sample. The triangular points in Figure 13 show the measured redshift–space correlation (s) between 303 Sample 8 radio galaxies from Table 3 and a set of 8656 LRGs which are also in Sample 8. Further details of the calculations and sample definition are given by Ross et al. (2006). The dashed line in Figure 13 is the 2SLAQ LRG autocorrelation measured by Ross et al. (2006), and the solid line shows the result for the lower–redshift SDSS LRGs from Zehavi et al. (2005) on intermediate-scales and Eisenstein et al. (2005) at the large-scales.
As discussed by Ross et al. (2006), the 2SLAQ LRG measurements lie below the SDSS LRG line. This should not necessarily be taken as evidence of evolution in the clustering properties of LRGs. Although the SDSS LRG survey is at lower redshift than 2SLAQ, it has stricter colour selection criteria and so excludes many of the bluer, less luminous LRGs which are present in the 2SLAQ sample. The SDSS LRGs may therefore appear more clustered simply because they are on average more luminous (and hence more biased) than the 2SLAQ LRGs.
Interestingly, the 2SLAQ radio galaxies have a clustering strength which is higher than the 2SLAQ LRG population as a whole, but lower than the SDSS LRGs. There is no reason to expect that radio galaxies will be clustered differently from other luminous early–type galaxies. Ledlow & Owen (1995) showed that the probability of a luminous early–type galaxy hosting a radio source is unaffected by its clustering environment, and Blake & Wall (2002) found that the angular clustering of NVSS radio sources is similar to that of the general galaxy population. We have shown in Table 4 that the 2SLAQ radio galaxies are significantly more luminous than the 2SLAQ LRG population as a whole. It therefore seems likely that the higher clustering strength of the 2SLAQ radio galaxies can be explained simply by their higher luminosity, though it would be interesting to test this more explicitly.
6.3 Low–power radio galaxies and the FR I/II break
The lowest–power radio galaxies in our 2SLAQ sample have radio luminosities similar to those of FR I radio galaxies in the local universe (see Figure 14). The currently–available FIRST and NVSS radio images do not have high-enough resolution and sensitivity to allow one to distinguish reliably between FR I and FR II morphologies for most radio galaxies in the 2SLAQ sample. At this stage, therefore, it is unclear whether the different rates of cosmic evolution which we find for low–power and high–power radio galaxies represent differences between the FR I and FR II radio–galaxy populations, or simply a general tendency for more luminous radio galaxies to undergo more rapid luminosity evolution. Deeper high–resolution radio observations of the galaxies in Table 3 are needed to address this question further.

6.4 AGN heating and the evolution of massive galaxies
Feedback from AGN heating, and specifically mechanical heating of the interstellar gas by radio jets, is a recent addition to hierarchical models for the formation of massive galaxies (e.g. Croton et al. 2006; Bower et al. 2006). In these models, re-heating of cooling gas by an AGN prevents low–redshift star formation from occurring in massive early–type galaxies, making it possible for hierarchical models to reproduce the observed colours and luminosity function of early–type galaxies.
Best et al. (2006) recently derived an empirical conversion between the observed radio luminosity of an AGN and the mechanical energy input into the parent galaxy, and found that the total energy input scaled roughly as P0.4±0.1, where P is the total radio luminosity. If this is correct, then the global rate of AGN heating in the local universe is dominated by the contribution of low–luminosity (P W Hz-1) radio galaxies, since these make up the great majority of radio-loud AGN.
Our results imply that the low–power radio galaxies associated with LRGs in the local universe would typically have been at least twice as powerful at z0.5 and (by extrapolation) perhaps five times as powerful at . If the same kind of evolution also occurs for radio galaxies weaker than those observed here, then the total energy input from AGN heating in massive early–type galaxies would have been up to 50% higher at than in the local universe, and perhaps twice as high at .

6.5 Effects of the 2SLAQ colour and luminosity cuts
The rate of cosmic evolution measured for low–power radio galaxies in this study is a lower limit, since the 2SLAQ LRG sample has a strict colour cutoff (as plotted in Figure 1) whereas no such colour restriction was applied to the local (6dFGS) radio galaxies. If there were an additional population of blue radio galaxies at redshift , they might be removed by the 2SLAQ colour selection and so missed from our analysis. Figure 15 plots the parameter against redshift for our radio–galaxy sample as well as the full 2SLAQ LRG sample. Any recent or on-going star formation would scatter LRGs to lower values of in this plot, as discussed by Cannon et al. (2006) and Roseboom et al. (2006). Well over 90% of 2SLAQ radio galaxies lie close to the locus of passively–evolving galaxies seen in the main 2SLAQ LRG sample, suggesting that they have undergone little or no recent star formation.
Cannon et al. (2006) have pointed out that the highest–redshift () 2SLAQ LRGs have a bimodal distribution in , and attribute this to later–type luminous galaxies with recent star formation which have spilled across the colour–selection boundary. The region occupied by these objects is shown in Figure 15. Radio galaxies with ongoing star formation should also be easy to identify in this region, but very few are seen (fewer than 5% of 2SLAQ radio galaxies lie near the boundary in Figure 15). We therefore estimate that only a small number of star–forming radio galaxies are being excluded from our sample by the 2SLAQ colour cuts.
A second consideration is the cutoff in optical luminosity set by the 2SLAQ magnitude limit for 2dF spectroscopy. The effect of this is to set a fairly sharp boundary in at M, as can be seen in Figure 14. This corresponds to a lower limit of about M⊙ in stellar mass if we adopt the values of log (M/L) used by Kauffmann et al. (2003).
In the local universe, as discussed in §5.3.1, this cutoff would have little or no effect on measurements of the radio luminosity function. This is confirmed by the recent work of Best et al. (2005b) who find that fewer than 1% of SDSS galaxies with stellar masses below M⊙ host a radio–loud AGN, even at radio luminosities an order of magnitude lower than those considered here. At , however, this is not necessarily the case, and it is possible that galaxies below the 2SLAQ cutoff in optical luminosity could host significant numbers of radio galaxies. Because of this caveat, we stress that the radio luminosity functions derived in this paper apply to optically bright early–type galaxies. If less–luminous galaxies also contribute significantly to the radio luminosity function in the 2SLAQ redshift range, then the overall rate of cosmic evolution in the radio–galaxy population would be even higher than the values derived in §5.3.
7 Summary and future work
The main results of this study are:
-
•
We have measured an accurate radio luminosity function for luminous early–type galaxies in the redshift range , and compared this with the radio luminosity function for the same population in the local universe. This allows us to measure the cosmic evolution of AGN-related radio emission in a single, well-defined galaxy population.
-
•
We find clear evidence that low–power radio galaxies (i.e. those in the luminosity range covered by local FR I radio galaxies) undergo significant cosmic evolution over the redshift range . This evolution is well–fitted by pure luminosity evolution of the form (1+)k (where =2.00.3) for galaxies with radio luminosities between 1024 and 1026 W Hz-1. The overall rate of evolution may be higher than this if some low–power radio galaxies at have been excluded by the mag. cutoff of the 2SLAQ spectroscopic sample.
-
•
The most powerful radio galaxies in our sample (those with 1.4 GHz radio powers above 1026 W Hz-1) may evolve more rapidly than lower–luminosity radio galaxies over the redshift range .
-
•
The radio detection rate is highest for the most luminous 2SLAQ LRGs, and the median absolute magnitude of our radio–galaxy sample is 0.4 mag brighter than that of the 2SLAQ LRG population as a whole.
-
•
The 2SLAQ radio galaxies are more strongly clustered than the overall 2SLAQ LRG sample, possibly because they are on average more luminous.
-
•
Most 2SLAQ radio galaxies show no obvious emission lines in their optical spectra. The fraction showing 3727Å [O II] emission is slightly higher than in the 2SLAQ LRG sample as a whole, this but this may be due to the higher optical luminosity of the radio–galaxy subsample and a more detailed analysis is needed. About 3% of the 2SLAQ radio galaxies show high–ionization emission lines of 3426Å [Ne V] and/or 3870Å [Ne III].
This paper presents a first analysis of the evolving radio–galaxy population out to . A second paper (Johnston et al. 2007, in preparation) will study the stellar populations of radio–loud LRGs in the 2SLAQ survey. Further radio observations of the 2SLAQ area would be valuable, both at higher spatial resolution (to test whether the FR I/FR II divide seen in Figure 14 evolves with redshift) and to fainter flux limits (to probe further down the radio luminosity function). Since the 2SLAQ survey also targeted QSOs over a redshift range which overlaps that covered by the LRG survey, a comparison of the relative numbers of radio galaxies and radio–loud QSOs in the same redshift range would give a useful test of the unified model for radio–loud AGN.
The new 2dF AAOmega spectrograph recently commissioned at the Anglo–Australian Telescope has significantly higher efficiency than the system used for the 2SLAQ survey, and now makes it possible to extend the 2SLAQ LRG survey to higher redshifts and/or larger samples. In particular, a large spectroscopic redshift survey of LRGs out to appears to be feasible in the near future.
New radio surveys will be needed to identify and study low–power radio galaxies beyond in conjunction with the new generation of large-area spectroscopic surveys, though the existing FIRST and NVSS surveys will still be able to detect many of the most powerful radio galaxies out to . A new radio survey would ideally be able to detect sources well below 1 mJy over a wide area of sky (at least 50 square degrees), and achieve both good positional accuracy and good surface–brightness sensitivity. While this is time-consuming at present, it should be easier when new wide–band correlators come into use at both the Australia Telescope Compact Array (ATCA) and the VLA over the next few years.
8 Acknowledgements
We thank the staff of the Anglo–Australian Observatory for their help in maintaining and running the 2dF spectrograph throughout the course of the 2SLAQ survey. EMS acknowledges support from the Australian Research Council through the award of an ARC Australian Professorial Fellowship.
Funding for the SDSS and SDSS-II has been provided by the Alfred P. Sloan Foundation, the Participating Institutions, the National Science Foundation, the U.S. Department of Energy, the National Aeronautics and Space Administration, the Japanese Monbukagakusho, the Max Planck Society, and the Higher Education Funding Council for England. The SDSS Web Site is http://www.sdss.org/.
The SDSS is managed by the Astrophysical Research Consortium for the Participating Institutions. The Participating Institutions are the American Museum of Natural History, Astrophysical Institute Potsdam, University of Basel, Cambridge University, Case Western Reserve University, University of Chicago, Drexel University, Fermilab, the Institute for Advanced Study, the Japan Participation Group, Johns Hopkins University, the Joint Institute for Nuclear Astrophysics, the Kavli Institute for Particle Astrophysics and Cosmology, the Korean Scientist Group, the Chinese Academy of Sciences (LAMOST), Los Alamos National Laboratory, the Max-Planck-Institute for Astronomy (MPIA), the Max-Planck-Institute for Astrophysics (MPA), New Mexico State University, Ohio State University, University of Pittsburgh, University of Portsmouth, Princeton University, the United States Naval Observatory, and the University of Washington.
We thank the referee for several useful comments which improved the final version of this paper.
References
- [1] Auriemma, C., Perola, G.C., Ekers, R.D., Fanti, R., Lari, C., Jaffe, W.J., Ulrich, M.H., 1977, A&A, 57, 41
- [2] Becker, R.H., White, R.L., Helfand, D.J., 1995, ApJ, 450, 559
- [3] Best, P.N., Kauffmann, G., Heckman, T, Ivezic, Z., 2005a, MNRAS 362, 9
- [4] Best, P.N., Kauffmann, G., Heckman, T, Brinchmann, J., Charlot, S., Ivezic, Z., White, S.D.M., 2005b, MNRAS 362, 25
- [5] Best, P.N., Kaiser, C.R., Heckman, T.M., Kauffmann, G., 2006, MNRAS, 368, L67
- [6] Bicknell, G.V., 1995, ApJS, 101, 29
- [7] Binney, J., Tabor, G., 1995, MNRAS 276, 663
- [8] Birzan, L., Rafferty, D.A., McNamara, B.R., Wise, M.W., Nulsen, P.E.J., 2004, ApJ 607, 800
- [9] Blake, C., Wall, J., 2002, MNRAS, 337, 993
- [10] Blanton, E.L., Gregg, M.D., Helfand, D.J., Becker, R.H., White, R.L., 2003, AJ, 125, 1635
- [11] Blundell, K.M., Rawlings, S., Willott, C.J., Kassim, N.E., Perley, R., 2002, New Astronomy Reviews, 46, 75
- [12] Bower, R.G., Benson, A.J., Malbon, R., Helly, J.C., Frenk, C.S., Baugh, C.M., Cole, S., Lacey, C.G., 2006, MNRAS, in press
- [13] Boyle, B.J., Shanks, T., Peterson, B.A., 1988, MNRAS, 238, 957
- [14] Bressan, A., Chiosi, C., Fagotto, F., 1994, ApJS, 94, 63
- [15] Brown, M.J.I., Webster, R.L., Boyle, B.J., 2001, AJ, 121, 2381
- [16] Cannon, R.D. et al., 2006, MNRAS, 372, 425
- [17] Clewley, L., Jarvis, M.J., 2004, MNRAS, 352, 909
- [18] Colless, M. et al., 2001, MNRAS, 328, 1039
- [19] Condon, J.J., Cotton, W.D., Greisen, E.W., Yin, Q.F., Perley, R.A., Taylor, G.B., Broderick, J.J., 1998, AJ, 115, 1693
- [20] Condon, J.J., 1992, ARA&A 30, 575
- [21] Croton, D. et al., 2006, MNRAS, 365, 11
- [22] Doroshkevich, A.G., Longair, M.S., Zeldovich, Y.B., 1970, MNRAS 147, 139
- [23] Dunlop, J.S., Peacock, J.A., 1990, MNRAS 247, 19
- [24] Eisenstein, D.J. et al., 2001, AJ, 122, 2267
- [25] Eisenstein, D.J. et al., 2005, ApJ, 633, 560
- [26] Fanaroff, B,L, Riley, J.M., 1974, MNRAS, 167, 31
- [27] Fukugita, M., Ichikawa, T., Gunn, J.E., Doi, M., Shimasaku, K., Schneider, D.P., 1996, AJ, 111, 1748
- [28] Hopkins, A.M., Afonso, J., Chan, B., Cram, L.E., Georgakakis, A., Mobasher, B., 2003, AJ, 125, 465
- [29] Hopkins, A.M., 2004,ApJ 615, 209
- [30] Ivezic, Z. et al., 2002, AJ, 124, 2364
- [31] Jackson, C.A., Wall, J.V., 1999, MNRAS, 304, 160
- [32] Jones, D.H. et al., 2004, MNRAS, 355, 747
- [33] Jones, D.H., Peterson, B.A., Colless, M., Saunders, W., 2006, MNRAS, 369, 25
- [34] Kauffmann, G. et al., 2003, MNRAS, 341, 33
- [35] Laing, R.A., Riley, J.M., Longair, M.S., 1983, MNRAS 204, 1511
- [36] Lampton, M., Margon, B., Bowyer, S., 1976, ApJ, 208, 177
- [37] Large, M.I., Mills, B.Y., Little, A.G., Crawford, D.F., Sutton, J.M., 1981, MNRAS, 194, 693
- [38] Ledlow, M.J., Owen, F.R., 1995, AJ, 109, 853
- [39] Ledlow, M.J., Owen, F.R., 1996, AJ, 112, 9
- [40] Lewis, I.J. et al., 2002, MNRAS, 333, 279
- [41] Longair, M.S., 1966, MNRAS 133, 421
- [42] Magorrian, J. et al., 1998, AJ, 115, 2285
- [43] Mauch, T., Sadler, E.M., 2006, MNRAS, submitted
- [44] Owen, F.R., Ledlow, M.J., Keel, W.C., 1995, AJ, 109, 14
- [45] Peacock, J.A., 1999, ‘Cosmological Physics’, Cambridge University Press, p. 443–445
- [46] Phillips, M.M., Jenkins, C.R., Dopita, M.A., Sadler, E.M., Binette, L., 1986, AJ, 91, 1062
- [47] Rawlings, S., Jarvis, M.J., 2004, MNRAS 355, L9
- [48] Rocca–Volmerange, B., Le Borgne, D., De Breuck, C., Fioc, M., Moy, E., 2004, A&A, 415, 931
- [49] Roseboom, I.G. et al., 2006, MNRAS, in press
- [50] Ross, N.P. et al., 2006, MNRAS, submitted
- [51] Sadler, E.M., Jenkins, C.R., Kotanyi, C.G., 1989, MNRAS, 240, 591
- [52] Sadler, E.M. et al., 2002, MNRAS, 329, 227
- [53] Schmidt, M., 1968, ApJ, 151, 393
- [54] Snellen, I.A.G., Best, P.N., 2001, MNRAS, 328, 897
- [55] Springel, V., Di Matteo, T., Hernquist, L., 2005, MNRAS 361, 776
- [56] Stoughton, C. et al., 2002, AJ, 123, 485
- [57] Veilleux, S., Osterbrock, D.E., 1987, ApJS, 63, 295
- [58] Wake, D.A. et al., 2006, MNRAS, 372, 537
- [59] Wall, J.V., 1990, Phil. Trans. R. Soc., A296, 367
- [60] Willott, C.J., Rawlings, S., Blundell, K.M., Lacy, M., Eales, S.A., 2001, MNRAS, 322, 536
- [61] York, D.G. et al., 2000, AJ 120, 1579
- [62] Zehavi, I. et al., 2005, ApJ, 608, 16