Specific SFR profiles in nearby spiral galaxies: quantifying the inside-out formation of disks
Abstract
We present specific Star Formation Rate (sSFR) radial profiles for a sample of 161 relatively face-on spiral galaxies from the GALEX Atlas of Nearby Galaxies. The sSFR profiles are derived from GALEX & 2MASS (FUV) color profiles after a proper SFR calibration of the UV luminosity and -band mass-to-light ratio are adopted. The (FUV) profiles were first corrected for foreground Galactic extinction and later for internal extinction using the ratio of the total-infrared (TIR) to FUV emission. For those objects where TIR-to-FUV-ratio radial profiles were not available, the (FUVNUV) color profiles as a measure of the UV slope. The sSFR radial gradients derived from these profiles allow us to quantify the inside-out scenario for the growth of spiral disks for the first time in the local Universe.
We find a large dispersion in the slope of the sSFR profiles with a slightly positive mean value, which implies a moderate inside-out disk formation. There is also a strong dependency of the value of this slope on the luminosity and size of the disks, with large systems showing a uniform, slightly positive slope in almost all cases and low-luminosity small disks showing a large dispersion with both positive and negative large values. While a majority of the galaxies can be interpreted as forming stars gradually either from inside out or from outside in, a few disks require episodes of enhanced recent growth with scale lengths of the SFR (or gas infall) being significantly larger at present than in the past. We do not find any clear dependence of the sSFR gradient on the environment (local galaxy density or presence of close neighbors).
1 Introduction
According to the CDM paradigm of hierarchical galaxy formation the inner parts of galactic disks form first followed by the formation of their outer regions (White & Frenk 1991; Mo, Mao, & White 1998). This naturally results in a gradual growth of the size (i.e. scale-length) of the disks with time. This inside-out formation scenario has been also confirmed by recent N-body/SPH simulations of the evolution of individual disk galaxies (e.g. Brook et al. 2006).
Moreover, the inside-out scenario of disk formation has been also proposed to explain the radial variation of the abundances of elements and colors in the disk of our own Milky Way (Matteucci & Francois 1989; Boissier & Prantzos 1999). In the case of the models for our Galaxy, the inside-out scenario is usually taken into account by increasing the gas-infall timescale with radius. The results of such models are in agreement with observables in our Milky Way such as the abundance gradients, and the wavelength dependence of the scale-length of the disk. Interestingly, this radial increase in the gas-infall timescale has been reproduced by some recent N-body/SPH simulations by Sommer-Larsen et al. (2003; model S1) and Samland & Gerhard (2003). Another independent result that is consistent with this scenario comes from the weak dependence found of the mass-size relation of distant disk galaxies with redshift, since according to the inside-out growth of disks the scale-length is expected to increase roughly proportional to the stellar mass (Barden et al. 2005; Trujillo et al. 2004, 2006).
In spite of this being a long-known prediction of both hierarchical and chemical evolution models of galaxy formation very few observational data have been brought forward to convincingly support it. This is probably consequence of the fact that determining the sizes of disks of intermediate redshift has traditionally been a complicated task due to the cosmological surface brightness dimming, band shifting, and to the problems for identifying the distant counterparts to the population of local disk galaxies. Recently, Trujillo & Pohlen (2005) have proposed using the truncation radius of galaxies at different redshifts as a measure of the growth rate in galactic disks. Using the data from the Hubble Ultra Deep Field, these authors have estimated that galactic disks have suffered a small-to-moderate growth of 25% since redshift =1.
In the same way that it has been done in the Milky Way, the analysis of the color profiles of nearby spiral galaxies might provide important clues to determine if the bulk of the galatic disks have indeed formed from inside out. Radial variations of the SFH have been identified as a key mechanism to explain color gradients in disks (de Jong 1996). These gradients can be interpreted on the basis of different scale-lenghts of the disk in different bands, a result which is predicted by models based on the inside-out scenario (Prantzos & Boissier 2000). The study of color gradients in nearby spirals has been addressed by several authors (see e.g. de Jong 1996; Taylor et al. 2005), mainly in the optical range. In order to better relate color gradients to a radially varying SFH, observations at other wavelengths are needed. In particular, the comparison between the ultraviolet-light profiles, very sensitive to the presence of recent star formation activity, and those in the near-infrared -band, sensitive to the accumulated star formation in the galaxy, would give a direct measure of the recent disk growth. In this paper we derive the azimuthally-averaged radial profiles in (FUV) color (or, equivalently, specific Star Formation Rate, sSFR hereafter; see Appendix A) for a sample of 161 relatively face-on nearby ( Mpc) spiral galaxies as a metric tracer of the disk growth. Throughout this article we have adopted a concordant cosmology, with km/s/Mpc, and .
In Section 2 we present the sample of galaxies for which the availability of both ultraviolet and near-infrared allow us to determine sSFR profiles. The analysis methods are described in Section 3. Results are presented in Section 4. Assuming a simple formulation for the star formation history of the disks of these galaxies in Section 5 we introduce a model that relates the slope of the sSFR profiles to the growth of the disks. A comparison between the predictions of this model and the sSFR profiles measured is discussed in Section 6. Finally, we summarize our conclusions in Section 7.
2 The sample
We have compiled a sample of 161 galaxies from the GALEX Ultraviolet Atlas of Nearby Galaxies (Gil de Paz et al. 2006) on the basis of two main selection criteria: morphological type and inclination. We limit our sample to spiral galaxies with Hubble types from S0/a to Sm, i.e. galaxies with according to the Third Reference Catalogue of Bright Galaxies (RC3; de Vaucouleurs et al. 1991).
In order to minimize the effects of internal extinction and ambiguity in the morphological class, we select only moderately face-on galaxies (). We compute the inclination angle using the major and minor axis sizes at the 25th magnitude isophote in the B band, as given in the RC3. The intrinsic thickness of the disk can be taken into account by using the expression , where is the observed minor to major axis ratio and the intrinsic flattening of the disk as seen edge-on. The latter has been estimated as a function of morphological type by Guthrie (1992). Since no value of is given for type Sdm in this paper, we assume a intermediate value of 0.25.
These two general constraints yield an initial subset of 178 galaxies. It should be noted, however, that the inclination angle derived from the semiaxis ratio may not be reliable for galaxies with asymmetric arms, due to the interaction with a companion galaxy (e.g. M51a), or for those ones with S-shaped arms coming out of a central ring or bar (e.g. M95, NGC1097). In these cases the inclination angle computed from the semiaxis ratio is usually overestimated. Consequently, we visually inspected the whole GALEX Atlas looking for galaxies that, in spite of being clearly face-on, do not match our initial selection criteria. We also added to our sample a few extensively-studied galaxies whose inclination angles are slightly above our limit (M33, NGC0300). In summary, a total of 23 additional galaxies were included in our sample.
Due to the fact that GALEX FUV detector had to be turned off during periods of unusual solar activity or overcurrent events to preserve the detector electronics, some galaxies in the Atlas were observed only in the NUV band. Thus, we had to remove from our sample 26 galaxies that lacked FUV images. Another 14 objects do not have available 2MASS data and were also excluded from the final sample, which is constituted by 161 disk galaxies.
In Table 1 we present basic data of the galaxies in our sample. The equatorial coordinates were taken from NED, and typically are derived from the 2MASS position. We show the apparent major diameter of the elliptical isophote measured at = 25 mag arcsec-2, D25, as well as the morphological type, both taken from the RC3 catalog. The Galactic color excess is derived from the maps of Schlegel et al. (1998). The inclination angle is obtained as explained above. Apparent magnitudes in the FUV band are asymptotic, i.e. they were computed by extrapolating the growth curve using the surface brightness profiles in FUV (Gil de Paz et al. 2006). For the band, apparent total magnitudes () from the 2MASS Large Galaxy Atlas (LGA, Jarrett et al. 2003) were used when available, and those given in the 2MASS Extended Source Catalog (XSC; Jarrett et al. 2000) were adopted for those galaxies not in the LGA. Distances to each object were compiled from a wide variety of resources (see Gil de Paz et al. 2006 for details).
3 Analysis
3.1 Radial profiles
Surface brightness radial profiles at both GALEX UV bands have been presented in Gil de Paz et al. (2006). They were obtained with the IRAF111IRAF is distributed by the National Optical Astronomy Observatories, which are operated by the Association of Universities for Research in Astronomy, Inc., under cooperative agreement with the National Science Foundation. task ellipse by measuring the mean intensity and rms along elliptical isophotes with fixed ellipticity and position angle, equal to those of the = 25 mag arcsec-2 isophote from the RC3 catalog. The center of these ellipses were set at the coordinates shown in Table 1, with a constant increment of 6 arcsec along the semimajor axis to a final radius at least 1.5 times the D25 radius. In the final profiles, the outermost points were removed when the intensity fell below the level of the sky, or when the error in the surface photometry in the NUV band was larger than 0.8 mag.
In order to derive color profiles in a consistent way we used the same set of elliptical isophotes to obtain surface brightness profiles in the band. Near-infrared images for 121 galaxies (75% of our sample) were compiled from the 2MASS XSC. The remaining 40 objects are too large to fit into a single 2MASS scan or lay too close to an edge. In those cases individual mosaics were obtained from the 2MASS LGA. All FITS were already background and star substracted; however, in some of the XSC images the star-substraction algorithm failed to detect some stars, which had to be masked by hand. Companion galaxies were also masked before measuring the profiles. As for the GALEX images, foreground stars were detected and masked as those point sources having colors redder than 1 mag; these masks were later modified after a visual inspection. Detailed information about this process can be found in Gil de Paz et al. (2006).
Due to the fact that for most galaxies, as we show in Section 4.1, surface brightness in the band decreases faster than in FUV as we move away from the center of the galaxy and because the 2MASS images are not very deep ( mag arcsec-2), our -band surface brightness profiles are usually restricted to a somewhat smaller radius than those in the FUV. For M33, we made use of a deeper (6X) 2MASS image ( mag arcsec-2; see also Block et al. 2004). M33 is close enough to resolve individual stars, but discerning them from foreground stars in the Milky Way is not straightforward. In fact, the star removal was performed in a statistical way, comparing color histograms of adjacent control fields and M33 itself (see Block et al. 2004 for details). Therefore, although the star removal is correct from a statistical point of view, some stars in M33 might have been removed and vice versa, some sources still visible in the final image could be foreground stars. After examining its (FUV) profile, we concluded that data points more than 25 arcmin from the galaxy center (measured along the semimajor axis) were highly contaminated by foreground stars, with little or no contribution coming from M33 sources, and were drawn out from the profile.
Uncertainties in the surface photometry were derived following the prescriptions given by Gil de Paz & Madore (2005), as had been already done for the FUV profiles (Gil de Paz et al. 2006). The random error in depends on the intrinsic variation of the intensity within each elliptical isophote and the error in the sky level. The latter includes two different contributions: Poisson noise in the sky level (as well as pixel-to-pixel flat-fielding errors), and low spatial frequency flat-fielding errors. Considering that in 2MASS images flat-field correction and sky-substraction are carried out using whole scans, we can safely assume that the contribution of low-frequency errors to the final uncertainty is negligible compared to that of the high-frequency ones. Hence, we compute the final random uncertainty in from the rms along each isophote (which is part of the output of the IRAF task ellipse) and local noise measurements provided as part of the headers of the XSC/LGA FITS files.
Once the mean surface brightness and its error have been measured, they are converted into magnitudes/arcsec2 using the calibrated zero point provided in the header of each XSC/LGA FITS image. This introduces a systematic uncertainty of 0.007 mag in the -band magnitudes, which is considerably smaller than the zero-point error of 0.15 mag in the FUV data.
Before combining our -band profiles with those in FUV, we correct them for foreground Galactic extinction using the color excesses from the Schlegel et al. (1998) maps and the parameterization of the Galactic extinction curve given by Cardelli et al. (1989). We assume a value of , which implies a total-to-selective extinction in the band of [compare with ].
Fig. 1 shows the (FUV) color profiles for six typical galaxies in our sample (upper region of each panel). Gray points are only corrected for Galactic extinction, as described above, whereas black points are also corrected for internal extinction (see Section 3.2). Each point is shown with its corresponding error, computed as the square-root of the quadratic sum of random uncertainties in both and . For the sake of clarity, error bars do not include the systematic zero-point uncertainty in (FUVK), which is 0.15 mag (the zero-point error in FUV dominates over the one in ). Note that this zero-point uncertainty does not affect to the shape of the profiles, but only the normalization. Moreover, since the vast majority of the images in the GALEX Atlas were processed and reduced following the same version of the GALEX pipeline, the effect of the zero-point error is expected to be the same for all our galaxies. The lower plot in each panel shows the (FUVNUV) color profile for each galaxy (see Section 3.2).
3.2 Internal extinction correction
Before computing the specific SFR as a function of radius, the (FUV) color profiles must be corrected for internal extinction. The ultraviolet light emitted by young massive stars is absorbed and scattered by dust, and then remitted in the far-infrared (FIR). Hence, the ratio of far-infrared to ultraviolet luminosity is directly related to dust extinction. Furthermore, on the basis of the results from previous works (e.g. Buat et al. 2005 and references therein), this ratio has proven to be only weakly dependent on certain intrinsic properties of galaxies, such as the internal extincion law, the spatial distribution of dust and stars, or the galaxy star formation history. Therefore, although FUV radiation can be highly attenuated by dust, it is possible to infer and hence recover the emitted FUV luminosity, and from that the SFR (Kennicutt 1998).
We correct our color profiles using the prescriptions in Boissier et al. (2006). Using IRAS data for a sample of well resolved objects in the Galex Atlas of Nearby Galaxies, Boissier et al. derived FIR and total-infrared (TIR) profiles from measurements at 60 m and 100 m. Once combined with the UV profiles, the radial profiles in the luminosity ratio (or TIR-to-FUV ratio) obtained are converted into profiles using the polynomial fits of Buat et al. (2005).
We have applied this internal extinction correction to 16 galaxies in our sample that were also studied by Boissier et al. (2006). Since the images employed to derive extinction profiles were degraded to match the IRAS resolution, we had to interpolate values for our radial profiles. In order to achieve a smooth result and avoid artifacts in our corrected color profiles, a spline interpolation method was used for all galaxies except for NGC1291, where the extinction curve was not smoothly reproduced by the interpolation algorithm and a linear interpolation was adopted instead. The upper and lower uncertainties in usually change more abruptly with radius than itself, thus making the spline interpolation unreliable. Therefore, these errors were linearly interpolated and then assigned to their corresponding values.
However, for the majority of galaxies in our sample we cannot apply the direct extinction correction based on the profiles. Fortunately, the infrared excess (and hence ) is related to the slope of the UV spectrum or, equivalently, the (FUVNUV) color, with redder (FUVNUV) colors meaning higher dust attenuation (see e.g. Cortese et al. 2006 and references therein). Although this relation (known as the IRX- law) was originally found to be applicable only to actively star-forming systems (Meurer et al. 1999), recent work by Gil de Paz et al. (2006) show that, although with a significant dispersion, such a trend is also present in normal spiral galaxies such as those in our sample, especially when the TIR-to-FUV and (FUVNUV) radial profiles of the disks of these galaxies are compared (Boissier et al. 2006). Here we have taken advantage of the empirical relation between the TIR-to-FUV ratio and the (FUVNUV) color derived by Boissier et al. (2006) and the (FUVNUV) radial profiles presented by Gil de Paz et al. (2006). This procedure allows us to obtain profiles for the remaining 145 galaxies in our sample. The uncertainties in were computed from the upper and lower limits of the 1 prediction band for Boissier et al. fit to the IRX- plot.
Although to a significantly reduced extent, the -band luminosity is also affected by the presence of dust inside the disk of the galaxy. Assuming the Cardelli et al. parameterization of the extinction curve to be valid in our galaxies, we compute the K-band extinction to be . The choice of a different internal extinction curve would have not significantly affected our extinction corrected profiles since independent of the composition and physical properties of dust grains.
Table 2 shows the color profiles for the galaxies in our sample. Since we are dealing with disk-like galaxies, we use the radius along the semi-major axis of the elliptical isophotes instead of the equivalent radius (as it was done in Gil de Paz et al. 2006) to describe our profiles. We show the measured FUV and -band surface brightness as well as the (FUVNUV) color, corrected only for foreground Galactic extincion as described in Section 3.1. The different values of and the corrected (FUV) profiles are also given, with their corresponding upper and lower uncertainties. Finally, we give the specific SFR at each radius for each galaxy (see Section 4.1 for the derivation of the sSFR).
Fully corrected profiles can be seen in the upper part of each panel in Fig. 1 as black dots, whose error bars account for both photometric and extinction-correction uncertainties. The bottom part of each panel shows the (FUVNUV) color profiles.
Since the extinction correction may be subject of large uncertainties (both random and systematic), it is important to determine to what extent the observed (FUV) color profiles are determined by radial variations in the extinction rather than by the intrinsic colors of the underlying stellar population (and hence by the SFH). In order to address this important issue, in Fig. 2 we plot , the radial gradient of the extinction in the FUV (see also Table 3), against , the observed (FUV) color gradient, both of them measured in the disk-dominated region of the profiles (that is, excluding the bulge). The cross shows the mean uncertainties in both parameters ( mag/kpc and mag/kpc). Note that almost 30% of the sample show errors lower than half these values, for which the derived sSFR profiles will be most reliable. See Section 4 for an in-depth description of the fitting procedure.
The diagram has been divided into four zones. The diagonal line is the loci of galaxies with , meaning that the intrinsic (FUV) profile is flat and the observed color gradient is entirely due to radial changes in the extinction. Therefore, galaxies to the left of this line can be described in terms of an inside-out formation, with the stellar population becoming relatively bluer and younger with increasing radiues, and vice versa. On the other hand, galaxies in the lower half of the figure are those in which the dust content decreases with radius, while those in the upper half have positive dust gradients (note that the limitations of the IRX- plot may constitute an important caveat here).
Two important conclusions concerning the extinction correction can be derived from this plot. Most galaxies are located in the bottom-left region of the plot, as would be expected, and they do not follow the diagonal line, meaning that we can actually obtain reliable sSFR gradients since the observed color gradient is not only due to variations of AFUV. Secondly, correcting for internal extinction is clearly essential to properly study the evolution and growth of disks from color gradients. Had we simply used the observed (FUV) color profile to compute the specific SFR, the boundary between inside-out and outside-in scenarios would have been a vertical line at rather than a diagonal one, leading to an overestimation of their inside-out growth.
4 Results
4.1 Specific SFR profiles
Once the Galactic and internal extinction corrections have been applied, we proceed to compute the specific Star Formation Rate (sSFR). Following the calibration given by Kennicutt (1998) to convert FUV luminosity into SFR, the specific SFR can be expressed as a function of (FUV) as
| (1) |
where is the stellar mass-to-light ratio (expressed in solar units) in the K-band (see Appendix A). We have adopted a constant value of (Bell et al. 2003) across the entire extent of the disk. Indeed, the choice of a different mass-to-light ratio would not modify the radial gradient of the specific SFR, only the global normalization, as long as it remains constant all over the disk. However, the mass-to-light ratio could depend on the galactocentric distance; the effects that radial variations of could have on the sSFR gradient are discussed later in this section.
It is widely known that light profiles of disks usually follow an approximately exponential law. Therefore, (FUV) and sSFR (once expressed in log scale) are also expected to track linearly with radius. Thus, in order to characterize the main properties of the sSFR radial variations we have performed a linear fit to our sSFR profiles (in log scale). Obviously, local features in the profiles due to rings or arms etc., cannot be described with a straight line; we are mainly interested in the global gradient of sSFR along the whole disk, over spatial scales somewhat larger than these local features.
We must first exclude the bulges from this analysis for several reasons. The extinction correction we have applied to our profiles is only valid in star-forming systems like the disks of spiral galaxies. Bulges and early-type galaxies do not usually host active star formation processes, and their red (FUVNUV) colors are mainly due to the intrinsically red underlying stellar population rather than dust attenuation. Besides, evolved giant stars in the blue part of the horizontal branch may contribute to the observed UV flux. Finally, in galaxies with AGN activity a blue peak could be observed associated to the innermost nuclear regions.
The radius at which the contribution of the bulge to the (FUV) color is negligible compared to that of the disk ( hereafter) was determined by visually inspecting the (FUVNUV) radial profiles, complemented with UV and optical images. In most cases the bulge-disk separation is rather easy to determine, since both (FUVK) color and its gradient experience an obvious change. On the other hand, we found many galaxies with no apparent bulge or a very small one. For some of these objects the size of the bulge is of the order of the resolution of the GALEX images (PSF FHWM5 arcsec). For those galaxies we adopted a conservative criterion (=9 arcsec) and removed the first point of the profiles from the linear fit, just to be sure that the contribution of the bulge or AGN (if present) does not significantly alter our results.
Table 3 shows the value of used for each galaxy, as well as the resulting parameters of the linear regression: the extrapolated value of sSFR at ( hereafter) and the slope (, hereafter). These values are obtained by performing an unweighed linear fit over the central (i.e. most probable) values of log(sSFR) (column 7 in Table 2). Traditionally, weighted linear fits only take into account the relative weight of each point with respect to the others based on their errors but not the absolute value of each individual uncertainty. Although this results in a correct estimate of the best-fitting parameters and their variances when the individual uncertainties are comparable to the dispersion around the best-fit, it might lead to wrong estimates if either individual uncertainties are much smaller than the dispersion of the data (due to the presence of outliers) or the opposite, individual errors are much larger than the actual dispersion of the data (Press 1992). This is actually the case for those of our sSFR profiles corrected for extinction using the empirical relationship between (FUVNUV) color and TIR-to-FUV ratio given by Boissier et al. (1996). The use of this relationship results in relatively large uncertainties in the corrected (FUV) color profiles but small dispersion between individual data points. This is a consequence of assuming that the value of the TIR-to-FUV ratio of the individual data points in the profile for a given galaxy can be found anywhere within the 1- prediction band of Boissier et al. (2006) for a given (FUVNUV) color, i.e. the internal-extinction corrections are independent from point to point. This behavior in the data results in errors in the parameters that are clearly underestimated if a standard weighted least-squares fitting technique is used.
Consequently, in order to derive more realistic errors for and we performed Monte Carlo simulations on our profiles. For each data point in a profile we generated 2000 random points following a normal distribution with and , which are then rescaled according to the upper and lower uncertainties of log(sSFR) and added to the central values (assumed to be the most probable ones). We then apply a linear fit to each new random profile, ending up with a set of 2000 values of and . We finally compute the upper and lower standard deviations of these randomly obtained values with respect to our best-fit values previously derived. These uncertainties are shown in Table 3.
In order to compute the specific SFR from the (FUV) color we make the assumption that the -band mass-to-light ratio depends only weakly on the galactocentric distance and a constant can be adopted. As discussed by Bell & de Jong (2001), for a stellar population showing a wide range of optical colors [=0.8 to 1.4 mag] and timescales of formation (from 3 Gyr to ) the is found to vary by only 0.2 dex. In those disks where the would decrease towards the outer and, consequently, bluer parts of the galaxy the gradient of specific SFR would obviously be positive and slightly larger than that derived assuming a constant -band mass-to-light ratio. A simple estimate shows that could be about 0.02 dex/kpc higher in these disks for a typical radius of 10 kpc, and possibly less for bigger galaxies, under the conservative assumption that the timescale of formation changes from 3 Gyr to across the disk. The opposite would occur in galaxies with an opposite color gradient, whose sSFR slopes could be reduced by a similar amount. It is worth noting that this systematic uncertainty is significantly smaller than our typical errors in ( dex/kpc), which include both photometric and extincion-correction uncertainties.
The ratio can also vary with Hubble type, although this would only affect , but not . Portinari, Sommer-Larsen & Tantalo (2004) estimate that can change from around 1 to 0.6 from early to late-type spiral galaxies. These variations around our adopted average value of would globally increase the specific SFR of late-type spirals by dex, and decrease it by a similar amount for early-type disks.
The conversion factor between FUV luminosity and SFR given by Kennicutt (1998) is computed assuming solar metallicity (see Madau, Pozzetti & Dickinson, 1998). For a given SFR the FUV luminosity is expected to decrease with increasing metallicity, due to the blanketing effect caused by metallic absorption lines in the FUV. Hence, radial metallicity gradients in our disks might constitute an additional source of systematic uncertainty. We made use of the Starburst99 synthesis code (Leitherer et al. 1999) to estimate how the FUV luminosity would change with different metallicities (ranging from 0.008 to 0.040) and a fixed SFR. The FUV luminosity is found to be mag fainter for than for . Therefore, according to Eq. 1, the specific SFR would be dex higher for a high-metallicity region than for a low-metallicity one with the same FUV luminosity. Since metallicity is usually found to decrease with the galactocentric radius, if we assume that these extreme metallicity gradients are spread across the whole disk ( kpc), our sSFR gradients derived assuming a constant solar metallicity within the whole disk would be overestimated by 0.01 dex/kpc, which is still below our typical quoted uncertainties. To summarize, we estimate that the possible spread in and metallicity is not a significant component of the total sSFR uncertainty.
The SFR calibration could be also affected by FUV radiation coming from stars in the horizontal branch (HB), specially in the innermost regions of our profiles. HB stars are thought to constitute a major source of FUV radiation in elliptical and lenticular galaxies. In Gil de Paz et al. (2006) it was shown that these early-type galaxies are usually redder than FUV, while spiral and irregular galaxies typically exhibit bluer FUV colors, since their FUV luminosity is dominated by star formation. By comparing the FUV colors of the innermost points of our disk profiles (the ones immediately after ) with those of E and S0 galaxies presented in Gil de Paz et al. (2006), we conclude that only 21 galaxies (13% of our total sample) present innermost regions red enough to overlap with the colors of elliptical and lenticular galaxies, a fraction that decreases to nearly zero when we apply internal-extinction corrections. Even if some contamination from HB stars might be found in the innermost zones of those disks, the global fits to the whole disks should not be affected by some SFR calibration changes in those points.
4.2 Stellar mass surface density profiles
Given the relation between stellar mass and K-band luminosity, another interesting parameter than can be derived from the -band surface brightness profiles is the surface mass density scale-length of the disk (i.e. the radius at which the stellar mass surface density decays by a factor with respect its value at the center; hereafter). This parameter can be used to measure how much a disk has grown since it began forming stars.
Following the procedure described in Section 4.1, we applied linear fits to our extinction-corrected -band profiles to obtain the central surface brightness (and the corresponding central stellar mass surface density, ) as well as the scale-length of the disk, which we consider to be the same for both the -band luminosity and the mass surface density profiles (i.e., ) along with their errors. As explained in the previous section, the assumption of constant -band mass-to-light ratio is a potential source of uncertainty for . Again, considering the extreme case where decreases by 0.2 dex in the outer regions of the disk, would be . For galaxies with the opposite color gradient could reach . Therefore, our assumption that both scales-lengths are equal might introduce a maximum systematic uncertainty of only 10%, depending on the sign of the radial color gradient.
Monte Carlo simulations were carried out in order to properly derive the uncertainties in , following the same methodology as for the sSFR profiles. However, for some galaxies with low spatial resolution and high photometric uncertainties (especially for the outermost parts), upper and lower uncertainties for were extremely high (even greater than 100%); those galaxies are marked with a double dagger (‡) in Table 3.
Linear fits were only applied to points with located in the disk-dominated region of the galaxy. In fact, a visual inspection of the -band profiles showed that our initial determination of derived from the (FUV) color profiles was very accurate, properly isolating the bulge-dominated part of the galaxy. The value of was readjusted for only a few objects, but always within our radial isophotal resolution (6 arcsec). The K-band surface brightness profiles can be seen in Fig. 3, along with their corresponding fits. The fitting coefficients are shown in Table 3. The best linear fits to the SFR profiles (within the same radial ranges) have also been derived and the coefficients of these fits are given in Table 3.
4.3 Global statistical properties
Figure 4 shows histograms for both and . Panel (a) shows that galaxies in our sample have values of ranging between over two orders of magnitude, 310-12 yr-1 and 310-10 yr-1. There is a clear dependency on the morphological type: on average, Sc and later-type galaxies have greater values of than earlier types, although both distributions overlap. Assuming that is somehow related (at least qualitatively) to the global sSFR, this result is consistent with previous works based on total H or UV photometry data, where late-type spiral galaxies usually show higher specific star formation rates than more massive early-type spirals (e.g. Boselli et al. 2001; James et al. 2004). This general behavior of the total sSFR seems to be replicated by the extrapolated (central) value of the sSFR of the disks. In other words: to some extent variations in the y-intercept depend on changes of the global sSFR of the disk. However, it must be emphasized that is an extrapolated value, and the integrated sSFR depends also on the slope of the sSFR profile. Indeed, as we will show below, larger slopes are usually found associated with lower y-intercepts ( values) and vice versa. Therefore, all subsequent comparisons between and the global sSFR of the disk should be taken with care.
In panel (b) we show the histogram of the radial gradient of the specific SFR. Most galaxies seem to have a slightly positive gradient of sSFR. Although there are a few galaxies with negative values of , the overall distribution favors positive sSFR gradients. In addition, the histogram of early-type spirals () seems to be more peaked or concentrated than the distribution of late-type ones (). As we will see later, this can be understood in terms of the mass and size of each galaxy.
Figure 5a shows the specific SFR gradient as a function of the y-intercept of the profiles. These parameters appear to be correlated in the sense that galaxies with lower sSFR slopes tend to have greater values of and vice versa. In other words, we do not find many galaxies with simultaneously high (or low) values of and . The observed trend is even tighter if we limit ourselves to relatively large disks (), which lie within a narrow band in the diagram; smaller galaxies have a greater dispersion.
The model-derived lines plotted in Fig. 5 allow us to understand the relation between both parameters in terms of the size and total specific SFR of the disks. Assuming exponential profiles for the radial distributions of both SFR and stellar mass surface densities, the specific SFR gradient can be expressed as (see Appendix B):
| (2) |
where is the extrapolated specific SFR at and is the total specific SFR of the disk (note that we are not including the bulge here).
Therefore, Eq. 2 provides the possible combinations of sSFR at and its radial gradient which are compatible with a total sSFR of the disk and a certain scale-length of the mass radial profile. In Fig. 5a we have plotted six different curves for disk-scales of 2, 4 and 8 kpc and total specific SFR’s of and . We note that the general shape of the distribution of the data can be well reproduced by Eq. 2 with a proper choice of reasonable values for these parameters. In particular, the fact that for the same range in total sSFR (2-4010-11 yr-1) the curves for both small and large disks nicely define the area of the diagram where the corresponding galaxies are located indicates that physical size is the main factor driving the differences and dispersion observed in the values of the gradient of sSFR.
When analyzing the correlation between and we must consider the possibility that this correlation could be partly due to a degeneracy between these quantities. In order to determine whether this is true or not, we have plotted the sets of simulated values of both fitting parameters for each galaxy in Fig. 5b (in order to avoid a complex graph, we only plot 200 out of the 2000 simulated points for each galaxy). Each galaxy is represented by an elliptical cloud of points that covers the region of the graph where the most probable values of the fitting parameters are likely to be found. To better appreciate the orientation and spatial coverage of these clouds, we have used the covariance matrix to compute the ellipse that contains 68% of the simulated points for each galaxy. The colored segments shown in the figure are the major axes of these ellipses; for the sake of clarity, axes larger than 0.5 (in the units of the plot) have been left out from the figure.
The confidence ellipses are found to be aligned in the same direction (or slightly steeper) than the general distribution of data points, with many of them clearly overlapping. Therefore, the observed global correlation between the fitting parameters could be due at least to some extent to degeneracies between and for each individual object. However, the major axes plotted in the figure show that the confidence regions for many galaxies are small enough to be considered detached one from another over the whole ranges of and . Consequently, the global shape of the correlation between these two parameters cannot be explained just on the basis of individually correlated errors; there do exist physical reasons that determine whether a certain combination of slope and y-intercept of a sSFR profile is plausible or not.
4.4 Dependency on size and mass
In this and the following sections we analyze how both fitting parameters, and depend on several physical parameters. In Fig. 6a we show the variation of the specific SFR gradient with , the mass surface density scale-length of the disk. The sample has been divided into three bins of , in order to simultaneously study the influence of the total mass. For the sake of clarity, galaxies with error are shown without error bars (open symbols). Also, the ranges in both axes have been stretched and adjusted to show all but four galaxies, which have even higher values of or (albeit with larger uncertainties; see Table 3). Their positions along the x/y axis are marked by horizontal/vertical arrows, whose colors indicate the corresponding bin. The black solid line at the background indicates the average value of in bins of 1.5 kpc, and the gray shaded band corresponds to the 1 deviation with respect to the mean. Both quantities, mean value and standard deviation, have been computed using the whole set of 2000 values resulting from the Monte Carlo simulations for each galaxy in its corresponding bin of .
We can clearly see that less massive galaxies present quite different values of , mostly positive, but also some negative. This wide range of values, however, shrinks as we move towards larger and more massive galaxies. At the high-mass end of the distribution, most of the data points seem to concentrate within a relatively narrow range, roughly centered around zero or slightly positive values of (note that a larger sample of big, massive galaxies would be desirable to better constrain this asymptotic value). These results are consistent with those derived by Taylor et al. (2005) from the analysis of (UR) color profiles (uncorrected for internal extinction) for a sample of 142 spiral, irregular and peculiar galaxies. Small galaxies are indeed expected to exhibit a wider variety of behaviors than larger ones, since the effects of the spatial and temporal distribution of star formation episodes are in relative terms greater for them. Massive galaxies ought not be so sensitive to external factors that could affect their star formation histories (e.g. gas accretion from a low-mass neighbor galaxy, ram pressure stripping, etc.).
It could be argued that the higher dispersion observed in smaller and less luminous galaxies could be just due to greater uncertainties in . It is true that most galaxies with high values of lie in the low-size region of the diagram, typically below 2 kpc, where the overall disperion is higher. However, if we plot only the 122 galaxies for which (a representative value for galaxies all over our ranges of mass and size), the trumpet-like shape of the diagram is preserved.
Panel (b) shows a similar graph, but this time with . Despite the dispersion of the data, we can see a trend with mass and size, already hinted by the histogram in Fig. 4a: small and less massive spiral galaxies (usually late-type ones) have higher values of (roughly between 0.5 and 1.510-11 yr-1) and then decreases as we consider larger and more massive galaxies, although the dispersion is high and the difference is mainly seen only between the two extreme bins of . This trend could be enhanced by dex if, as discussed in Section 4.1, the mass-to-light ratio varies with Hubble type. Again, if we consider to be a measure of the overall level of the specific SFR, then it is not surprising that its trend with size and mass is similar to the one exhibited by the total sSFR deduced from global photometry data.
4.5 Dependency on size and environment
In this section we analyze the possible dependency of the fitting parameters on size and environment. Panels (c) and (d) in Fig. 6 are similar to (a) and (b), but the color scheme accounts for different local galaxy densities, computed according to the methodology described in Balogh et al. (2004). For each galaxy we determine , the projected distance to the fifth neighbor that is brighter than mag. We compute , the projected local density as being the number of galaxies within a circular area of radius and a redshift slice of km/s (in order to take into account peculiar velocities). That is . Our magnitude limit of mag for the fifth neighbor is consistent with the one used by Balogh et al., mag, assuming that for typical spirals (Peletier & Balcells 1996; Fukugita, Shimasaku & Ichikawa 1995).
We retrieved the coordinates and redshifts of neighbor galaxies for each object in our sample from NED. Their magnitudes in both and bands were collected from the 2MASS XSC catalog. It should be noted that since neighbor galaxies were compiled from the different surveys and sources provided by NED, our determinations of are far from being uniform throughout the whole sample. There may exist biases due to the different spatial coverage of each survey. Besides, many galaxies in our sample are so nearby that the search radius had to be extended up to the limit allowed by NED (300 arcsec) in order to find enough neighbors. Due to that limitation we could only compute for 74 galaxies (45% of the sample).
Panel (c) shows how the specific SFR gradient changes with size, with galaxies sorted out into three bins of projected local density, in units of Mpc-2. Galaxies belonging to the Virgo cluster are represented by black diamonds. There does not seem to exist any kind of relation between and , although a larger number of data points and more robust values of would be desirable in order to confirm this. On the other hand, note that among the six Virgo galaxies found in our sample, five of them have and only one has , whereas nearly 70% of the whole sample have positive sSFR gradients.
In panel (d) we carry out a similar study of the extrapolated sSFR at the center of each galaxy. The dispersion of data is too high to derive conclusive results. It is interesting to note that half of the galaxies belonging to the Virgo cluster have , whereas this fraction drops to when we consider all 74 galaxies in that plot. In any case, the reader is cautioned that the results in panels (c) and (d) might be marginal considering the high dispersion of the data.
The previous way of measuring the local galaxy density is global in nature as it does not explicitly take into account the possible interactions with the closest neighbors, which could play an important role in the radial distribution of the sSFR. In order to study this aspect of environment, for each galaxy we have computed the projected distance to the nearest neighbor whose mass is at least 0.2 times the mass of the galaxy itself (i.e. being no fainter than 1.75 mag different in ). The color scheme in Figure 6e encodes different distances to these neighbors, whereas several symbol sizes are used to show the different mass ratios. The black curve shows the maximum sSFR gradient expected for a given according to a linear disk-growth model with (see Sections 5 and 6). No blue circles are seen below , since it is easier to find close neighbors over a certain relative mass-ratio for the smallest and least massive galaxies. No evident segregation is seen in , nor in [panel (f)].
5 Modeling the specific SFR radial profiles
We have seen in previous sections that the specific SFR radial gradient exhibits an interesting behavior: while there is a wide range of observed values (both positive and negative) for galaxies with disk-scales typically smaller than 2 or 3 kpc, this amplitude decreases when we focus on increasingly larger disks, whose sSFR slopes are generally very close to zero or only slightly positive.
In this section we try to reproduce this trumpet-like shape with a relatively simple model of the radial and temporal evolution of the star formation rate in these galaxies. According to previous work the evolution of the ‘thin-disk’ is thought to dominate the inside-out growth of spiral galaxies (Chiappini, Matteucci, & Gratton, 1997), which is believed to start developing at 1 (Brook et al. 2006). After this epoch mergers gradually become less intense and less frequent. We may therefore suppose that since the growth of spirals has been mainly driven by gradual star formation processes taking place in their thin-disks.
We assume that the SFR density can be approximately modeled as:
| (3) |
where we have set our temporal origin at . is the central SFR surface density at (we do not make any hypothesis about its possible values since, as we will see shortly, it vanishes when computing the specific SFR). In Eq. 3 we have taken into account both temporal and radial variations of the star formation rate. On the one hand, the overall SFR is modulated by the global timescale, , which should be of the order of the gas-infall timescale divided by the index of the star formation law. On the other hand, we have parametrized the scale-length of the SFR profile as . Positive values of correspond to disks in which the star formation is taking place in progressively outward in the disk as time goes by, whereas negative values could be used to describe SFR radial distributions whose extent decreases with time.
We can compute the current total stellar mass and SFR surface density profiles as follows:
| (4) | |||||
| (5) |
where Gyr is the look-back time for and R is the fraction of gas which is returned into the ISM. Dividing both equations we obtain the present-day specific SFR profiles, from which their radial gradients can be derived (see appendix C for details). The exact value of R will not affect our sSFR gradients as long as it does not change across the radius of the disk. This is actually the case under the Instantaneous Recycling Approximation (IRA), which assumes that all stars with masses greater than die immediately, whereas the rest live forever. Under this assumption, the returned fraction R is an instantaneous parameter which does not depend on the SFH, and hence will remain constant across the extent of the disk.
In short, we can use this simple model to ‘predict’ the current values of the sSFR slopes () and scale-length of the mass radial distributions () as a function of three basic parameters: the SFR timescale (), the initial scale-length of the SFR profile at (), and its growth rate (). We can therefore check if the physical assumptions considered in this model lead to the observed dependency between and presented in Fig. 6.
6 Discussion
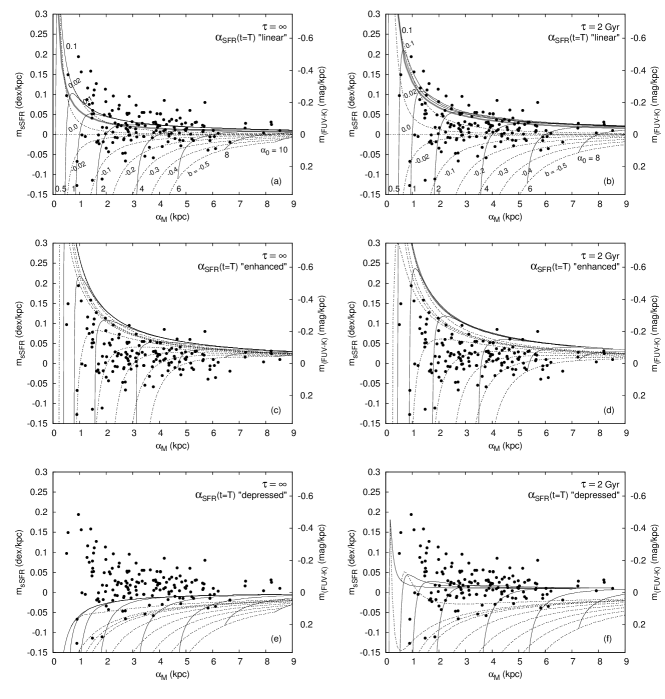
We now proceed to use the results of the simple model described above to reproduce the general trends seen in Fig. 6. Figures 7a & 7b show different model predictions for several sets of parameters along with the observed data points. The initial scale-length of the SFR profiles remains constant along solid lines (with the corresponding values shown below each curve in kpc). Similarly, dashed lines are curves with constant values of , the growth rate of . They are marked with rotated labels, in units of kpc/Gyr. Although the maximum value of shown in the figures is 0.1 kpc/Gyr, simulations were carried out up to kpc/Gyr, but the corresponding curves lie very close to one another, just slightly above the curve for kpc/Gyr, and hence are not plotted for the sake of clarity. The thick gray line marks the loci of disks that have grown by 25% since (i.e. ), which is the value found by Trujillo & Pohlen (2005) from the study of intermediate-redshift disk-galaxies in the UDF.
In panel (a) we present the results of the model assuming . As expected, positive values of the specific SFR slope require positive values of (i.e. galaxies in which the SFR profile has been growing with time towards the outer regions of the disk) whereas galaxies with negative values of are those with a decreasing . The model predicts that galaxies with 1 kpc are expected to present a wide range of sSFR slopes, whereas bigger ones are constrained within a narrower region of the plot, with values of close to zero. In fact, there is some degeneracy in that region of the plot, since galaxies with very different values of and the growth-rate end up with similar current values of and . The solid gray line, corresponding to disks which have grown by 25%, nicely bisects the overall distribution of data points.
In spite of the degeneracy, there exists an upper limit for the possible gradient at a given that leaves out many galaxies in the sample. The model predicts lower sSFR gradients than are observed at a given . In Section 4.2 we discussed the possible effects that radial changes in the mass-to-light ratio could have on and , and argued that galaxies with a typical radial color distribution (bluer in the outer regions) could have smaller scale-lengths (by a factor of 10%) and higher specific SFR gradients (although possibly not larger than 0.02 dex/kpc). This would slightly displace data points with towards the upper-left zone of the plot, but to a much lesser extent than needed to correspond to the model results.
Panel (b) shows the model predictions for a timescale of the gas infall of 2 Gyr. Comparing this diagram with panel (a) we can see that the ‘isocurves’ are somewhat stretched towards the upper-right. In other words: since we are now reducing the amount of present-day gas-infall, galaxies are required to have higher specific SFR radial gradients to achieve a given present-day scale-length. This is the reason why the models shown in panel (b) predict greater values of for a given scale-length of the mass distribution. However, such short SFR timescales are expected only in elliptical and giant spiral galaxies, whereas for smaller spirals values of 7 Gyr (for which our simple model yields nearly equal results to those with ) are commonly inferred (Gavazzi et al. 2002). With our data we cannot completely discard the possibility of low values of for at least some galaxies; however, it is worth noting that the average growth of 25% found by Trujillo & Pohlen (2005) [gray line] is now a poorer average value of the whole distribution. Hence, although introducing a short SFR timescale might be appropriate for galaxies with the largest values of , it cannot solve the discrepancy between the model results and the observed data for the fraction of small disks with the highest sSFR slopes.
One possible explanation is that the use of a linear function for the temporal variation of (Eq. 3) lets the stellar mass surface density profile expand at a very similar rate to that of the SFR itself, since it inherits the growth-rate of through Eq. 5. Consequently, only certain combinations of the model parameters lead to mass profiles that grow slow enough compared with the SFR profiles so as to yield positive present-day sSFR gradients. We have run tests using other analytic functions to describe the temporal evolution of the SFR scale-length (not shown), such as an exponential function, but similar upper limits for the sSFR slope were encountered. The same limit is found when exploring different star formation histories, such as one “a la Sandage”, which consists of a delayed exponential function (Sandage 1986, Gavazzi et al. 2002). In other words: by describing the growth of the SFR radial profile with a smooth continuous function we are not allowing the model to take into account possible recent events that could have triggered new star-forming events in the outer regions of the galaxy, which would alter the current SFR profile without significantly modifying the mass distribution. Note that a similar limit is also obtained when adopting an early epoch (earlier than =1) for the onset of the inside-out (or outside-in) formation of the disks.
We now study the effects on our model of adopting a scale length for the SFR that evolves rapidly with time. As a first approximation to the real problem, we can just multiply the value of (i.e. at ) for a certain factor, without modifying the corresponding scale-length of the mass profile. Figures 7c and 7d show the results of the model using an ‘enhanced’ SFR profile at , with , where ‘linear’ refers to the original model. Such an episode of enhanced inside-out growth accomodates the high values obtained for some galaxies. However, we should point out that Figures 6c and 6e show that neither local galaxy density nor the presence of close neighbors seem to drive this enhanced inside-out growth. Figure 6e shows that the properties of neighbors (mass and distance to the galaxy) do not seem to change above the upper limit of predicted by the linear evolution model.
The opposite scenario is also possible: galaxies which have undergone a long phase of ‘linear’ disk growth since may have recently lost some of the gas in their outermost parts (possibly stripped off by a neighboring galaxy or by ram pressure stripping). In panels (e) and (f) we show how the predictions of the model change if we multiply the final value of by a factor 0.7, leading to a ‘depressed’ current SFR in the galaxy’s outermost regions. From these graphs we can conclude that the currently negative sSFR gradients seen in many galaxies could be explained either by a long-term reduction of the SFR disk (negative , panels (a) and (b)) or a recent inhibition of the star formation in the outer zones of an otherwise linearly-evolving galaxy (panels (e) and (f)).
We should point out that the smooth SFH used in our simple model is just a first approximation to the real scenario in which the star formation activity of galaxies presumably fluctuates during their lifetime. Thus, it is very likely that the present-day SFR radial distribution deviates from the one predicted by Eq. 5, so the model upper limit should be interpreted just as an time-averaged quantity. The current stellar mass surface density can be still computed with Eq. 5, since it is a cumulative parameter and the fluctuations are expected to get averaged after the integration. But the SFR is more dependent on the particular time of observation, thus increasing the dispersion in if the SF activity is currently ‘enhanced’ (even over the ‘linear’ model upper limit) or depressed.
Finally, some galaxies like NGC 4736 present bright inner rings of intense star formation that can lead to negative values of ; these kinds of (presumably) transitory events are not considered in our model either but might lead to an increase in the dispersion in the values.
7 Summary and conclusions
We have obtained specific SFR radial profiles for a sample of 161 moderately face-on spiral galaxies selected from the GALEX Atlas of Nearby Galaxies (Gil de Paz et al. 2006). Combining the FUV profiles presented in the Atlas with -band profiles measured on 2MASS images we obtained (FUV) color profiles, which were then corrected from foreground Galactic extinction and internal one. For the latter we made use of the radial extinction profiles derived by Boissier et al. (2006) from the ratio of total-infrared to FUV luminosity; for those galaxies in our sample without available TIR-to-FUV profiles, (FUVNUV) color profiles were used to infer the internal extinction through the IRX- relation. The uncertainties associated with the use of the IRX- law were considered when computing the errors in the extinction-corrected (FUV) color profiles. The sSFR profiles were inferred from relation between SFR and FUV luminosity given by Kennicutt (1998) and assuming a mass-to-light ratio .
We characterize these sSFR radial profiles through their slopes and y-intercepts, derived from the linear fit applied to each profile. Both fitting parameters are not independent one from another, yet their possible combinations can be physically constrained in terms of the total sSFR of the disk and its scale-length.
The extrapolated sSFR at seems to follow (at least qualitatively) the same trends with morphological type, mass and size as the total sSFR obtained from UV and H global photometry in previous works.
As for the sSFR gradient (), a clear trend is seen with mass and size, in the sense that whereas a large dispersion is found for small galaxies, which present both positive and negative sSFR gradients, this scatter becomes considerably reduced as we consider larger and more massive galaxies, for which the sSFR gradient is nearly flat or slightly positive, consistent with a moderate inside-out scenario of disk formation. This behavior can be reproduced to some extent by assuming a simple description of the star formation history of disks in which the typical scale-length of the radial distribution of SFR varies linearly with time. This simple assumption seems to explain the progressively more constrained values of in increasingly larger disks.
This model predicts an upper limit for for each given scale-length of the mass profile, , since the growth-rate of both the SFR and mass radial profiles are ‘coupled’. There is, however, a subset of galaxies in our sample whose sSFR slopes lie clearly above this upper boundary. This limit depends on the adopted SFR timescale, . Lower values of yield higher upper limits for , since galaxies must exhibit greater sSFR gradients to achieve a given current size if gas is depleted in shorter timescales. However, values of Gyr are usually inferred for elliptical galaxies and the earliest and most massive spirals, while late-type spirals present typically larger SFR timescales ( Gyr). Although we must not simply discard such low values of , it should also be noted that empirical measurements of the disk-growth since (Trujillo & Pohlen 2005) are in better agreement with our model if higher values of are used.
Recent deviations from the continuous growth of the SFR radial distribution could account for the observed excess in the sSFR slopes for these galaxies, with present-day scale-lengths of the SFR being much larger than in the past. When studying the possible dependence of on the environment, however, no clear correlation is found. Disks with very high sSFR gradients do not seem to exhibit neither different local galaxy densities nor closer and more massive neighbors than the rest of the galaxies in the sample. This could be due either to lack of robustness in our estimators of the environment properties or to the fact that interactions with surrounding galaxies could actually modify the sSFR profiles in different ways, depending on the geometry of the interaction, its timescale, etc. Temporal fluctuations of the SFH (not necessarily related to environmental properties) might also account for the observed dispersion of sSFR gradients.
Disks with currently negative sSFR slopes can be modeled with a decreasing scale-length of the SFR (outside-in formation), but other scenarios are also feasible. Ram-pressure stripping or transitory episodes of enhanced star formation in the inner parts of the disk can lead to a currently smaller SFR scale-length than in the past; recent reductions of 30% or even lower are enough to yield negative present sSFR gradients even for galaxies that had been evolving inside-out since the formation of their thin disks.
Appendix A Deriving sSFR from (FUV)
The SFR can be computed from the apparent magnitude in the FUV (in the AB system) using the calibration given by Kennicutt (1998):
| (A1) |
Similarly, the K-band surface brightness profiles can be converted into stellar mass surface density profiles as follows:
| (A2) |
where is the stellar mass-to-light ratio in solar units, and 3.33 is the absolute K-band magnitude of the Sun in the Vega system (Worthey 1994). Therefore, combining the previous equations we can derive the specific SFR:
| (A3) |
Appendix B Deriving the msSFR - sSFR0 relation
Since light profiles of disks can be approximately described with an exponential law, SFR and stellar mass surface densities may be modeled in the same way:
| (B1a) | |||||
| (B1b) | |||||
where and are the central SFR and mass surface densities, and and are the length scales of both distributions. The total sSFR of the disk can be computed by integrating B1a and B1b from to to obtain the total SFR and mass and then dividing both quantities. Strictly speaking, a different choice of the integration limits would not affect the total sSFR, since the functional form of B1a and B1b is the same. In fact, from dimensional considerations alone it is evident that the total mass of the disk , and similarly with the same proportionality factor. Therefore,
| (B2) |
Dividing B1a by B1b we obtain the specific SFR as a function of . From the resulting expression we can write as a function of both scale lengths:
| (B3) |
Combining eqs. B2 and B3 to eliminate we obtain:
| (B4) |
Appendix C Mathematical details of the modeling of the sSFR profiles
As explained in Section 5, we compute the present-day specific SFR as:
| (C1) |
The resulting expression for cannot be expressed in a simple analytical form, and first order approximations lead to oversimplified results, where both and expand at the same rate, that is, and hence . Therefore, we opted to derive the sSFR profiles numerically, computing the integral in the previous expression using the Gauss-Legendre quadrature algorithm:
| (C2) |
where the abscissas and their corresponding weights can be derived from the Legendre polynomial . Due to the low computational cost but high accuracy of this method we decided to use .
The resulting and profiles slightly deviate from an exponential law, but and can still be properly described by a straight line. Since in principle could depend on , we obtain an initial guess on by fitting our model profiles between and kpc. All subsequent fits needed to obtain the final values for and are performed between 1.5 and 4.0. These limits were those used in the numerical N-body simulations by Brook et al. (2006) and are consistent with the values of (average value 0.8; see Section 4.1 and Table 3) and the outermost radial data-point measured in the 2MASS -band images of the galaxies in our sample (average value 4.4; see Table 2). For the initial guess on differs from the finally adopted value by less than 10% for 93% of the simulated profiles, with the difference being less than 20% for the rest.
References
- (1) Balogh, M.L., Baldry, I.K., Nichol, R., Miller, C., Bower, R., & Glazebrook, K., 2004, ApJ, 615, 101
- (2) Barden, M. et al., 2005, ApJ, 635, 959
- (3) Bell, E.F. & de Jong, R.S., 2001, ApJ, 550, 212
- (4) Bell, E.F., McIntosh, D.H., Katz, N., & Weinberg, M.D. 2003, ApJS, 149, 289
- (5) Block, D. L., Freeman, K. C., Jarrett, T. H., Puerari, I., Worthey, G., Combes, F., & Groess, R., 2004, A&A, 425, L37
- (6) Boissier, S. & Prantzos, N., 1999, MNRAS, 307, 857
- (7) Boissier, S. et al., 2006, ApJS, in press (astro-ph/0609071)
- (8) Boselli, A., Gavazzi, G., Donas, J., & Scodeggio, M., 2001, AJ, 121, 753
- (9) Brook, C.B., Kawata, D., Martel, H., Gibson, B.K., & Bailin, J., 2006, ApJ, 639, 126
- (10) Buat, V. et al., 2005, ApJ, 619, 51
- (11) Cardelli, J.A., Clayton, G.C., & Mathis, J.S., 1989, ApJ, 345, 245
- (12) Chiappini, C., Matteucci, F., & Gratton, R., 1997, ApJ, 477, 765
- (13) Cortese et al., 2006, ApJ, 637, 242
- (14) de Jong, R.S., 1996, A&A, 313, 377
- (15) de Vaucouleurs, G., de Vaucouleurs, A., Corwin, H.G., Buta, R.J., Paturel, G., & Fouqué, P., 1991, Third Reference Catalogue of Bright Galaxies (RC3) (Springer-Verlag)
- (16) Fukugita, M., Shimasaku, K., & Ichikawa, T., 1995, PASP, 107, 945
- (17) Gavazzi, G. Bonfanti, C., Sanvito, G., Boselli, A., & Scodeggio, M., 2002, ApJ, 576, 135
- (18) Gil de Paz, A. & Madore, B.F., 2005, ApJS, 156, 345
- (19) Gil de Paz, A. et al., 2006, ApJS, in press (astro-ph/0606440)
- (20) Guthrie, B.N.G., 1992, A&AS, 93, 255
- (21) James, P.A. et al., 2004, A&A, 414, 23
- (22) Jarrett, T.H., Chester, T., Cutri, R., Schneider, S., Skrutskie, M. & Huchra, J. 2000, AJ, 119, 2498
- (23) Jarrett, T.H., Chester, T., Cutri, R., Schneider, S.E., & Huchra, J.P., 2003, AJ, 125, 525
- (24) Kennicutt, R.C.Jr., 1998, ARA&A, 36, 189
- (25) Leitherer, C. et al., 1999, ApSJ, 123, 3
- (26) Madau, P., Pozzetti, L., & Dickinson, M., 1998, ApJ, 498, 106
- (27) Matteucci, F., & François, P., 1989, MNRAS, 239, 885
- (28) Meurer, G.R., Heckman, T.M., & Calzetti, D., 1999, ApJ, 521, 64
- (29) Mo, H.J., Mao, S., & White, S.D.M, 1998, MNRAS, 295, 319
- (30) Peletier, R.F. & Balcells, M., 1996, AJ, 111, 2238
- (31) Portinari, L., Sommer-Larsen, J., & Tantalo, R., 2004, MNRAS, 347, 691
- (32) Prantzos, N., & Boissier, S., 2000, MNRAS, 313, 338
- (33) Press, W.H., Teukolsky, S.A., Vetterling, W.T., & Flannery, B.P., 1992, Numerical recipes in C. The art of scientific computing (Cambridge: University Press)
- (34) Samland, M. & Gerhard, O.E., 2003, A&A, 399, 961
- (35) Sandage, A. R., 1986, A&A, 161, 89
- (36) Schlegel, D.J., Finkbeiner, D.P., & Davis, M., 1998, ApJ, 500, 525
- (37) Sommer-Larsen, J., Götz, M. & Portinari, L. , 2003, ApJ, 596, 47
- (38) Taylor, V.A., Jansen, R.A., Windhorst, R.A., Odewahn, S.C., & Hibbard, J.E., 2005, ApJ, 630, 784
- (39) Trujillo, I. & Pohlen, M., 2005, ApJ, 630, 17
- (40) Trujillo, I. et al., 2004, ApJ, 604, 521
- (41) Trujillo, I. et al., 2006, ApJ, 650, 18
- (42) White, S.D.M & Frenk, C.S., 1991, ApJ, 379, 52
- (43) Worthey, G., 1994, ApJS, 95, 107
| Object name | RA2000 | DEC2000 | D25 | E(BV) | dist | mFUV | mK | ||
|---|---|---|---|---|---|---|---|---|---|
| (h:m:s) | (d:m:s) | (arcmin) | (deg) | (mag) | type | (Mpc) | (mag) | (mag) | |
| (1) | (2) | (3) | (4) | (5) | (6) | (7) | (8) | (9) | (10) |
| PGC 00282 | 00 04 01.5 | 11 10 27.3 | 1.1 | 35 | 0.035 | 5 | 161 | 16.290.04 | 12.560.13 |
| ARP 256 NED02 | 00 18 50.1 | 10 21 41.8 | 1.1 | 44 | 0.036 | 4.5 | 116 | 15.830.01 | 11.820.09 |
| NGC 0099 | 00 23 59.4 | +15 46 13.5 | 1.4 | 22 | 0.056 | 6 | 77 | 15.130.01 | 11.760.10 |
| VV 548 | 00 36 02.0 | 09 53 18.7 | 1.2 | 34 | 0.038 | 5 | 69 | 15.670.01 | 12.270.16 |
| NGC 0165 | 00 36 28.9 | 10 06 22.2 | 1.5 | 30 | 0.034 | 4 | 83 | 16.60.01 | 10.370.07 |
| UGC 00372 | 00 37 27.9 | +42 54 08.1 | 1.5 | 23 | 0.065 | 9 | 80 | 16.950.04 | 13.720.21 |
| PGC 02269 | 00 37 57.5 | 09 15 09.3 | 1.4 | 31 | 0.035 | 6 | 74 | 15.640.02 | 11.600.12 |
| NGC 0195 | 00 39 35.8 | 09 11 40.3 | 1.1 | 44 | 0.033 | 1 | 69 | 17.640.07 | 10.360.04 |
| NGC 0213 | 00 41 10.0 | +16 28 09.8 | 1.7 | 35 | 0.042 | 1 | 79 | 16.330.03 | 9.910.04 |
| ESO 540- G025 | 00 47 37.9 | 20 31 10.2 | 1.0 | 26 | 0.018 | 4.5 | 89 | 15.910.02 | 12.520.13 |
| NGC 0262 | 00 48 47.1 | +31 57 25.1 | 1.1 | 0 | 0.067 | 0 | 66 | 16.170.01 | 10.100.05 |
| NGC 0266 | 00 49 47.8 | +32 16 39.8 | 3.0 | 15 | 0.069 | 2 | 68 | 15.730.01 | 8.670.02 |
| NGC 0300 | 00 54 53.5 | 37 41 03.8 | 21.9 | 45 | 0.013 | 7 | 2.0 | 10.210.01 | 6.380.06 |
| PGC 03613 | 01 00 38.1 | 07 58 51.8 | 1.3 | 23 | 0.102 | 5 | 82 | 17.240.07 | 10.100.06 |
| IC 1616 | 01 04 56.2 | 27 25 45.7 | 1.6 | 29 | 0.019 | 4.3 | 78 | 15.850.01 | 9.870.04 |
| ESO 296- G002 | 01 09 02.6 | 37 17 20.0 | 1.2 | 34 | 0.012 | 1.1 | 91 | 16.790.02 | 10.500.06 |
| NGC 0479 | 01 21 15.7 | +03 51 44.2 | 1.1 | 36 | 0.035 | 3.7 | 74 | 16.490.03 | 11.820.10 |
| NGC 0491 | 01 21 20.4 | 34 03 47.8 | 1.4 | 45 | 0.03 | 3 | 52 | 15.780.01 | 9.390.02 |
| UGC 00910 | 01 21 58.3 | +15 47 42.5 | 1.0 | 26 | 0.069 | 5 | 91 | 16.340.02 | 12.180.13 |
| NGC 0514 | 01 24 03.9 | +12 55 02.6 | 3.5 | 37 | 0.039 | 5 | 36 | 14.590.01 | 9.140.09 |
| ESO 352- G069 | 01 24 14.1 | 34 43 34.7 | 1.5 | 38 | 0.024 | 2.2 | 84 | 16.340.01 | 10.590.05 |
| MESSIER 033 | 01 33 50.9 | +30 39 35.8 | 70.8 | 54 | 0.042 | 6 | 0.84 | 7.990.01 | 2.840.04 |
| NGC 0628 | 01 36 41.8 | +15 47 00.5 | 10.5 | 25 | 0.070 | 5 | 11 | 11.70.01 | 6.840.05 |
| NGC 0706 | 01 51 50.5 | +06 17 48.8 | 1.9 | 43 | 0.058 | 4 | 71 | 15.520.01 | 9.520.03 |
| PGC 07210 | 01 55 51.3 | 09 58 00.5 | 1.3 | 40 | 0.023 | 4.5 | 115 | 15.830.05 | 11.650.09 |
| KUG 0156-084 | 01 58 51.9 | 08 09 44.8 | 1.2 | 34 | 0.028 | 4.6 | 67 | 15.780.02 | 12.220.09 |
| NGC 0772 | 01 59 19.6 | +19 00 27.1 | 7.2 | 54 | 0.073 | 3 | 36 | 140.02 | 7.200.04 |
| NGC 0787 | 02 00 48.6 | 09 00 09.3 | 2.5 | 41 | 0.028 | 3 | 67 | 16.650.01 | 9.470.03 |
| NGC 0783 | 02 01 06.6 | +31 52 56.9 | 1.6 | 29 | 0.061 | 5 | 76 | 15.250.01 | 9.680.04 |
| UGC 01593 | 02 06 06.0 | +13 17 06.8 | 1.0 | 37 | 0.093 | 5 | 106 | 16.490.01 | |
| UGC 01603 | 02 06 42.5 | 00 51 37.7 | 1.2 | 35 | 0.036 | 8 | 84 | 16.760.05 | 12.930.14 |
| KUG 0210-078 | 02 13 15.8 | 07 39 42.8 | 1.7 | 41 | 0.026 | 1 | 67 | 16.210.01 | 10.910.02 |
| NGC 0881 | 02 18 45.3 | 06 38 20.7 | 2.2 | 47 | 0.029 | 5 | 74 | 16.440.01 | 9.370.04 |
| NGC 0895 | 02 21 36.5 | 05 31 17.0 | 3.6 | 44 | 0.025 | 6 | 31 | 14.110.01 | 9.400.05 |
| NGC 0906 | 02 25 16.3 | +42 05 23.6 | 1.8 | 28 | 0.068 | 2 | 69 | 16.680.01 | 9.920.04 |
| PGC 09333 | 02 27 17.6 | 03 53 58.2 | 1.1 | 36 | 0.029 | 8 | 186 | 17.720.02 | 11.830.09 |
| NGC 0986 | 02 33 34.3 | 39 02 42.2 | 3.9 | 41 | 0.019 | 2 | 25 | 14.810.01 | 7.780.03 |
| KUG 0232-079 | 02 34 48.4 | 07 41 00.9 | 1.1 | 25 | 0.034 | 5 | 93 | 15.720.01 | 10.740.05 |
| NGC 0991 | 02 35 32.7 | 07 09 16.0 | 2.7 | 27 | 0.028 | 5 | 20 | 14.350.01 | 11.180.05 |
| NGC 1022 | 02 38 32.7 | 06 40 38.7 | 2.4 | 34 | 0.026 | 1 | 19 | 16.910.01 | 8.500.02 |
| NGC 1033 | 02 40 16.1 | 08 46 37.1 | 1.3 | 32 | 0.028 | 5 | 103 | 16.860.03 | 10.760.08 |
| NGC 1042 | 02 40 24.0 | 08 26 00.8 | 4.7 | 40 | 0.029 | 6 | 18 | 13.460.01 | 8.850.05 |
| NGC 1068 | 02 42 40.7 | 00 00 47.8 | 7.1 | 33 | 0.034 | 3 | 14 | 12.520.01 | |
| NGC 1067 | 02 43 50.5 | +32 30 42.8 | 1.0 | 0 | 0.188 | 5 | 66 | 16.140.03 | 11.040.07 |
| NGC 1097 | 02 46 19.1 | 30 16 29.7 | 9.3 | 48 | 0.027 | 3 | 15 | 12.50.04 | 6.250.03 |
| NGC 1291 | 03 17 18.6 | 41 06 29.1 | 9.8 | 35 | 0.013 | 0 | 9.7 | 14.230.01 | 5.660.02 |
| NGC 1285 | 03 17 53.4 | 07 17 52.1 | 1.5 | 43 | 0.054 | 3 | 73 | 15.020.01 | 10.150.05 |
| NGC 1310 | 03 21 03.4 | 37 06 06.1 | 2.0 | 42 | 0.023 | 5 | 22 | 15.070.01 | 9.940.05 |
| KUG 0319-072 | 03 22 17.5 | 07 05 26.5 | 1.1 | 25 | 0.071 | 2 | 37 | 15.610.01 | 10.310.05 |
| NGC 1317 | 03 22 44.3 | 37 06 13.6 | 2.8 | 32 | 0.021 | 1 | 19 | 15.380.01 | 7.740.02 |
| NGC 1326 | 03 23 56.4 | 36 27 52.8 | 3.9 | 47 ‡ | 0.019 | 1 | 16 | 14.60.07 | 7.450.02 |
| PGC 13535 | 03 40 43.0 | 06 24 54.6 | 1.9 | 38 | 0.054 | 6 | 73 | 15.880.03 | 10.980.09 |
| PGC 13600 | 03 42 10.3 | 06 45 55.2 | 1.8 | 40 | 0.071 | 0 | 73 | 17.490.32 | 10.980.05 |
| NGC 1512 | 04 03 54.3 | 43 20 55.9 | 8.9 | 52 | 0.011 | 1 | 10 | 13.460.02 | 7.480.04 |
| NGC 1566 | 04 20 00.4 | 54 56 16.1 | 8.3 | 38 | 0.009 | 4 | 17 | 12.060.02 | 6.890.03 |
| NGC 2442 | 07 36 23.8 | 69 31 51.0 | 5.5 | 27 | 0.203 | 3.7 | 14 | 12.590.02 | 6.870.04 |
| NGC 2403 | 07 36 51.4 | +65 36 09.2 | 21.9 | 56 | 0.040 | 6 | 3.2 | 10.370.01 | 6.190.04 |
| NGC 2500 | 08 01 53.2 | +50 44 13.6 | 2.9 | 26 | 0.040 | 7 | 9.9 | 13.520.01 | 9.280.06 |
| NGC 2550A | 08 28 39.9 | +73 44 52.8 | 1.6 | 29 | 0.026 | 5 | 56 | 15.290.01 | 10.050.08 |
| NGC 2681 | 08 53 32.7 | +51 18 49.3 | 3.6 | 24 | 0.023 | 0 | 13 | 16.540.01 | 7.430.03 |
| UGC 04684 | 08 56 40.7 | +00 22 29.8 | 1.4 | 40 | 0.04 | 8 | 35 | 15.630.01 | 12.240.14 |
| UGC 04807 | 09 10 05.5 | +54 34 49.1 | 1.0 | 0 | 0.021 | 6 | 60 | 16.240.01 | 11.750.12 |
| NGC 2782 | 09 14 05.1 | +40 06 49.2 | 3.5 | 43 | 0.016 | 1 | 39 | 14.690.01 | 8.870.02 |
| NGC 2903 | 09 32 10.1 | +21 30 03.0 | 12.6 | 63 | 0.031 | 4 | 8.9 | 12.120.01 | 6.040.02 |
| MESSIER 081 | 09 55 33.2 | +69 03 55.1 | 26.9 | 60 | 0.08 | 2 | 3.6 | 10.770.01 | 3.830.02 |
| UGC 05493 | 10 11 17.9 | +00 26 32.6 | 1.6 | 36 | 0.037 | 4.5 | 52 | 15.950.01 | 11.090.08 |
| UGC 05528 | 10 14 39.6 | 00 49 51.2 | 1.1 | 44 | 0.042 | 1 | 210 | 18.630.08 | 10.850.07 |
| NGC 3147 | 10 16 53.7 | +73 24 02.7 | 3.9 | 26 | 0.024 | 4 | 44 | 14.140.01 | 7.410.02 |
| NGC 3183 | 10 21 49.0 | +74 10 36.7 | 2.3 | 53 | 0.044 | 3.5 | 48 | 15.160.01 | 9.240.02 |
| ESO 317- G019 | 10 23 02.3 | 39 09 59.6 | 1.1 | 36 | 0.102 | 1 | 38 | 16.920.03 | 10.770.09 |
| NGC 3244 | 10 25 28.8 | 39 49 39.2 | 2.0 | 42 | 0.104 | 6 | 37 | 14.580.02 | 9.610.05 |
| NGC 3277 | 10 32 55.5 | +28 30 42.2 | 1.9 | 27 | 0.026 | 2 | 22 | 15.780.01 | 8.930.02 |
| NGC 3288 | 10 36 25.7 | +58 33 22.3 | 1.1 | 36 | 0.008 | 3.7 | 120 | 17.610.01 | 10.900.06 |
| NGC 3344 | 10 43 31.2 | +24 55 20.0 | 7.1 | 24 | 0.033 | 4 | 6.9 | 12.430.01 | 7.440.04 |
| MESSIER 095 | 10 43 57.7 | +11 42 13.0 | 7.4 | 48 | 0.028 | 3 | 12 | 13.280.01 | 6.660.04 |
| NGC 3353 | 10 45 22.4 | +55 57 37.4 | 1.3 | 40 | 0.007 | 3 | 17 | 14.690.01 | 10.610.05 |
| MESSIER 096 | 10 46 45.7 | +11 49 11.8 | 7.6 | 48 | 0.025 | 2 | 14 | 14.030.01 | 6.320.02 |
| UGC 05943 | 10 50 13.5 | 01 17 24.7 | 1.1 | 35 | 0.051 | 4.5 | 65 | 16.260.01 | 12.010.11 |
| NGC 3394 | 10 50 39.8 | +65 43 38.0 | 1.9 | 43 | 0.012 | 5 | 52 | 15.790.01 | 10.140.09 |
| NGC 3445 | 10 54 35.5 | +56 59 26.6 | 1.6 | 22 | 0.008 | 9 | 32 | 14.130.01 | 10.610.08 |
| NGC 3470 | 10 58 44.9 | +59 30 38.5 | 1.4 | 32 | 0.012 | 2 | 97 | 16.380.01 | 10.690.05 |
| NGC 3486 | 11 00 24.0 | +28 58 29.3 | 7.1 | 43 | 0.022 | 5 | 12 | 12.520.01 | 8.000.04 |
| IC 0671 | 11 07 31.6 | +00 46 59.2 | 1.3 | 23 | 0.04 | 4.2 | 169 | 17.220.02 | 10.310.08 |
| NGC 3821 | 11 42 09.1 | +20 18 56.6 | 1.4 | 22 | 0.022 | 2 | 84 | 17.910.37 | 10.150.03 |
| NGC 3840 | 11 43 59.0 | +20 04 37.3 | 1.1 | 44 | 0.022 | 1 | 107 | 16.790.02 | 10.890.06 |
| NGC 3861 | 11 45 03.9 | +19 58 25.1 | 2.3 | 56 | 0.032 | 3 | 91 | 15.720.01 | 9.970.04 |
| NGC 4108 | 12 06 44.6 | +67 09 47.5 | 1.7 | 35 | 0.018 | 5.3 | 40 | 14.890.01 | 9.810.03 |
| NGC 4108B | 12 07 11.6 | +67 14 06.6 | 1.3 | 32 | 0.018 | 6.8 | 42 | 15.480.01 | 12.870.13 |
| NGC 4136 | 12 09 17.7 | +29 55 39.4 | 4.0 | 22 | 0.018 | 5 | 11 | 13.610.01 | 9.310.06 |
| NGC 4303 | 12 21 54.9 | +04 28 25.1 | 6.5 | 27 | 0.022 | 4 | 17 | 12.080.01 | 6.840.03 |
| NGC 4301 | 12 22 27.2 | +04 33 58.7 | 1.5 | 30 | 0.024 | 5.5 | 17 | 14.550.01 | 11.200.10 |
| NGC 4314 | 12 22 32.0 | +29 53 43.3 | 4.2 | 29 | 0.025 | 1 | 16 | 15.490.01 | 7.450.02 |
| NGC 4395 | 12 25 48.9 | +33 32 48.3 | 13.2 | 37 | 0.017 | 9 | 4.2 | 11.670.01 | 9.980.06 |
| NGC 4421 | 12 27 02.6 | +15 27 40.9 | 2.7 | 43 | 0.024 | 0 | 17 | 18.750.08 | 8.800.02 |
| NGC 4440 | 12 27 53.6 | +12 17 35.6 | 1.9 | 39 | 0.027 | 1 | 17 | 18.920.08 | 8.910.02 |
| MESSIER 058 | 12 37 43.6 | +11 49 05.1 | 5.9 | 37 | 0.041 | 3 | 17 | 14.480.01 | 6.490.03 |
| NGC 4618 | 12 41 32.8 | +41 08 41.2 | 4.2 | 40 | 0.021 | 9 | 9.5 | 12.780.01 | 8.660.06 |
| NGC 4625 | 12 41 52.7 | +41 16 25.4 | 2.2 | 33 | 0.018 | 9 | 9.5 | 14.450.01 | 9.740.05 |
| NGC 4665 | 12 45 06.0 | +03 03 20.6 | 3.8 | 33 | 0.024 | 0 | 17 | 16.510.17 | 7.430.02 |
| NGC 4691 | 12 48 13.6 | 03 19 57.8 | 2.8 | 36 | 0.027 | 0 | 16 | 13.660.01 | 8.540.03 |
| NGC 4736 | 12 50 53.1 | +41 07 13.6 | 11.2 | 37 | 0.018 | 2 | 5.2 | 11.830.01 | 5.110.02 |
| NGC 4819 | 12 56 27.8 | +26 59 14.9 | 1.2 | 42 | 0.011 | 1 | 95 | 19.30.01 | 10.120.03 |
| UGC 08340 | 13 16 35.5 | 02 05 28.8 | 1.0 | 0 | 0.032 | 6 | 81 | 16.470.01 | 11.000.08 |
| MESSIER 051a | 13 29 52.7 | +47 11 42.6 | 11.2 | 53 | 0.035 | 4 | 8.4 | 10.890.01 | 5.500.02 |
| NGC 5231 | 13 35 48.2 | +02 59 56.1 | 1.1 | 25 | 0.024 | 1 | 94 | 17.850.02 | 10.140.05 |
| MESSIER 083 | 13 37 00.9 | 29 51 56.7 | 12.9 | 27 | 0.066 | 5 | 4.5 | 10.10.01 | 4.620.02 |
| ESO 444- G087 | 13 38 12.0 | 31 25 01.1 | 1.2 | 42 | 0.056 | 1 | 61 | 16.930.05 | 10.310.04 |
| MESSIER 101 | 14 03 12.6 | +54 20 56.7 | 28.8 | 21 | 0.009 | 6 | 7.5 | 9.980.01 | 5.510.05 |
| NGC 5474 | 14 05 01.6 | +53 39 44.0 | 4.8 | 27 | 0.011 | 6 | 6.8 | 12.930.01 | 9.480.04 |
| UGC 09120 | 14 15 12.3 | +04 49 26.9 | 1.1 | 44 | 0.033 | 6 | 83 | 15.770.01 | 11.770.13 |
| NGC 5569 | 14 20 32.1 | +03 58 59.6 | 1.7 | 35 | 0.030 | 6 | 27 | 15.710.01 | 12.320.15 |
| NGC 5656 | 14 30 25.4 | +35 19 14.6 | 1.9 | 39 | 0.015 | 2 | 48 | 15.570.01 | 9.350.02 |
| NGC 5701 | 14 39 11.1 | +05 21 48.8 | 4.3 | 18 | 0.037 | 0 | 23 | 14.980.01 | 8.140.03 |
| NGC 5713 | 14 40 11.5 | 00 17 21.2 | 2.8 | 27 | 0.039 | 4 | 27 | 14.620.01 | 8.330.04 |
| IC 1063 | 14 52 11.0 | +04 40 55.4 | 1.3 | 32 | 0.038 | 3 | 201 | 16.990.03 | 10.830.06 |
| UGC 09661 | 15 02 03.5 | +01 50 28.2 | 1.4 | 75 | 0.059 | 8 | 19 | 15.570.02 | 11.860.15 |
| NGC 6154 | 16 25 30.5 | +49 50 24.9 | 2.1 | 18 | 0.022 | 1 | 90 | 16.650.03 | 10.190.04 |
| IC 1221 | 16 34 41.6 | +46 23 31.8 | 1.3 | 32 | 0.018 | 7 | 81 | 15.850.01 | 10.990.12 |
| IC 1222 | 16 35 09.1 | +46 12 51.0 | 1.7 | 40 | 0.018 | 5 | 136 | 16.170.01 | 12.200.12 |
| NGC 6307 | 17 07 40.5 | +60 45 03.0 | 1.3 | 41 | 0.023 | 0 | 48 | 19.220.13 | 9.480.03 |
| IC 1251 | 17 10 13.2 | +72 24 38.5 | 1.4 | 45 | 0.050 | 6 | 21 | 15.770.01 | 12.070.11 |
| NGC 6340 | 17 10 24.9 | +72 18 15.8 | 3.2 | 21 | 0.049 | 0 | 21 | 17.390.01 | 8.390.02 |
| IC 1248 | 17 11 40.2 | +59 59 44.2 | 1.3 | 23 | 0.024 | 5 | 76 | 16.110.01 | 11.710.10 |
| UGC 10796 | 17 16 47.7 | +61 55 12.4 | 1.6 | 42 | 0.020 | 3 | 48 | 16.160.01 | 12.140.12 |
| NGC 6373 | 17 24 08.1 | +58 59 42.3 | 1.3 | 40 | 0.030 | 5 | 52 | 15.850.01 | 12.520.12 |
| UGC 10888 | 17 29 59.3 | +60 21 01.0 | 1.1 | 51 | 0.036 | 3 | 92 | 16.970.03 | 10.680.05 |
| IC 4836 | 19 16 17.9 | 60 12 01.2 | 1.5 | 30 | 0.055 | 4.3 | 56 | 15.470.01 | 10.030.03 |
| NGC 6770 | 19 18 37.3 | 60 29 47.3 | 2.3 | 43 | 0.061 | 3 | 52 | 15.480.04 | 8.860.04 |
| IC 4845 | 19 20 22.5 | 60 23 21.0 | 1.8 | 34 | 0.059 | 2.9 | 53 | 15.640.01 | 8.920.02 |
| NGC 6782 | 19 23 57.9 | 59 55 20.9 | 2.2 | 52 | 0.060 | 0.8 | 50 | 15.570.25 | 8.870.02 |
| NGC 6902B | 20 23 07.1 | 43 52 07.0 | 1.5 | 30 | 0.050 | 5.6 | 40 | 15.430.01 | 11.950.09 |
| NGC 6902 | 20 24 28.1 | 43 39 12.7 | 5.6 | 46 | 0.040 | 3.1 | 38 | 14.040.01 | 8.610.04 |
| NGC 6951 | 20 37 14.1 | +66 06 20.3 | 3.9 | 35 | 0.366 | 4 | 24 | 14.620.18 | 7.220.02 |
| PGC 65328 | 20 45 41.2 | 04 57 00.4 | 1.3 | 0 | 0.052 | 2 | 123 | 16.740.03 | 11.190.07 |
| NGC 6962 | 20 47 19.1 | +00 19 14.9 | 2.9 | 38 | 0.098 | 2 | 61 | 15.690.01 | 8.790.03 |
| PGC 66559 | 21 19 43.0 | 07 33 12.5 | 1.3 | 23 | 0.196 | 8 | 39 | 15.550.06 | 15.110.26 |
| NGC 7080 | 21 30 02.0 | +26 43 04.1 | 1.8 | 19 | 0.140 | 3 | 71 | 16.310.05 | 9.400.04 |
| UGC 11790 | 21 41 30.0 | +00 53 40.7 | 1.5 | 43 | 0.072 | 6.5 | 65 | 16.840.03 | 11.390.10 |
| UGC 11816 | 21 49 07.3 | +00 26 50.4 | 1.5 | 21 | 0.130 | 4.7 | 68 | 15.960.04 | 11.450.12 |
| NGC 7167 | 22 00 30.6 | 24 37 57.4 | 1.7 | 40 | 0.037 | 5 | 35 | 14.840.01 | 9.940.06 |
| NGC 7221 | 22 11 15.2 | 30 33 47.4 | 2.0 | 37 | 0.018 | 3.6 | 60 | 15.280.01 | 9.190.03 |
| NGC 7337 | 22 37 26.6 | +34 22 27.5 | 1.1 | 35 | 0.083 | 3 | 96 | 18.130.06 | 10.390.05 |
| NGC 7343 | 22 38 37.9 | +34 04 17.2 | 1.1 | 36 | 0.067 | 3.5 | 109 | 16.550.02 | 10.470.04 |
| ESO 346- G006 | 22 52 39.3 | 40 19 49.3 | 1.0 | 26 | 0.015 | 5 | 137 | 16.760.01 | 11.190.06 |
| NGC 7418 | 22 56 36.2 | 37 01 48.3 | 3.5 | 42 | 0.016 | 6 | 18 | 13.760.01 | 8.520.05 |
| NGC 7421 | 22 56 54.3 | 37 20 50.1 | 2.0 | 26 | 0.015 | 4 | 24 | 14.940.01 | 9.250.04 |
| ARP 314 NED01 | 22 58 02.2 | 03 46 10.9 | 1.1 | 36 | 0.087 | 4 | 52 | 15.570.01 | 10.450.05 |
| ARP 314 NED02 | 22 58 07.5 | 03 47 19.6 | 1.3 | 32 | 0.085 | 6 | 52 | 15.310.01 | 10.910.09 |
| NGC 7469 | 23 03 15.6 | +08 52 26.4 | 1.5 | 44 | 0.069 | 1 | 71 | 14.320.02 | |
| NGC 7479 | 23 04 56.7 | +12 19 22.4 | 4.1 | 41 | 0.112 | 5 | 35 | 13.930.01 | 8.200.02 |
| IC 5287 | 23 09 20.3 | +00 45 23.3 | 1.1 | 25 | 0.040 | 3 | 139 | 17.530.03 | 10.840.06 |
| NGC 7496 | 23 09 47.3 | 43 25 40.6 | 3.3 | 25 | 0.010 | 3 | 21 | 14.010.01 | 8.650.04 |
| NGC 7535 | 23 14 12.8 | +13 34 54.8 | 1.5 | 0 | 0.066 | 7 | 67 | 16.020.05 | |
| NGC 7552 | 23 16 10.8 | 42 35 05.4 | 3.4 | 38 | 0.014 | 2 | 22 | 14.180.01 | 7.540.02 |
| NGC 7645 | 23 23 47.3 | 29 23 16.9 | 1.4 | 31 | 0.028 | 5 | 97 | 15.780.01 | 10.250.04 |
| NGC 7673 | 23 27 41.1 | +23 35 20.2 | 1.3 | 23 | 0.043 | 5 | 50 | 14.310.01 | 10.730.03 |
| NGC 7674 | 23 27 56.7 | +08 46 44.5 | 1.1 | 25 | 0.059 | 4 | 124 | 15.730.01 | 9.790.04 |
| IC 5325 | 23 28 43.4 | 41 20 00.5 | 2.8 | 27 | 0.020 | 4 | 19 | 14.020.01 | 8.360.03 |
| UGC 12635 | 23 30 25.7 | +00 09 24.1 | 1.3 | 23 | 0.048 | 6.5 | 74 | 17.270.04 | 13.680.19 |
| NGC 7769 | 23 51 04.0 | +20 09 01.5 | 1.7 | 20 | 0.074 | 3 | 61 | 14.760.01 | 8.930.02 |
| NGC 7793 | 23 57 49.8 | 32 35 27.7 | 9.3 | 48 | 0.019 | 7 | 2.0 | 11.170.01 | 6.860.06 |
Note. — Sample. (1): Galaxy name. (2): RA(J2000) of the galaxy center. (3): DEC(J2000) of the galaxy center. (4): Apparent major isophotal diameter at =25 mag arcsec-2 from the RC3 catalog. (5): Inclination angle, corrected for intrinsic thickness. ‡Note that for NGC 1326 was assumed, since no value for is available. (6): Galactic color excess from Schlegel et al. (1998). (7): Morphological type T as given in the RC3 catalog. (8): Distance to the galaxy, rounded to the nearest Mpc when larger than 10 Mpc. (9): Apparent magnitude (AB system). (10): Apparent -band magnitude (Vega system).
| (FUVK)obs | AFUV | (FUVK)corr | log(sSFR) | ||||
|---|---|---|---|---|---|---|---|
| (arcsec) | (kpc) | (mag arcsec-2) | (mag arcsec-2) | (mag) | (mag) | (mag) | (10-11 yr-1) |
| (1) | (2) | (3) | (4) | (5) | (6) | (7) | (8) |
| PGC 00282 | |||||||
| 6 | 4.69 | 24.64 0.07 | 19.19 0.09 | 5.45 0.11 | 1.38 | 4.14 | 0.89 |
| 12 | 9.38 | 24.37 0.06 | 20.12 0.16 | 4.25 0.17 | 0.86 | 3.42 | 1.18 |
| 18 | 14.07 | 24.35 0.03 | 20.58 0.24 | 3.77 0.25 | 1.01 | 2.81 | 1.43 |
| 24 | 18.76 | 25.06 0.04 | 21.36 0.40 | 3.70 0.40 | 0.89 | 2.85 | 1.41 |
| ARP 256 NED02 | |||||||
| 6 | 3.37 | 22.91 0.02 | 18.19 0.10 | 4.72 0.10 | 1.08 | 3.69 | 1.07 |
| 12 | 6.75 | 23.76 0.03 | 19.44 0.15 | 4.32 0.16 | 1.57 | 2.82 | 1.42 |
| 18 | 10.12 | 25.08 0.03 | 20.72 0.37 | 4.36 0.37 | 1.82 | 2.62 | 1.50 |
| 24 | 13.49 | 25.19 0.03 | 20.95 0.41 | 4.24 0.41 | 1.36 | 2.95 | 1.37 |
| 30 | 16.86 | 25.70 0.03 | 21.93 0.75 | 3.77 0.75 | 1.21 | 2.61 | 1.50 |
| NGC 0099 | |||||||
| 6 | 2.23 | 23.12 0.02 | 18.30 0.06 | 4.82 0.06 | 1.25 | 3.62 | 1.10 |
| 12 | 4.46 | 23.73 0.03 | 19.46 0.10 | 4.27 0.10 | 1.15 | 3.17 | 1.28 |
| 18 | 6.70 | 23.95 0.02 | 20.04 0.15 | 3.91 0.15 | 0.94 | 3.01 | 1.34 |
| 24 | 8.93 | 24.40 0.02 | 20.56 0.22 | 3.84 0.22 | 0.94 | 2.95 | 1.37 |
| 30 | 11.16 | 24.76 0.02 | 20.91 0.28 | 3.85 0.28 | 0.64 | 3.25 | 1.25 |
| 36 | 13.39 | 25.51 0.03 | 22.64 1.23 | 2.87 1.23 | 0.64 | 2.26 | 1.64 |
Note. — Radial profiles. (1): Radius along semimajor axis in arcsec. (2): Radius along semimajor axis in kpc. (3): Observed surface brightness in FUV, corrected only from Galactic extinction. (4): Observed surface brightness in K, corrected only from Galactic extincion. (5): Observed (FUVK) color, corrected only from galactic extinction. (6): Internal extinction in FUV. (7): (FUVK) color corrected from both Galactic and internal extinction. (8): Logarithm of specific star formation rate (SFR per unit of stellar mass).
| Object name | m | AFUV,0 | |||||||
|---|---|---|---|---|---|---|---|---|---|
| (arcsec) | (dex/kpc) | () | () | (kpc) | () | (kpc) | (mag/kpc) | (mag) | |
| (1) | (2) | (3) | (4) | (5) | (6) | (7) | (8) | (9) | (10) |
| PGC 00282 | 9 | 0.025 | 0.993 | 223 | 8.22‡ | 2.20 | 15.34‡ | 0.003 | 0.881 |
| ARP 256 NED02 | 9 | 0.004 | 1.405 | 473 | 4.71‡ | 12.01 | 4.91 | 0.045 | 2.024 |
| NGC 0099 | 9 | 0.028 | 1.124 | 571 | 3.33‡ | 7.59 | 4.25 | 0.059 | 1.390 |
| VV 548 | 9 | 0.006 | 1.475 | 135 | 5.89‡ | 4.03 | 5.42‡ | 0.012 | 1.114 |
| NGC 0165 | 9 | 0.001 | 0.671 | 558 | 5.22 | 2.62 | 5.28 | 0.034 | 1.165 |
| UGC 00372 | 9 | 0.022 | 0.993 | 151 | 3.46‡ | 1.49 | 4.21‡ | 0.005 | 0.893 |
| PGC 02269 | 9 | 0.012 | 1.117 | 357 | 4.56 | 4.67 | 5.19 | 0.032 | 1.478 |
| NGC 0195 | 9 | 0.023 | 0.285 | 1364 | 2.79 | 2.63 | 3.28 | 0.003 | 1.802 |
| NGC 0213 | 9 | 0.012 | 0.310 | 1088 | 4.17 | 2.22 | 4.71 | 0.080 | 1.636 |
| ESO 540- G025 | 9 | 0.001 | 1.468 | 138 | 4.37‡ | 4.05 | 4.44‡ | 0.018 | 0.935 |
| NGC 0262 | 9 | 0.031 | 0.293 | 277 | 5.36 | 0.54 | 8.63‡ | 0.029 | 1.973 |
| NGC 0266 | 27 | 0.023 | 0.226 | 1511 | 5.62 | 2.54 | 7.98 | 0.003 | 1.658 |
| NGC 0300 | 27 | 0.116 | 0.747 | 323 | 1.29 | 1.80 | 1.98 | 0.137 | 0.890 |
| PGC 03613 | 9 | 0.022 | 0.387 | 1321 | 4.01 | 3.22 | 5.01 | 0.008 | 2.227 |
| IC 1616 | 9 | 0.003 | 0.797 | 965 | 4.45 | 6.04 | 4.62 | 0.005 | 1.472 |
| ESO 296- G002 | 9 | 0.011 | 0.754 | 489 | 5.22 | 2.77 | 4.63 | 0.003 | 1.319 |
| NGC 0479 | 9 | 0.039 | 1.449 | 139 | 5.81 | 3.90 | 3.81 | 0.012 | 1.446 |
| NGC 0491 | 9 | 0.007 | 0.890 | 2459 | 2.34 | 19.09 | 2.26 | 0.013 | 1.653 |
| UGC 00910 | 9 | 0.014 | 1.133 | 429 | 4.72 | 5.83 | 4.09 | 0.045 | 1.569 |
| NGC 0514 | 15 | 0.031 | 0.637 | 692 | 3.83 | 3.00 | 5.26 | 0.029 | 1.499 |
| ESO 352- G069 | 9 | 0.027 | 0.596 | 878 | 3.84 | 3.46 | 5.05 | 0.040 | 1.716 |
| MESSIER 033 | 3 | 0.078 | 0.547 | 1228 | 1.48 | 4.33 | 2.01 | 0.083 | 1.088 |
| NGC 0628 | 51 | 0.073 | 0.601 | 1250 | 2.48 | 4.98 | 4.25 | 0.064 | 1.704 |
| NGC 0706 | 9 | 0.005 | 0.774 | 3432 | 3.13 | 20.38 | 3.26 | 0.013 | 1.544 |
| PGC 07210 | 9 | 0.012 | 1.032 | 518 | 4.97 | 5.56 | 5.79 | 0.007 | 0.968 |
| KUG 0156-084 | 9 | 0.005 | 1.191 | 559 | 3.39 | 8.68 | 3.26 | 0.037 | 1.406 |
| NGC 0772 | 21 | 0.016 | 0.145 | 1325 | 7.23 | 1.85 | 9.85 | 0.003 | 1.288 |
| NGC 0787 | 15 | 0.015 | 0.536 | 745 | 5.38 | 2.56 | 4.52 | 0.080 | 0.599 |
| NGC 0783 | 9 | 0.015 | 1.013 | 1024 | 4.88 | 10.56 | 4.17 | 0.008 | 1.454 |
| UGC 01593 | 9 | 0.027 | 0.768 | 721 | 3.08 | 4.22 | 3.80 | 0.061 | 1.353 |
| UGC 01603 | 9 | 0.022 | 0.987 | 202 | 3.96‡ | 1.97 | 4.96‡ | 0.027 | 1.338 |
| KUG 0210-078 | 9 | 0.041 | 0.361 | 479 | 4.71 | 1.10 | 8.51‡ | 0.073 | 1.826 |
| NGC 0881 | 9 | 0.005 | 0.588 | 1022 | 6.13 | 3.96 | 5.70 | 0.041 | 1.287 |
| NGC 0895 | 9 | 0.073 | 0.566 | 724 | 3.10 | 2.67 | 6.49 | 0.048 | 1.576 |
| NGC 0906 | 15 | 0.018 | 0.791 | 916 | 4.28 | 5.67 | 3.65 | 0.055 | 2.268 |
| PGC 09333 | 9 | 0.011 | 0.717 | 147 | 14.90‡ | 0.77 | 10.73‡ | 0.007 | 1.235 |
| NGC 0986 | 27 | 0.006 | 0.514 | 1801 | 3.16 | 5.88 | 3.02 | 0.015 | 1.631 |
| KUG 0232-079 | 9 | 0.053 | 0.758 | 1637 | 2.84 | 9.38 | 4.36 | 0.056 | 1.865 |
| NGC 0991 | 15 | 0.113 | 0.710 | 470 | 1.95 | 2.41 | 3.97 | 0.111 | 1.569 |
| NGC 1022 | 9 | 0.018 | 0.363 | 1371 | 1.88 | 3.16 | 2.03 | 0.107 | 3.402 |
| NGC 1033 | 9 | 0.007 | 0.617 | 517 | 5.66 | 2.13 | 6.22 | 0.024 | 1.024 |
| NGC 1042 | 15 | 0.061 | 0.567 | 302 | 4.62 | 1.11 | 13.00‡ | 0.056 | 1.437 |
| NGC 1068 | 27 | 0.006 | 0.433 | 4545 | 1.90 | 12.33 | 1.95 | 0.097 | 2.102 |
| NGC 1067 | 9 | 0.008 | 0.948 | 549 | 3.77 | 4.87 | 3.52 | 0.052 | 1.113 |
| NGC 1097 | 51 | 0.010 | 0.833 | 1625 | 3.81 | 11.06 | 4.16 | 0.118 | 3.200 |
| NGC 1291 | 123 | 0.085 | 0.955 | 527 | 4.09 | 0.06 | 20.89 | 0.129 | 2.978 |
| NGC 1285 | 9 | 0.053 | 0.781 | 2441 | 2.78 | 14.75 | 4.23 | 0.010 | 1.407 |
| NGC 1310 | 9 | 0.019 | 1.072 | 831 | 1.65 | 9.80 | 1.53 | 0.046 | 1.216 |
| KUG 0319-072 | 9 | 0.018 | 0.833 | 1182 | 1.89 | 8.05 | 1.75 | 0.016 | 1.122 |
| NGC 1317 | 9 | 0.017 | 0.049 | 1635 | 2.06 | 1.46 | 2.24 | 0.228 | 1.410 |
| NGC 1326 | 27 | 0.082 | 0.246 | 1989 | 1.96 | 1.13 | 3.12 | 0.168 | 2.695 |
| PGC 13535 | 9 | 0.029 | 0.598 | 347 | 4.97 | 1.38 | 7.44 | 0.014 | 0.975 |
| PGC 13600 | 9 | 0.037 | 0.226 | 401 | 4.12 | 0.67 | 6.39‡ | 0.052 | 1.663 |
| NGC 1512 | 45 | 0.029 | 0.427 | 764 | 2.31 | 2.04 | 2.73 | 0.128 | 2.227 |
| NGC 1566 | 27 | 0.024 | 0.875 | 1583 | 3.19 | 11.87 | 3.86 | 0.068 | 1.886 |
| NGC 2442 | 21 | 0.015 | 0.648 | 1522 | 2.74 | 6.77 | 3.01 | 0.025 | 1.403 |
| NGC 2403 | 21 | 0.156 | 0.751 | 1599 | 1.06 | 9.00 | 1.70 | 0.107 | 1.232 |
| NGC 2500 | 9 | 0.041 | 0.972 | 352 | 1.46 | 3.30 | 1.69 | 0.076 | 0.864 |
| NGC 2550A | 9 | 0.054 | 1.335 | 876 | 3.43 | 18.93 | 2.40 | 0.045 | 1.538 |
| NGC 2681 | 9 | 0.060 | 0.109 | 1693 | 1.51 | 2.18 | 1.91 | 0.169 | 3.376 |
| UGC 04684 | 9 | 0.008 | 1.277 | 272 | 2.41 | 5.16 | 2.30 | 0.040 | 1.248 |
| UGC 04807 | 9 | 0.058 | 1.547 | 158 | 3.81 | 5.58 | 2.53 | 0.067 | 0.630 |
| NGC 2782 | 15 | 0.014 | 0.609 | 1385 | 3.08 | 5.62 | 3.42 | 0.051 | 2.024 |
| NGC 2903 | 27 | 0.049 | 0.592 | 5365 | 1.91 | 20.93 | 2.44 | 0.099 | 2.533 |
| MESSIER 081 | 201 | 0.046 | 0.238 | 3933 | 2.15 | 6.80 | 2.78 | 0.026 | 1.445 |
| UGC 05493 | 9 | 0.012 | 0.780 | 689 | 2.79 | 4.15 | 3.03 | 0.044 | 1.240 |
| UGC 05528 | 9 | 0.010 | 0.124 | 1103 | 8.82 | 1.46 | 10.97 | 0.090 | 0.353 |
| NGC 3147 | 9 | 0.023 | 0.315 | 3886 | 3.91 | 8.03 | 4.95 | 0.050 | 2.120 |
| NGC 3183 | 15 | 0.005 | 0.721 | 1418 | 3.77 | 7.45 | 3.94 | 0.028 | 1.531 |
| ESO 317- G019 | 9 | 0.051 | 0.601 | 453 | 2.14 | 1.81 | 2.85 | 0.105 | 1.734 |
| NGC 3244 | 15 | 0.007 | 1.062 | 917 | 2.80 | 10.57 | 2.93 | 0.088 | 1.931 |
| NGC 3277 | 15 | 0.001 | 0.524 | 921 | 1.74 | 3.08 | 1.74 | 0.245 | 0.894 |
| NGC 3288 | 9 | 0.004 | 0.594 | 1158 | 4.38 | 4.53 | 4.20 | 0.022 | 1.219 |
| NGC 3344 | 21 | 0.194 | 0.536 | 1665 | 0.95 | 5.72 | 1.66 | 0.128 | 1.602 |
| MESSIER 095 | 51 | 0.060 | 0.109 | 2696 | 2.22 | 3.46 | 3.20 | 0.060 | 1.759 |
| NGC 3353 | 9 | 0.127 | 1.412 | 570 | 0.90 | 14.71 | 0.71 | 0.029 | 1.559 |
| MESSIER 096 | 33 | 0.064 | 0.182 | 3042 | 2.45 | 2.00 | 3.86 | 0.058 | 2.218 |
| UGC 05943 | 9 | 0.005 | 1.165 | 434 | 3.50 | 6.35 | 3.38 | 0.165 | 0.432 |
| NGC 3394 | 9 | 0.030 | 1.074 | 595 | 4.11 | 7.06 | 3.20 | 0.006 | 1.403 |
| NGC 3445 | 9 | 0.075 | 1.260 | 945 | 1.37 | 17.17 | 1.79 | 0.065 | 0.550 |
| NGC 3470 | 9 | 0.055 | 0.208 | 1247 | 3.40 | 2.01 | 6.00 | 0.027 | 1.391 |
| NGC 3486 | 21 | 0.025 | 0.992 | 430 | 2.44 | 4.22 | 2.83 | 0.050 | 0.954 |
| IC 0671 | 9 | 0.004 | 0.362 | 1007 | 7.87 | 2.32 | 8.49 | 0.018 | 1.729 |
| NGC 3821 | 9 | 0.003 | 0.054 | 443 | 6.20 | 0.50 | 6.46 | 0.003 | 1.734 |
| NGC 3840 | 9 | 0.018 | 0.461 | 633 | 4.50 | 1.83 | 5.52 | 0.065 | 1.246 |
| NGC 3861 | 9 | 0.031 | 0.177 | 688 | 8.13 | 1.03 | 19.10‡ | 0.025 | 1.432 |
| NGC 4108 | 9 | 0.046 | 1.377 | 621 | 2.70 | 14.81 | 2.10 | 0.058 | 1.415 |
| NGC 4108B | 9 | 0.111 | 1.255 | 305 | 1.55‡ | 5.47 | 2.58‡ | 0.029 | 0.880 |
| NGC 4136 | 9 | 0.051 | 1.027 | 391 | 1.46 | 4.17 | 1.76 | 0.078 | 1.275 |
| NGC 4303 | 21 | 0.001 | 0.910 | 2019 | 2.86 | 16.39 | 2.84 | 0.083 | 1.721 |
| NGC 4301 | 15 | 0.005 | 1.524 | 238 | 1.21 | 7.95 | 1.20 | 0.050 | 0.972 |
| NGC 4314 | 33 | 0.022 | 0.274 | 1129 | 2.57 | 0.60 | 2.94 | 0.003 | 2.884 |
| NGC 4395 | 21 | 0.406 | 0.955 | 125 | 0.59 | 1.13 | 1.32‡ | 0.147 | 0.604 |
| NGC 4421 | 9 | 0.098 | 0.158 | 1576 | 1.53 | 1.09 | 2.32 | 0.007 | 4.346 |
| NGC 4440 | 9 | 0.001 | 0.008 | 2390 | 1.08 | 2.43 | 1.08 | 0.172 | 4.341 |
| MESSIER 058 | 33 | 0.014 | 0.319 | 2666 | 2.96 | 5.56 | 2.71 | 0.063 | 1.672 |
| NGC 4618 | 15 | 0.114 | 1.503 | 678 | 1.50 | 21.64 | 1.07 | 0.120 | 0.693 |
| NGC 4625 | 9 | 0.097 | 0.860 | 1437 | 0.51 | 10.41 | 0.58 | 0.005 | 1.276 |
| NGC 4665 | 15 | 0.010 | 0.333 | 1498 | 2.60 | 0.69 | 2.46 | 0.221 | 3.028 |
| NGC 4691 | 15 | 0.111 | 1.010 | 1012 | 1.82 | 10.35 | 1.24 | 0.203 | 2.713 |
| NGC 4736 | 27 | 0.067 | 0.659 | 7230 | 0.90 | 32.93 | 0.79 | 0.112 | 1.942 |
| NGC 4819 | 9 | 0.055 | 0.278 | 2060 | 3.57 | 1.09 | 6.46‡ | 0.424 | 0.212 |
| UGC 08340 | 9 | 0.026 | 0.756 | 677 | 3.14 | 3.86 | 3.87 | 0.020 | 1.363 |
| MESSIER 051a | 33 | 0.018 | 0.865 | 2681 | 2.89 | 19.66 | 3.28 | 0.024 | 1.860 |
| NGC 5231 | 3 | 0.045 | 0.233 | 2144 | 3.26 | 1.25 | 4.91 | 0.053 | 2.470 |
| MESSIER 083 | 39 | 0.016 | 0.966 | 3047 | 1.69 | 28.13 | 1.59 | 0.056 | 1.813 |
| ESO 444- G087 | 9 | 0.096 | 0.060 | 2226 | 2.27 | 1.94 | 4.52 | 0.015 | 1.629 |
| MESSIER 101 | 33 | 0.056 | 0.569 | 826 | 3.62 | 3.06 | 6.78 | 0.061 | 1.586 |
| NGC 5474 | 21 | 0.087 | 0.933 | 258 | 1.27 | 2.21 | 1.71 | 0.137 | 1.063 |
| UGC 09120 | 9 | 0.028 | 1.557 | 377 | 4.83 | 13.58 | 3.68 | 0.018 | 1.132 |
| NGC 5569 | 9 | 0.127 | 0.847 | 250 | 1.63 | 1.76 | 3.12‡ | 0.011 | 1.200 |
| NGC 5656 | 9 | 0.019 | 0.709 | 1862 | 2.42 | 9.52 | 2.71 | 0.021 | 1.265 |
| NGC 5701 | 51 | 0.080 | 0.397 | 261 | 5.64 | 0.10 | -164‡ | 0.055 | 1.699 |
| NGC 5713 | 21 | 0.020 | 0.779 | 1869 | 2.25 | 11.23 | 2.04 | 0.002 | 2.191 |
| IC 1063 | 9 | 0.030 | 0.380 | 2495 | 5.33‡ | 5.99 | 8.43 | 0.013 | 1.941 |
| UGC 09661 | 9 | 0.043 | 1.221 | 332 | 2.09 | 5.52 | 1.73 | 0.004 | 0.992 |
| NGC 6154 | 15 | 0.016 | 0.383 | 723 | 5.01 | 1.74 | 6.17 | 0.015 | 1.334 |
| IC 1221 | 9 | 0.052 | 0.627 | 575 | 3.90 | 2.44 | 7.32‡ | 0.011 | 1.086 |
| IC 1222 | 9 | 0.006 | 1.017 | 393 | 10.18 | 4.09 | 8.97 | 0.005 | 1.309 |
| NGC 6307 | 9 | 0.028 | 0.134 | 1585 | 2.72 | 1.16 | 3.29 | 0.050 | 3.760 |
| IC 1251 | 9 | 0.371 | 0.767 | 810 | 0.70 | 4.74 | 1.73‡ | 0.200 | 0.820 |
| NGC 6340 | 9 | 0.158 | 0.360 | 2847 | 1.42 | 1.24 | 2.95 | 0.032 | 3.048 |
| IC 1248 | 9 | 0.018 | 0.924 | 329 | 3.91 | 2.76 | 4.66 | 0.029 | 1.379 |
| UGC 10796 | 15 | 0.025 | 0.919 | 141 | 4.17‡ | 1.17 | 5.51‡ | 0.125 | 1.972 |
| NGC 6373 | 9 | 0.030 | 1.154 | 161 | 3.77‡ | 2.29 | 5.11‡ | 0.019 | 1.062 |
| UGC 10888 | 9 | 0.032 | 0.525 | 2177 | 2.96 | 7.29 | 3.80 | 0.029 | 1.765 |
| IC 4836 | 15 | 0.047 | 1.222 | 2416 | 2.64 | 40.22 | 2.06 | 0.066 | 1.242 |
| NGC 6770 | 15 | 0.035 | 0.222 | 991 | 4.71 | 1.65 | 7.64 | 0.073 | 0.682 |
| IC 4845 | 9 | 0.006 | 0.526 | 1215 | 4.02 | 4.09 | 4.24 | 0.009 | 1.638 |
| NGC 6782 | 21 | 0.038 | 0.182 | 1081 | 4.44 | 1.64 | 7.32 | 0.027 | 2.119 |
| NGC 6902B | 9 | 0.050 | 1.141 | 199 | 2.77 | 2.76 | 4.08‡ | 0.068 | 1.557 |
| NGC 6902 | 15 | 0.051 | 0.182 | 1137 | 4.00 | 1.73 | 7.51‡ | 0.053 | 1.904 |
| NGC 6951 | 15 | 0.052 | 0.243 | 1853 | 4.01 | 3.25 | 7.66‡ | 0.035 | 2.700 |
| PGC 65328 | 9 | 0.021 | 0.625 | 415 | 5.64 | 1.75 | 7.82 | 0.027 | 1.553 |
| NGC 6962 | 21 | 0.028 | 0.048 | 726 | 7.24 | 0.65 | 13.79 | 0.002 | 1.681 |
| PGC 66559 | 9 | 0.025 | 1.384 | 82 | 5.27‡ | 1.99 | 7.51‡ | 0.041 | 0.919 |
| NGC 7080 | 15 | 0.009 | 0.619 | 1547 | 4.18 | 6.43 | 4.57 | 0.028 | 1.851 |
| UGC 11790 | 9 | 0.060 | 0.387 | 352 | 5.15 | 0.86 | 18.09‡ | 0.001 | 1.635 |
| UGC 11816 | 9 | 0.010 | 1.156 | 158 | 4.97 | 2.26 | 5.59 | 0.017 | 1.359 |
| NGC 7167 | 9 | 0.013 | 1.108 | 688 | 2.65 | 8.82 | 2.45 | 0.014 | 1.144 |
| NGC 7221 | 15 | 0.015 | 0.800 | 729 | 5.85 | 4.61 | 4.86 | 0.033 | 1.458 |
| NGC 7337 | 9 | 0.010 | 0.244 | 543 | 6.04 | 0.95 | 6.99 | 0.011 | 1.955 |
| NGC 7343 | 9 | 0.010 | 1.064 | 932 | 4.61 | 10.78 | 4.19 | 0.028 | 1.303 |
| ESO 346- G006 | 9 | 0.095 | 0.111 | 2089 | 2.87‡ | 1.62 | 7.70‡ | 0.006 | 1.042 |
| NGC 7418 | 15 | 0.025 | 0.834 | 802 | 2.46 | 5.47 | 2.85 | 0.024 | 1.278 |
| NGC 7421 | 15 | 0.052 | 0.614 | 1720 | 1.53 | 7.07 | 1.87 | 0.009 | 1.225 |
| ARP 314 NED01 | 9 | 0.002 | 1.230 | 1259 | 1.99 | 21.34 | 2.02 | 0.106 | 1.107 |
| ARP 314 NED02 | 3 | 0.034 | 1.538 | 842 | 2.04 | 29.14 | 1.76 | 0.195 | 0.718 |
| NGC 7469 | 9 | 0.033 | 1.097 | 932 | 4.91 | 11.65 | 3.57 | 0.092 | 2.782 |
| NGC 7479 | 15 | 0.026 | 0.456 | 1390 | 4.80 | 3.97 | 6.73 | 0.041 | 1.936 |
| IC 5287 | 9 | 0.019 | 0.836 | 528 | 6.68 | 3.61 | 5.20 | 0.016 | 1.107 |
| NGC 7496 | 15 | 0.006 | 0.832 | 901 | 2.24 | 6.12 | 2.31 | 0.054 | 1.560 |
| NGC 7535 | 9 | 0.000 | 1.004 | 296 | 4.33 | 2.99 | 4.34 | 0.002 | 1.248 |
| NGC 7552 | 21 | 0.002 | 0.683 | 1495 | 2.84 | 7.21 | 2.80 | 0.041 | 1.930 |
| NGC 7645 | 9 | 0.033 | 0.579 | 1211 | 4.36 | 4.59 | 6.47 | 0.027 | 1.762 |
| NGC 7673 | 3 | 0.066 | 1.716 | 412 | 2.79 | 21.46 | 1.96 | 0.195 | 0.148 |
| NGC 7674 | 9 | 0.035 | 1.228 | 1047 | 6.09 | 17.67 | 4.10 | 0.016 | 1.614 |
| IC 5325 | 9 | 0.023 | 0.893 | 1720 | 1.74 | 13.44 | 1.59 | 0.017 | 1.258 |
| UGC 12635 | 9 | 0.010 | 0.710 | 156 | 5.63‡ | 0.80 | 6.45‡ | 0.016 | 1.182 |
| NGC 7769 | 9 | 0.032 | 0.945 | 2034 | 3.62 | 17.90 | 2.87 | 0.007 | 1.476 |
| NGC 7793 | 21 | 0.149 | 0.955 | 928 | 0.56 | 8.37 | 0.70 | 0.223 | 1.109 |
Note. — Fit results. (1): Galaxy name. (2): Radius at which the contribution of the disk to the (FU) color begins to dominate over that of the bulge. (3): Specific SFR gradient, i.e.. (4): Logarithm of the extrapolated value of sSFR at r=0. (5): Stellar mass surface density extrapolated at r=0. Note that these values have not been corrected for inclination. (6): Scale-length of the stellar mass surface density profile. Galaxies marked with a double dagger (‡) are those for which could not be properly computed (see text for details). (7): SFR surface density extrapolated at r=0. Note that these values have not been corrected for inclination. (8): Scale-length of the SFR surface density profile. Galaxies marked with a double dagger (‡) are those for which could not be properly computed (see text for details). (9): Radial gradient of the extinction in the FUV. (10): Extrapolated value of the extinction in the FUV at (note that since it is an extrapolated value from the linear fits, negative values are possible, but without any physical meaning).
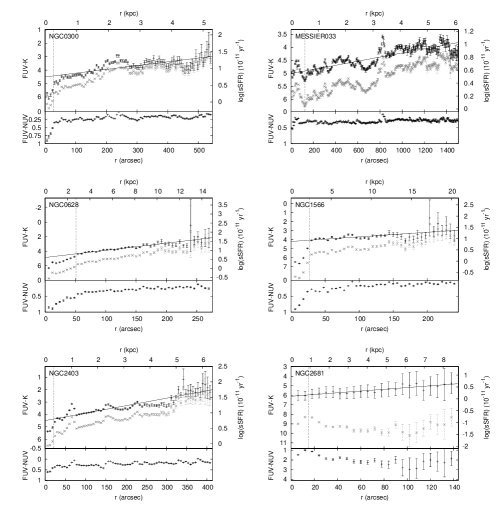
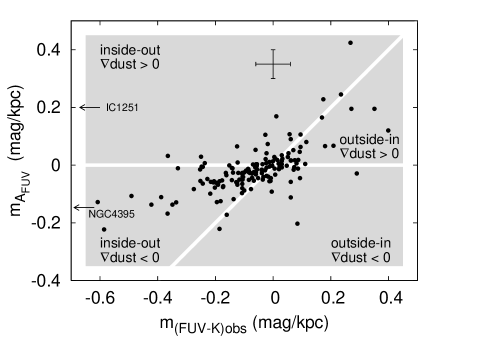

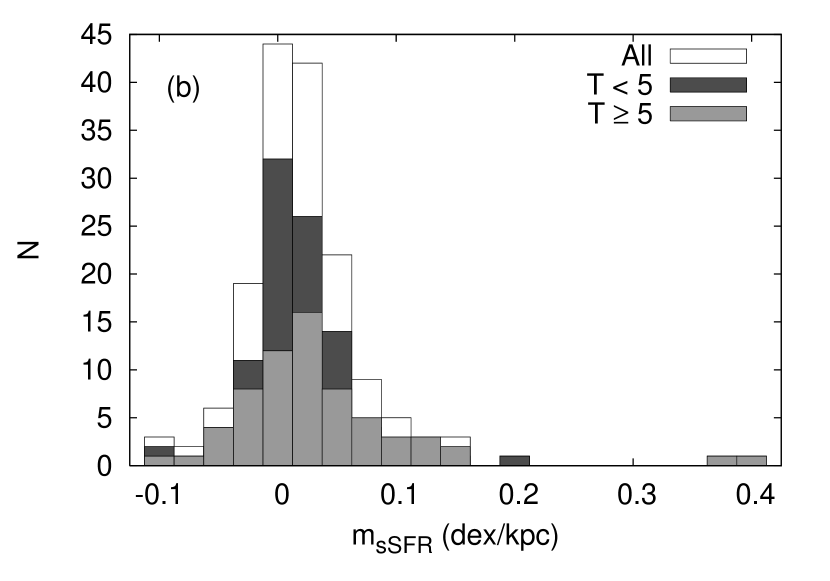
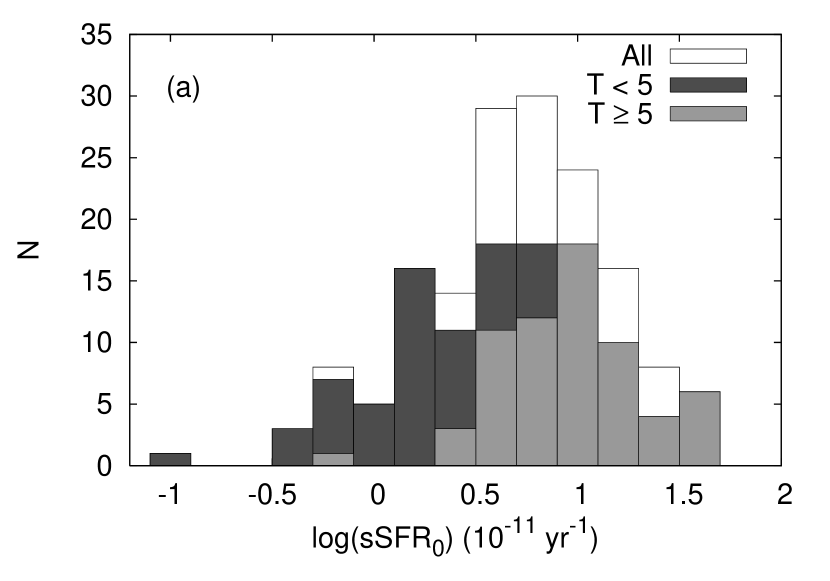
![[Uncaptioned image]](/html/astro-ph/0612017/assets/x6.png)
![[Uncaptioned image]](/html/astro-ph/0612017/assets/x7.png)
![[Uncaptioned image]](/html/astro-ph/0612017/assets/x8.png)
![[Uncaptioned image]](/html/astro-ph/0612017/assets/x9.png)
![[Uncaptioned image]](/html/astro-ph/0612017/assets/x10.png)
![[Uncaptioned image]](/html/astro-ph/0612017/assets/x11.png)
![[Uncaptioned image]](/html/astro-ph/0612017/assets/x12.png)
![[Uncaptioned image]](/html/astro-ph/0612017/assets/x13.png)