The Two-dimensional XMM-Newton Group Survey: groups.
Abstract
We present the results of the 2-dimensional XMM-Newton Group Survey (2dXGS), an archival study of nearby galaxy groups. In this paper we consider eleven nearby systems () in Mulchaey et al. (2003), which span a broad range in X-ray luminosity from to ergs/s. We measure the iron abundance and temperature distribution in these systems and derive pressure and entropy maps. We find statistically significant evidence for structure in the entropy and pressure of the gas component of seven groups on the 10–20% level. The XMM-Newton data for the three groups with best statistics also suggest patchy metalicity distributions within the central 20–50 kpc of the brightest group galaxy, probed with 2–10 kpc resolution. This provides insights into the processes associated with thermalization of the stellar mass loss. Analysis of the global properties of the groups reveals a subclass of X-ray faint groups, which are characterized by both higher entropy and lower pressure. We suggest that the merger history of the central elliptical is responsible for both the source and the observed thermodynamical properties of the hot gas of the X-ray faint groups.
Subject headings:
galaxies: intra-galactic medium; clusters: individual: NGC 2300, NGC 3665, IC 1459, NGC 3923, NGC 4168, NGC 4261, NGC 4636, NGC 5044, NGC 5322, NGC 5846, NGC 75821. Introduction
Groups of galaxies constitute the most common galaxy association, containing as much as 50–70% of all galaxies in the nearby universe (Geller & Huchra 1983) and provide a link between the massive virialized systems such as clusters of galaxies and the field. For example, Finoguenov et al. (2003b) found that chemical enrichment in groups is very close to the prediction of the Salpeter Initial Mass Function, known to characterize the star-formation in the field. It was also suggested by Kodama et al. (2001) that properties of galaxies in clusters are largely defined by their previous group environment. Thus, studies of groups open prospects to understanding galaxy formation, presently one of the most challenging astrophysical issues.
Although the systems we study are defined by galaxy concentration, the presence of X-ray emission introduces further refinement in the definition and indicates that some of these systems are also virialized objects (Ostriker et al. 1995). Groups with a high fraction of early-type galaxies are more likely to exhibit detectable X-ray emission (Mulchaey et al. 1996). However, at low X-ray luminosities ( ergs s-1) the emission from individual galaxies becomes a non-negligible contribution to the overall diffuse emission. Early-type galaxies show a wide range of X-ray properties, from the “normal” emission to those early-type galaxies that have rather compact X-ray emission (Forman et al. 1985; Matsushita 2001; Finoguenov & Miniati 2004), while others have been suggested to lack a massive dark matter halo (Romanowsky et al. 2003, but see Dekel et al. 2005). Group gas, consisting of bona fide collapsed halos, obey well-defined X-ray scaling relations, and one can use these relationships to shed light on the large-scale dark matter distributions in these systems.


Comparative studies of the scaling relations in clusters of galaxies reveal strong deviations of the observed relations from predictions based on self-similar collapse (e.g. Ponman et. al. 1996; Finoguenov et al. 2001). These deviations are thought to be best characterized by the injection of energy (preheating) into the gas before clusters collapse (Kaiser 1991; Evrard & Henry 1991). This entropy ‘floor’ causes the simple self-similar scaling laws (Kaiser 1986) to predict a shallower relationship. However, analysis of a large compilation of entropy profiles on groups and clusters of galaxies is inconsistent with this picture, requiring at much larger entropy levels than were thought before (Finoguenov et al. 2002) and modifying the concept of the entropy floor to the entropy ramp at (Ponman et al. 2003). Reproduction of these results both analytically and numerically, strongly supports the scenario of Dos Santos & Dore (2002), where an initial adiabatic state of the infalling gas is further modified by the accretion shock (Ponman et al. 2003; Voit et al. 2003; Voit & Ponman 2003; Borgani et al. 2005). As supporting evidence for the latter, Ponman et al. (2003) noticed a self-similarity in the entropy profiles, once scaled to . Some XMM-Newton observations are consistent with this result (Pratt & Arnaud 2003; Finoguenov et al. 2004b; Finoguenov et al. 2005a). A major change introduced by these studies is that groups of galaxies can again be viewed as scaled-down versions of clusters, but with the scaling itself modified. Further evidence for the departure of groups from the trends seen in clusters has been recently refuted by Osmond & Ponman (2004).
In addition to preheating, internal heating by supernovae and AGN may also impact the observed scaling relations. Recent results from Chandra demonstrate that AGN heating is likely very important in both the centers of clusters (McNamara et al. 2001) and early-type galaxies (Finoguenov & Jones 2001). However, very little work has been done to explore the role of AGN heating on the intragroup medium.
To better understand the physics of the intragroup medium, we have embarked on an XMM-Newton archival study of nearby galaxy groups. The large field of view of XMM-Newton, combined with its good resolution and large collecting area make it an ideal instrument to study the hot gas in nearby groups. We also perform a study of how structure in the observed systems may affect their placement on the scaling relations for entropy. We adopt a Hubble constant of 70 km s-1 Mpc-1, , and present redshifts corrected for the local motion.
2. Sample Selection
At the moment there is no large purely X-ray selected sample of groups of galaxies. For example, only a few objects, Fornax cluster, MKW4, NGC 4636, NGC 1550 and NGC 5044 are present in the HIFLUGS, a complete all-sky sample of brightest groups and clusters of galaxies (Reiprich & Böhringer 2002). Most present-day samples of groups are based on the X-ray follow-up of optical surveys (e.g. Mahdavi et al. 2000; Mulchaey et al. 2003).
For this study we have selected the groups in Mulchaey et al. (2003) with publicly available XMM-Newton (Jansen et al. 2001) observations. Most of the groups in the Mulchaey et al. (2003) sample were found by cross-correlating the ROSAT observation log with the positions of optically-selected groups in the catalogs of Hickson (1982), Huchra & Geller (1982), Geller & Huchra (1983), Maia et al. (1989), Nolthenius (1993) and Garcia (1993). In addition to the optically-selected groups, the Mulchaey et al. (2003) sample includes a small number of groups that were discovered in the ROSAT All-Sky Survey (RASS). Their final group list contains 109 systems.
The properties of groups from the Mulchaey et al. (2003) sample are shown in Fig.1. The flux limit corresponds to ergs s-1 cm-2 at a 3 detection level, which is a factor of 4 lower than the flux limit in the Mahdavi et al. (2000) sample, a factor of 10 lower than in the REFLEX/NORAS surveys and a factor of 100 lower compared to HIFLUGS (these latter surveys are all based on the RASS data). The distribution of systems in Fig.1 is quite homogeneous, as are the targets observed by XMM-Newton (which covers 50% of groups at redshifts lower than 0.025; independent of the volume and luminosity cut). By construction, the Mulchaey et al. (2003) group list covers a fraction of a percent of the sky for serendipitous systems, yet it includes a larger fraction of bright objects, that were selected as primary targets for ROSAT pointings, e.g. 3 of the 4 HIFLUGS groups are included.
As we are interested in studying the spatial variations in the intragroup medium, we limit our analysis here to nearby groups. However, for the very nearest groups in the Mulchaey et al. (2003) sample, only the very centers of the group are covered in a single XMM-Newton pointing. Thus, we restrict our sample to the redshift bin 0.004–0.012. Results for the higher redshift bin 0.012–0.025 are presented in Finoguenov et al. (2005b). In addition, eight groups from the Mahdavi sample are analyzed in Mahdavi et al. (2005). Two of the XMM-Newton targets in our redshift bin had no diffuse emission detection with ROSAT (NGC 4168 and NGC 7582), but we include them here for completeness.
| Name | log | log zBCG | ||||||
|---|---|---|---|---|---|---|---|---|
| km/s | kpc | km/s | ergs/s | kpc | ||||
| NGC 2300 | 16 | 10.41 | 25423 | 65 | 339 | |||
| NGC 3665 | 6 | 10.70 | 18611 | 69 | 222 | |||
| IC 1459 | 11 | 4.4 | 10.37 | 3087 | 56 | 280 | ||
| NGC 3923 | 9 | 13. | 10.52 | 27523 | 58 | 280 | ||
| NGC 4168 | 10 | 6.9 | 10.40 | 18211 | 76 | 258 | ||
| NGC 4261 | 43 | 5.5 | 10.70 | 29416 | 75 | 451 | ||
| NGC 4636 | n/a | 1 | 7.1 | 10.51 | 19112 | 31 | 331 | |
| NGC 5044 | 15 | 19. | 10.70 | 2382 | 90 | 430 | ||
| NGC 5322 | 7 | 5.2 | 10.67 | 2245 | 59 | 283 | ||
| NGC 5846 | 20 | 9.2 | 10.66 | 27823 | 57 | 309 | ||
| NGC 7582 | 8 | 54 | ||||||
The basic properties of our sample groups are listed in Tab.1. Col.(1) gives the name of the group, (2) velocity dispersion of the group, (3) number of galaxies identified with the group, (4–6) properties of the central galaxy: effective radius, blue luminosity and central velocity dispersion, (7) X-ray luminosity scaled to as tabulated in Mulchaey et al. (2003), (8) redshift, (9) in kpc, calculated as using the M–T relation (Pacaud, F. 2005, private communication) re-derived from Finoguenov et al. (2001) using an orthogonal regression and correcting the masses to and a LCDM cosmology. The optical data are collected from Bender et al. (1992), Koprolin & Zeilinger (2000) and Davies et al. (1987). NGC 3665 and NGC 2300 are classified as S0 and NGC 7582 is classified as a spiral (de Vaucouleurs et al. 1991; RC3 hereafter). After a careful investigation, we could not confirm the members of the NGC 4636 group (see section 5.7).
3. Data Analysis
Tab.2 lists details of the observations. Column (1) lists the name of the group, (2) is the assigned XMM archival name, (3) is the net Epic-pn exposure after removal of flaring episodes, (4) lists the pn filter used, which determines the choice of instrumental response as well as background estimates, (5) the XMM-Newton revolution number, which is useful to assess any secular evolution of the instrumental background, and (6) the pn frame time, which is used to determine the fraction of out-of-time events.
| Name | Obs. | net | pn | XMM | frame |
|---|---|---|---|---|---|
| ID | exp. | Filter | Orbit | time | |
| ksec | ms | ||||
| NGC 2300 | 0022340201 | 42.3 | Thin | 232 | 73 |
| NGC 3665 | 0052140201 | 19.5 | Medium | 363 | 199 |
| IC 1459 | 0135980201 | 26.3 | Medium | 438 | 73 |
| NGC 3923 | 0027340101 | 30.3 | Thin | 379 | 73 |
| NGC 4168 | 0112550501 | 15.8 | Medium | 364 | 199 |
| NGC 4261 | 0056340101 | 20.3 | Medium | 370 | 73 |
| NGC 4636 | 0111190701 | 55.7 | Medium | 197 | 73 |
| NGC 5044 | 0037950101 | 10.5 | Medium | 201 | 73 |
| NGC 5322 | 0071340501 | 13.6 | Thin | 374 | 73 |
| NGC 5846 | 0021540101 | 28.6 | Thin | 207 | 73 |
| NGC 7582 | 0112310201 | 17.8 | Medium | 267 | 73 |
The initial steps of the data reduction are similar to that described in Zhang et al. (2004) and Finoguenov et al. (2003a). One important aspect of the data preparation is to remove flares which can significantly enhance the detector background and severely limit the detection of low surface brightness features. Thus, for the group analysis, using flare free periods is critical. To identify time intervals with flares we look at energies above 10 keV where the telescope efficiency is quite low and the particle background dominates the source counts. We use the 10–15 keV energy band (binned in 100 s intervals) to monitor the particle background and to excise periods of high particle flux. In this screening process we use the events with FLAG=0 and PATTERN for the pn (MOS) data. We reject time intervals affected by flares by excising periods where the detector count rate exceeds 2 above the mean quiescent rate.
Since most of the observations analyzed here were performed using a short integration frame time for pn, it is important to remove the out-of-time events (OOTE) for accurate imaging and spectral analysis. We used the standard product of the epchain SAS (XMMSAS 6.1) task to produce the simulated OOTE file for all the observations and scaled it by the fraction of the OOTE expected for the frame exposure time, as specified in Tab.2.
For the broad-band analysis we have used both pn and MOS data, while in the spectral analysis we only use pn data in order to take advantage of our expertise on the background subtraction for pn. In addition, the pn spectra have the highest statistics for the groups. We use response matrices released under XMMSAS 6.1. For further details of XMM-Newton processing we refer the reader to http://wave.xray.mpe.mpg.de/xmm/cookbook/general.
Analysis of the groups consists of two main steps: estimating the temperature structure of groups and verifying the structure using spectral analysis. Only the results of the spectral analysis are used in tabulations and comparison studies. The initial maps based on the hardness ratios are only used to locate the substructure. Quantitative analysis of the substructure, possible only for a subsample of systems is based on the spectral analysis. The two dimensional information, related to the analysis reported in this paper, is released under http://www.mpe.mpg.de/2dXGS/ homepage.
The first part of the analysis consists of producing temperature estimates for each of the systems. We use the surface brightness in conjunction with the hardness ratio maps to locate regions of similar intensity and color. The input data are based on images corrected for the instrumental effects discussed above and are background subtracted. The surface brightness is a wavelet-reconstructed (Vikhlinin et al. 1998) image in the 0.5–2 keV band and the hardness of the emission is a ratio of the wavelet-reconstructed images in the 0.5–1 and 1–2 keV bands. An advantage of using wavelets is the ability to remove additional background by spatial filtering as well as control over the statistical significance of the detected structure. We apply a four sigma detection threshold, followed out to a 90% confidence limit, ’a trous’ method of wavelet image reconstruction with scales from to . Complications arise since the wavelet algorithm splits the image into discrete scales resulting in small scale discontinuities in the reconstructed image, which we overcome by applying additional smoothing before producing the hardness ratio map. The point sources are not removed in the imaging analysis.
We also construct pseudo entropy and pressure maps using the image and the hardness ratio map. Although these maps suffer from a number of degeneracies, with metalicity-density being the strongest since a significant fraction of the group X-ray emission is due to lines, they indicate the regions of primary interest for the detailed spectroscopic analysis which allows most of the degeneracies to be resolved. For a system in hydrostatic equilibrium, we expect the entropy to monotonically increase with the increasing radius (e.g. Metzler & Evrard 1994), while the pressure should decrease with radius.
The spectroscopic part of the analysis uses a mask file. This mask is created using the results of the hardness ratio and surface brightness analysis described above. The first application of this technique is presented in Finoguenov et al. (2004a). In our analysis we wish to select contiguous regions with similar spectral properties. This allows us to combine regions so that counting statistics are not the limiting factor in our derivation of the group properties. To select regions we use the wavelet based hardness ratio maps to identify regions with similar X-ray colors and similar intensity level. To generate the mask file for use in further spectral analysis we use hardness ratios that correspond to temperatures in the ranges 0.48-0.56-0.60-0.64-0.72-0.8-0.9-1.0-1.1-1.2 keV and have intensities that are the same within a factor of two. We then examine each of the isolated regions with approximately equal color and intensity imposing the additional criterion that the regions should be larger than the PSF (15″) width and contain more than 300 counts in the raw pn image.
To demonstrate the performance of the technique, for NGC 4636 we compare the temperatures obtained in the spectral analysis with the temperatures estimated from the hardness ratio map within the central radius (Fig.3). The mask file is used to extract the spectra and is used to estimated the mean and dispersion of the expected temperature from the hardness ratio map. The values from the spectral analysis are taken as the best-fit value and we use the corresponding 68% confidence interval. We find that the estimated and measured temperatures agree to within 20%. The spectral and hardness ratio temperatures show a systematic offset below about 0.85 keV with the hardness ratio temperatures being 20% cooler than the fitted temperatures. The scatter about the best fit line is less than 10%, which matches our errors in determining the temperature. This shows that the hardness ratio in the 0.5–1 to 1–2 keV bands reflect the temperature of the gas. The cause of systematic deviations from unity is likely due to the higher absorption column assumed in determining the hardness ratio to temperature conversion. The systematic offset between the hardness ratio temperature and the spectral temperature is such that it could result from uncertainties in the Fe abundance. The tabulated results are from the spectral fits and the column density and abundance are fitted.
![[Uncaptioned image]](/html/astro-ph/0611858/assets/x3.png)
Comparison between the temperature derived from the spectral analysis and the temperature estimated from the hardness ratio in NGC 4636.
The spectral analysis was performed using the single-temperature APEC plasma code, fitting the abundance of O–Ni as one group with their relative abundances at the photospheric solar abundance ratios of Anders & Grevesse (1989). Absorption was fixed at the Galactic value, reported in Tab.5.
In the spectral analysis, special attention was paid to the issue of the background estimation. We employ a double-subtraction technique, following Zhang et al. (2004). We used the 12–16′ radius and 2–12 keV band to estimate the quality of the background subtraction using the blank fields. Variations in the background are found on the 20% level, in agreement with other studies (Freyberg et al. 2004). In our analysis of groups, we fix the shape of the background component and add a 0.2 keV thermal (APEC with solar element abundance) component to account for a possible variation in the Galactic foreground, allowing the normalizations of both components to be fit. Better estimation of the background allows one to carry out the spectral analysis throughout the detector if emission is found or set strict upper limits otherwise. Typically, an improvement of is achieved for luminous parts of the group.
The metal abundance for the plasma model was explored using three approaches: element abundance fixed at 0.3 solar value, variable element abundance, variable abundance plus a 1.5 slope power law component to account for the contribution of low mass X-ray binaries (LMXBs). We use 0.4–5 keV band for fitting, and group the channels to achieve 30 counts per bin to use the statistic. In two cases (IC 1459, NGC 4261) an additional component was added to fit the contribution of the AGN in the center of the group. All other identified point sources were excised from the spectral extraction. Some regions, with too few counts for spectral analysis and that could not be combined with other regions on the basis of color or intensity, are not analyzed and appear as excised sources. The results obtained with the fixed element abundance are only used to evaluate the temperature structure when statistics are poor. Results from these fits are not used to derive any of the quantities given in the tables.
To estimate the pressure and entropy in each region, we need to estimate the length of the column for each selected two-dimensional region on the sky. We assume a geometry in which every region is a part of a spherical shell that is centered on the system core and has its inner and outer radii passing through the nearest and furthest points of the selected region, respectively. This spherical shell is further intersected by a cylinder, that is directed towards the observer and in the observer plane has the cross-section of the selected region. For the concentric regions our geometry corresponds to a usual ”onion peeling” technique (e.g. Finoguenov & Ponman 1999). We assume a constant gas distribution with the integrated emissivity in the region matched to the measured emissivity in the spectral analysis. With these approximations the longest length through each volume is . The volume of the region is then , where S is the area of the region. For reasonable assumptions of the geometry, the systematic uncertainty introduced by the volume estimate is 5%. Further details can be found in Henry et al. (2004) and Mahdavi et al. (2005). We also analyzed regions using concentric annuli. The data for the annuli are extracted after excising point sources as well as the diffuse background sources identified in the text (NGC4168) and the substructure exceeding 50% (important for NGC 2300, NGC 5322, NGC4636) of the expected value. The annular analysis is used mainly to sample the outermost regions as well as to provide a comparison with the standard technique of volume estimate.
4. Discussion & Results
Early examples of two-dimensional studies of groups were carried out using ROSAT PSPC observations, which provided a reasonable sensitivity to both the group temperature, as well as group luminosity. Some of these include M86 (e.g. Finoguenov & Jones 2000), NGC 2300 (Mulchaey et al. 1993; Davis et al. 1996), NGC 4261 (Davis et al. 1996), NGC 4636 (Trinchieri et al. 1994), NGC 5044 (David et al. 1994), NGC 5846 (Finoguenov et al. 1999). For a more complete review we refer the reader to Mulchaey (2000). The XMM data cover a different spatial scale, different energy range, and the PSF is much different than that used in the earlier ROSAT analysis. Thus, a comparison of our results to those in the literature helps to determine how the derived X-ray characteristics of the groups are affected by the characteristics of different instruments.
4.1. Global Properties
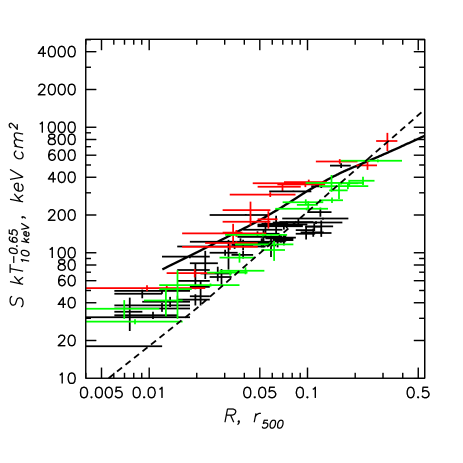
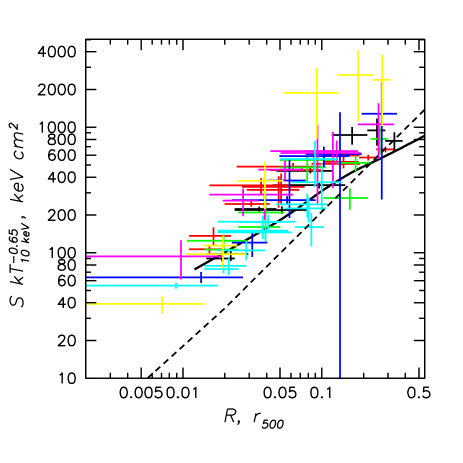
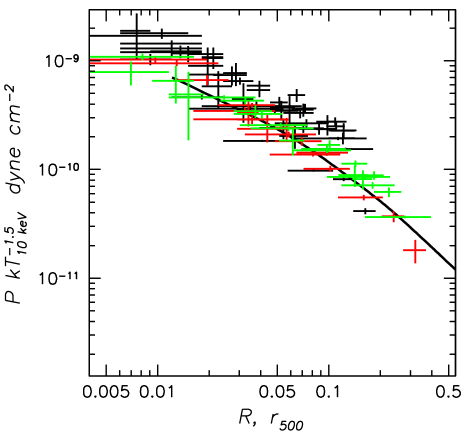
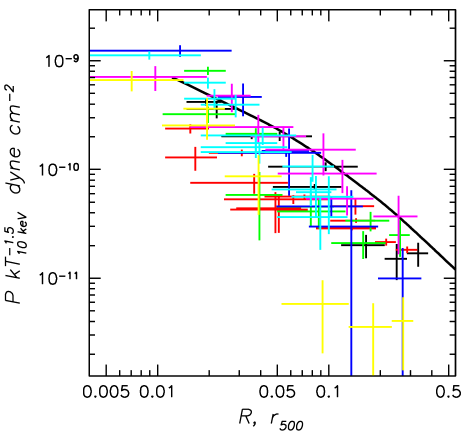
Before proceeding with describing the structure of the systems in our study, in this section we provide an overview on the global properties of the groups. This is done in several different ways. A traditional comparison is presented in Tab.5, where we estimate the temperature, luminosity and element abundance from a single spectrum, extracted using a circular region with a radius of 30 kpc. In Tab.5–5 we list the properties of the gas within various fractions of . In Fig.2 we present the entropy and pressure profiles derived using the extracted spectra and compare them with the known scaling relations. We show both the values derived using annuli, where we excise the zones associated with galaxies other then the central galaxies and deviations exceeding 30% (e.g. a background galaxy in NGC 4168; a spiral galaxy in NGC 2300; a tail in NGC 4636), and the values determined using the maps, plotting the corresponding values vs their distance from the group’s center. The latter comparison is the most sophisticated and provides considerably more insight into the state of the gas than the more traditional approaches. We have divided the sample into two groups for presentation ( Fig.2). While we provide a careful discussion of the trends below, one can already see some drastic differences in both entropy and pressure between the groups NGC 5044, NGC 5846 and NGC 4636 and the rest of the sample. For comparison, In Fig.2 we also show the typical entropy and pressure profiles as observed by XMM-Newton in galaxy groups of bolometric luminosity well in excess of erg/s (Finoguenov et al. 2005b).
We have compared the global properties of the groups analyzed here with the Epic-pn camera and the global properties of these groups in the literature. Complicating this comparison is that we have included the central group galaxy in our global properties and we have not matched our extraction radii to other studies. Despite this fact, we find an agreement within the statistical errors between our global temperatures and the ROSAT measurements given in Mulchaey et al. (2003) for groups with temperatures below 1 keV. There are two groups above 1 keV in our sample and the XMM results show that these groups have 20% higher temperatures than reported in the literature. A similar trend has been noted for groups studied with ASCA (Hwang et al. 1999; Mulchaey et al. 2003). One of these groups, NGC 5044, has been analyzed in detail by Finoguenov & Ponman (1999), and a comparison of the temperature profile has been made using ASCA and ROSAT data. This analysis shows that the data agree outside the central kpc. This possibly indicates an importance of low-temperature components in defining the mean temperatures obtained with ROSAT PSPC. Our temperature value of keV for NGC5044, obtained within the is in good consistency with the value of keV, used in the M–T relation of Finoguenov et al. (2001).
Detailed measurements of the temperature and element abundance distribution in the studied systems allowed us to provide unbiased mean values for a range of group properties which we list in Tab.5. Column (1) lists the system name, (2) the Galactic , which is fixed in the spectral modeling (3) the assumed luminosity distance, (4) implied scaling, (5) the temperature, (6) metalicity as a fraction of the solar photospheric value, derived from a single region fit with corresponding luminosity in the 0.5–2.4 keV band listed in (7). Tab. 5–5 list name of the system (1), mass average temperature (2), metalicity (3), volume averaged entropy (4) and pressure (5) using intervals and , respectively.
| Name | kT | Z | ||||
| Mpc | kpc | keV | ||||
| cm-2 | ergs/s | |||||
| NGC 2300 | 5.27 | 28.0 | 8.05 | 1.03 | ||
| NGC 3665 | 2.06 | 29.8 | 8.54 | 0.29 | ||
| IC 1459 | 1.18 | 24.2 | 6.94 | 0.53 | ||
| NGC 3923 | 6.21 | 25.0 | 7.19 | 1.32 | ||
| NGC 4168 | 2.56 | 32.8 | 9.40 | 0.19 | ||
| NGC 4261 | 1.55 | 32.4 | 9.28 | 0.63 | ||
| NGC 4636 | 1.81 | 13.3 | 3.86 | 8.14 | ||
| NGC 5044 | 4.93 | 38.9 | 11.1 | 28.0 | ||
| NGC 5322 | 1.81 | 25.4 | 7.31 | 0.08 | ||
| NGC 5846 | 4.26 | 24.6 | 7.07 | 3.05 |
| Name | kT | Z | S | P |
|---|---|---|---|---|
| keV | keV cm2 | dyne cm-2 | ||
| NGC 2300 | ||||
| NGC 3665 | ||||
| IC 1459 | ||||
| NGC 3923 | ||||
| NGC 4168 | ||||
| NGC 4261 | ||||
| NGC 4636 | ||||
| NGC 5044 | ||||
| NGC 5322 | ||||
| NGC 5846 |
| Name | kT | Z | S | P |
|---|---|---|---|---|
| keV | keV cm2 | dyne cm-2 | ||
| NGC 2300 | ||||
| IC 1459 | ||||
| NGC 4168 | ||||
| NGC 4261 | ||||
| NGC 4636 | ||||
| NGC 5044 | ||||
| NGC 5846 |
We use the information derived from the maps as well as using annuli to examine the radial variation of the properties of the hot gas. In Fig. 2 we show the entropy and pressure profiles. These profiles have been scaled using as calculated in Tab.1, so that the profiles are on a common scale. The predicted entropy for the groups is shown as a dashed line and is derived from the scaling relationship of Ponman et al. (2003). To scale the data we use , where Tw is mass-weighted temperature measured within . We also examine the differences between the pressure profiles of the groups in our sample. As entropy, , scales as , the density scales as and thus the pressure scales as . We then apply this scaling to the data, using , and display a typical pressure profile of the cluster scaled the same way in Fig. 2.
The increase in entropy with increasing radius is roughly proportional to . The adopted scaling is insensitive to the choice of the , since it only adjusts the points parallel to the scaling. This is the advantage of entropy scaling. In Finoguenov et al. (2005a) it is shown that clusters with cool cores follow the law and including all clusters flattens the trend. In addition to the clusters we have included the entropy and pressure profiles, obtained using the high-redshift subsample of Mulchaey groups (Finoguenov et al. 2005b) to extend the result down to group scales. In figure 3 the only group entropy profile that follows the between is the NGC 5044 group. In the right entropy panel the NGC 5846 group lies above the scaling relation and the NGC 4636 group data does not extend to sufficiently large radius to determine if it follows the scaling relation. In the right entropy panel only the NGC 2300 group might follow the entropy scaling at but the outer most point is not consistent with the scaling. Looking at the solid lines in figure 3 for the group entropy profiles from Finoguenov et al. (2005a), our low redshift sample follows that scaling much more closely. However, the data for NGC 5044 and NGC 4636 lie systematically below the line for the average entropy profile while in the right panel the groups have a higher average entropy than the Finoguenov et al. (2005a) sample. One can further subdivide the groups based on those that have higher entropy at the center (e.g. NGC 4261) and those that have higher entropy at the outskirts (e.g. NGC 5322), compared to the plotted scaling relations. In both cases systematic deviations are also present in the pressure profiles.
The NGC4636 group shows a higher pressure, compared to the mean, as also found in other cool core systems (Finoguenov et al. 2005a). NGC 5044, NGC 5846 and NGC 4168, show pressure profiles consistent with the mean. The profiles of NGC 4261, NGC 2300 and IC 1459 initially decline more rapidly, but then become flatter and start to match the scaling for pressure. The remaining three groups show pressure profiles that decline more quickly than the typical profile. The significance of this can be seen by considering the response of the pressure to the large-scale state of the gas and gravitational potential, where and , since both P and M scale with . Lower pressure either indicates that the gravitational mass is low or that the temperature is enhanced at even larger radii. In the former case, the total mass at should be . In the latter case, some additional entropy input is required in excess of that predicted by the modified entropy scaling. This additional entropy is needed on scales exceeding (approximately 150 kpc in these groups, see Fig. 2).
Another way to look at the results described above is to present the normalization and the slope of the entropy and pressure profiles (Tab.8). To deal with the non-statistical scatter of the points, we applied the bisector method and orthogonal regression, following Helsdon & Ponman (2000) and present the results obtained using the latter method in Tab.8, while monitoring the difference between the methods. Once the general behavior of the entropy and pressure is found, we studied the amplitude of the deviations from the fit and compared that with the statistical errors in Tab.8 for the systems with the best statistics. In addition to fitting the power laws to the pressure and entropy profiles, we provide in Tab.8 the scatter around the mean trend for the groups from Finoguenov et al. (2005b), where we allowed a renormalization of the model. In general, the structure in both entropy and pressure maps amounts to %. Stronger deviations, seen in NGC 2300, are located in the area between the two major galaxies, indicating an interaction between the two dominate galaxies in this group. The relatively high level of fluctuations in NGC 4261, discussed in more detail below, seem to be associated with the AGN activity.
| Name | S() | S slope | P() | P slope |
|---|---|---|---|---|
| keV cm2 | dyne cm-2 | |||
| NGC 2300 | ||||
| NGC 3665 | ||||
| IC 1459 | ||||
| NGC 3923 | ||||
| NGC 4168 | ||||
| NGC 4261 | ||||
| NGC 4636 | ||||
| NGC 5044 | ||||
| NGC 5322 | ||||
| NGC 5846 | ||||
| Name | S, % | P, % | S, % | P, % | Comment |
|---|---|---|---|---|---|
| power law | averaged group profile | ||||
| NGC 2300 | |||||
| NGC 3923 | |||||
| NGC 4261 | |||||
| NGC 4636 | including the plume | ||||
| NGC 4636 | central | ||||
| NGC 5044 | central | ||||
| NGC 5846 | |||||
| Name | Fe () | Fe slope | Fe, % | Comment |
|---|---|---|---|---|
| NGC 4636 | central | |||
| NGC 5044 | central | |||
| NGC 5846 |
4.2. Origin of the X-ray emission
The XMM-Newton data allow us to compare the entropy and pressure behavior at radii exceeding for a large sample of groups for the first time. Based on the levels of entropy and pressure plotted in Fig.2 which are further confirmed in normalization of the pressure in Tab.8, we conjecture a subdivision of our sample onto two broad categories. We base our division on X-ray properties at . This results in groups, whose properties are largely defined by gas accretion (ADAGE - accretion dominated average group environment) and systems whose diffuse thermal X-ray emission is not wholly associated with the accretion of the gas on potential wells of the group. The first category is also speculated to be baryonically closed groups based on the extrapolations of Mathews et al. (2005). Inside , we report large deviations in the mean values for entropy and pressure between the ADAGE groups (Tab.8), which suggests further refinement of the definition. We call NGC 5044, NGC 5846 regular groups (or cooling core groups), because of low scatter in their pressure and entropy profiles. In addition, these systems follow the expected entropy scaling relation, shown in Fig.2. Although, the central properties of NGC 4636 also follow the scaling relations, large deviations are seen at radius, which we attribute to an interaction with the Virgo cluster. Many underluminous ADAGE groups, are similar to regular groups at large radii. These are IC 1459, NGC 2300, NGC 4168 and NGC 4261. For NGC 2300 and NGC 4261, for which the two dimensional analysis was possible, we measure a large degree of disturbance in their gas properties. NGC 2300 might be experiencing a merger, while NGC 4261 has signatures of ongoing AGN activity.
To the second category of objects belongs NGC 5322, and perhaps NGC 3923 based on our failure to detect emission at . Although, there is a large uncertainty in parameters derived for the NGC 3665 group, it exhibits extremely low galaxy velocity dispersion for its temperature and we include it into this category.
As the division is entirely based on the entropy level, a system of low X-ray luminosity is considered a group if its temperature is proportionally low, while a different origin of the emission is suggested if the temperature is high. With the current data in hand, these two categories do not overlap in the entropy at radii exceeding .
ADAGE groups are virialized objects, whose thermodynamic properties of the X-ray emitting gas have been determined by the accretion of gas into the potential well of the group. Arguments on the conversion of neutral HI gas to hot X-ray emitting gas (Trinchieri et al. 2003) indicate that the nature of X-ray emission in the compact group HCG 92 is different. The importance of defining ADAGE is that a similar approach is adopted for simulations (e.g. Borgani et al. 2005). The weakest point, shared by all X-ray studies of groups, is that the low-mass clusters and groups show substantial deviations from the scaling laws predicted by pure gravity. So, a common approach in the modeling is to tune various feedback effects so that the simulations reproduce the observed X-ray properties of the groups. A subdivision, attempted in this paper, is aimed at outlining the potentially different origin of the X-ray emission of a subclass of X-ray underluminous groups , which is usually considered in simulations looking into the formation of early-type galaxy (e.g. Burkert & Naab 2004), while on the other hand producing a sample of objects whose properties could be compared to cluster-type simulations of e.g. Borgani et al. (2004).
![[Uncaptioned image]](/html/astro-ph/0611858/assets/x8.png)
![[Uncaptioned image]](/html/astro-ph/0611858/assets/x9.png)
![[Uncaptioned image]](/html/astro-ph/0611858/assets/x10.png)
![[Uncaptioned image]](/html/astro-ph/0611858/assets/x11.png)
![[Uncaptioned image]](/html/astro-ph/0611858/assets/x12.png)
The entropy levels of the second category of objects are up to a factor of 3 higher than the other groups in our sample, as illustrated with NGC 5322 in Fig.2, and the ASCA sample of Ponman et al. (2003). The low pressure (up to a factor of 10) and high entropy at all radii in these systems cannot be explained by infall of gas associated with group formation. Thus, it is probably more likely that the X-ray emission in these systems originates from the ISM of the galaxies and not as infalling gas. We can infer by looking at the normalization of the pressure profiles that most of the systems in question have masses about 10% of the NGC 5044 group, which places them into M⊙ range. This is more typical of massive elliptical galaxies. The existence of such objects suggests the mere presence of a faint X-ray emission in a system can be misleading. In particular, the presence of X-ray emission in a group does not always mean the system is a virialized object and the nature of these groups is still unclear. To complete the global properties of this category of groups, we note that the element abundance observed in the X-ray gas is very low, and that (under assumption of the robustness of optical metalicity indicators) contradicts the suggestion that all the gas originates from stellar mass loss. Additional insights into the origin of this component has been provided by the higher redshift part of this survey, which includes HCG92 (Finoguenov et al. 2005b), for which Trinchieri et al. (2003) argue that shock heating of an HI cloud is now generating the X-ray emitting group gas. They reach the conclusion that the faint diffuse X-ray component is from a galaxy interacting with the group. We note that NGC 5322 has a counter-rotating core, which is most certainly a result of a recent merger. The high entropy level of the observed component requires cooling times longer than the Hubble time to remove the high entropy gas (e.g. Voit et al. 2003). So we expect the faint X-ray halo to be an indicator for and a fossil record of the merger history of early-type galaxies. These arguments can also be extended to the faint X-ray halos of post-merger galaxies, reported in Read & Ponman (1998). On the other hand, spiral dominated groups studied here (NGC 7582) and in the literature (Mulchaey et al. 1996) do not have detected extended X-ray emission on 100 kpc scales, with first detections of extended emission on 20 kpc scales by Pedersen et al. (2005). This may indicate that the majority of spiral rich groups neither possess large mass halos nor have undergone the galaxy-galaxy interactions needed to form a diffuse hot halo, similar to X-ray faint groups like NGC 5322 and HCG 92.
4.3. Maps
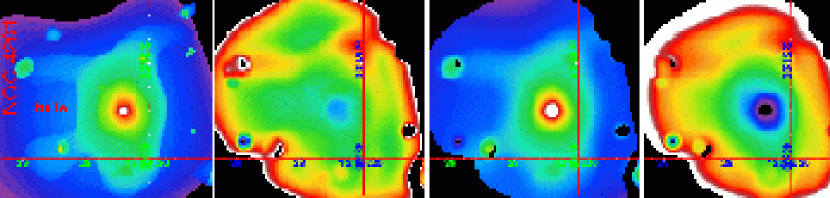
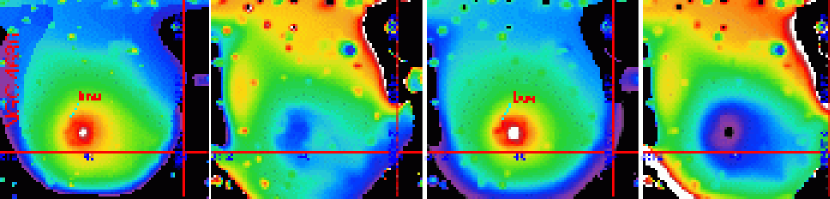
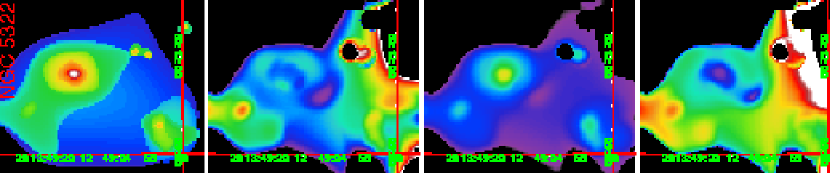
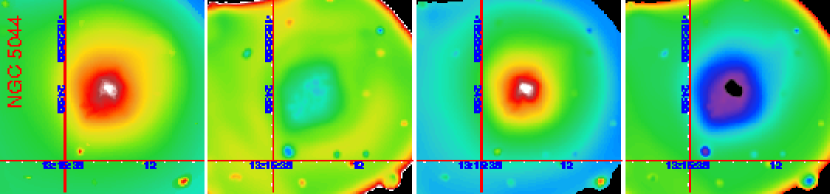
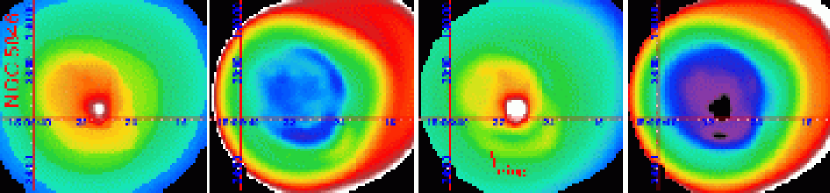
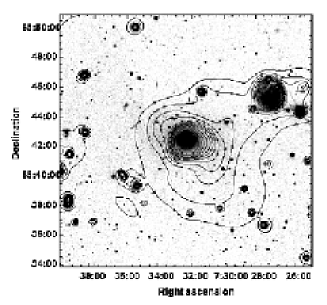
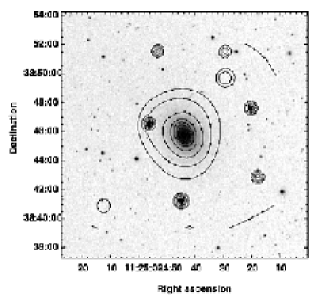
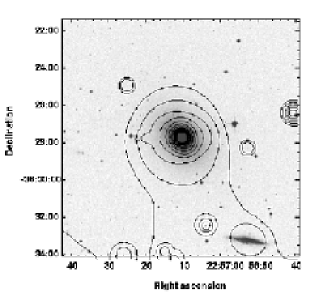
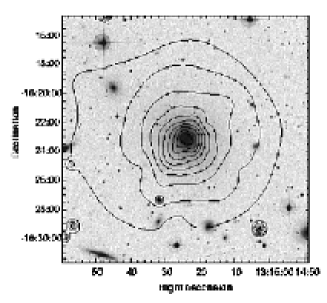
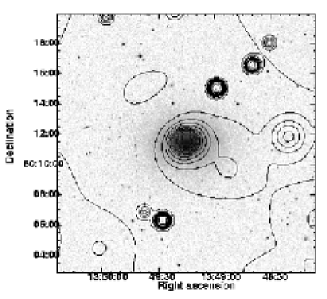
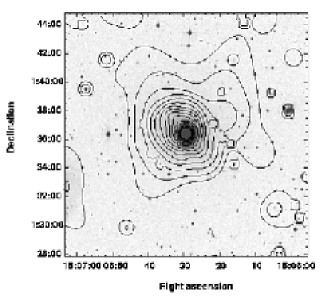
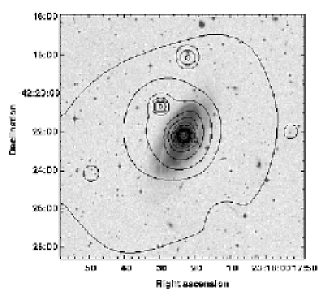
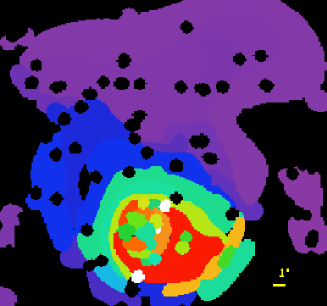
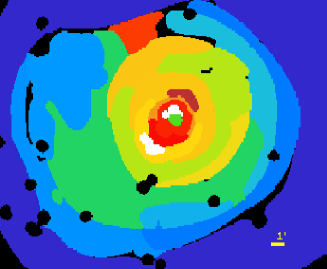
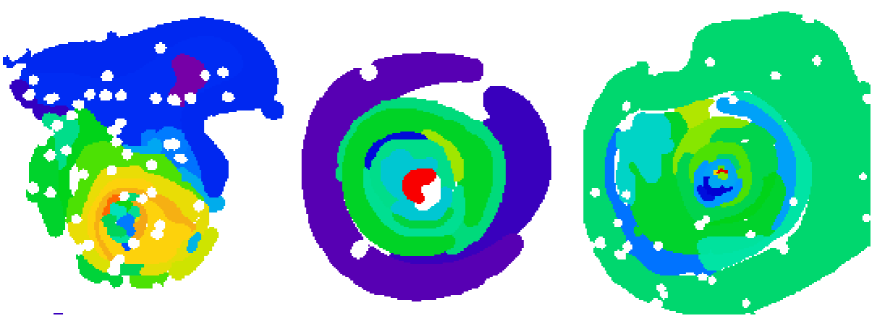
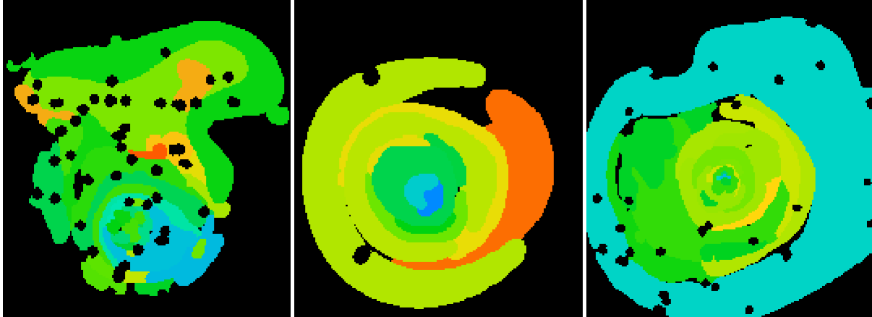
We present in this section the surface brightness, temperature, projected pressure and entropy maps in Fig.3, where the details of the map construction are described above. Overlays with DSS2 R band images are shown in Fig.4 and individual systems are discussed in the subsections below. Although the maps present projected properties, they could be shown to give an insight on the 3d properties (Schuecker et al. 2004; Dolag et al. 2005).
5. Discussion
Before discussing the individual systems, we outline the sources of variations seen in the maps in Fig.3. Among the four maps presented, only two are independent and in principle sufficient for the analysis. Although surface brightness analysis and temperature maps are more commonly used in studies of groups and clusters, pressure and entropy maps are more straight-forward to interpret. The pressure traces the generalized stress tensor, which in the case of a system in hydrostatic equilibrium and without dynamically important magnetic fields is given by the gravitational potential. Departures from equilibrium are likely to be local, i.e. seen as pressure fluctuations on the map. Common examples include shocks (e.g. Markevitch et al. 2002; Jones et al. 2002; Henry et al. 2004; Finoguenov et al. 2004a, 2004b) and pressure waves (e.g. Fabian et al. 2003; Schuecker et al. 2004). Substructure can also be seen in pressure maps as secondary peaks, provided that it retains its own gas or it moves subsonically. The entropy map for a system in equilibrium should be symmetrical around the center and exhibit an increasing entropy level with increasing radius. Deviations in the entropy maps in the form of low entropy gas displaced from the center are either due to development of instabilities (e.g. cold fronts in A3667, Vikhlinin et al. 2001 and in A3562, Finoguenov et al. 2004b; shear instability in A3667, Mazzotta et al. 2002; Briel et al. 2004), which are slow to relax (0.2 of the sound speed, Ricker & Sarazin 2001) or the result of stripping (M86, Finoguenov et al. 2004a). These are examples of low entropy gas displaced from the center. Off-center low entropy zones associated with local gravitational minima (e.g. secondary pressure peaks, or simply galaxies, as in Finoguenov et al. 2004c), are indicators of substructure. In addition, areas of high-entropy gas, found surrounding low-entropy gas (so called buoyant bubbles) are produced by in situ heating, most likely by AGN (for examples see NGC 4261 below).
Since the X-ray emission of groups is strongly dominated by Fe lines, the maps are also affected by patchy metalicity distributions. In our discussion below of individual features, we deconvolve the effects of enhanced density from the effects of the enhanced metalicity or indicate where this separation is not obvious. Patchiness of the metalicity distribution has not been studied in detail before and could be an important factor indicating the processes of the metal release into the intragroup medium. One of the well-established examples of such a process is the gas entrainment by the jet-induced instabilities in M87 (Churazov et al. 2001), which brings low-entropy, high metalicity gas from the inner kpcs of M87 out to 50 kpc radius.
The systematic analysis of the metalicity distribution using the regions in NGC 4636, NGC 5044 and NGC 5846 is reported in Tab.8. With the typical size of the resolution element of 2–10 kpc, sampling the area within 20–50 kpc from the brightest group galaxy, we find that the profiles are consistent with a linear decrease with radius, reaching 0.3 solar value by . The scatter of points around the best fit is high, 30–50%, which characterizes the degree of patchiness on 20–50 kpc scales.
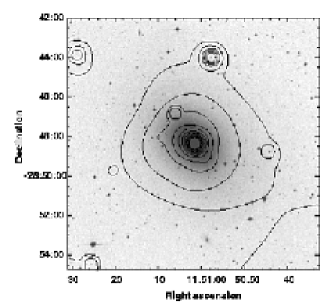
5.1. NGC 2300,
The pressure and entropy structure consists of two blobs, centered on NGC 2300 and NGC 2276. The pressure map contain a large-scale bow-shape enhancement outside the low entropy gas centered on NGC 2300. Such gas compressions are possible in several cases: supersonic motion of NGC 2300 with respect to the group; supersonic interaction between NGC 2300 and NGC 2276; presence of substructure around NGC 2300. In any case, the dispersion in the pressure map of NGC 2300, reported in Tab.8, is high, in comparison to other groups. Since this does not seem to be an effect of confusion with a background object, as is sometimes the case (Mahdavi et al. 2005), we suggest, based on a similar work applied to simulations (Finoguenov et al. in prep.), that the NGC 2300 group exhibits the signs of a merger. The pressure and entropy deviations southwest of the center may be explained if there is ongoing gas accretion from the south. NGC 2276 (Arp 25) is considered a strongly interacting object (Gruendl et al. 1993; Hummel & Beck 1995), which supports our suggestion on the supersonic interaction. The line-of-sight velocity difference between NGC 2276 and NGC 2300 amounts to km s-1, which is supersonic with respect to the sound speed for the IGM temperature of 0.7 keV. In general, late-type spiral galaxies are considered to be currently infalling and moving on radial orbits (Biviano & Katgert 2004).
There is an entropy bridge (shown in green color in Fig.3) toward the second galaxy (NGC 2276), suggesting absence of a large line-of-sight separation between the two. This implies that gas in the halo of the spiral galaxy is interacting with IGM of the group.
Spectroscopic results suggest that apart from the very center of the elliptical and one arcminute around the spiral, the temperature distribution is nearly isothermal. Extensions of the pressure to the south-west and to the west are confirmed and are evaluated to be a factor enhancement. The extension of the low entropy zone to the south-west is characterized by a % lower entropy and the entropy bridge, which has an entropy of keV cm2, is a factor of 2 lower, both compared to a typical entropy at the same distance to NGC 2300, estimated from the annuli.
5.2. NGC 3665,
The bright part of the emission extends to in radius, centered on NGC 3665 and has a similar elongation as the galaxy’s major axis. There is also a very bright background AGN east of the galaxy.
Due to lack of counts, the spectral analysis was done on 4 zones that are symmetric around the center, which precludes revealing any 2d structure.
5.3. IC 1459,
IC 1459 is a well studied elliptical galaxy with a known hard X-ray component suggestive of an AGN (Matsumoto et al. 1997). Recent Chandra observations of this system reveal that the nuclear X-ray source has a luminosity Lx= erg s-1 in the 0.3–8 keV band and a slope =1.880.09 (Fabbiano et al. 2003).
In carrying out the spectral analysis we have accounted for the presence of the AGN in IC 1459 by introducing a variable slope power law component with a variable absorption in our spectral fits for the central region. The presence of the bright point-source at the center of the group complicates the spectral analysis. We find a significant temperature variation distance from the center, rising from to keV, with the hotter temperature observed to the north-west and south-east of the galaxy. Additional attempts to further quantify the substructure in this compact system were stymied by the point source in the center, the relatively large wings in the PSF, and the low number of counts in the diffuse gas. Outside the region of the temperature rise, the group gas has a constant temperature profile, at least within the temperature error, while the other fitted quantities can vary significantly. But with the contribution of the scattered photons from the central point source we reserve judgement on the physical nature of the variations. In addition to the XMM data there is also a Chandra observation of this system and it may provide insight into the diffuse gas but that analysis is beyond the scope of this paper.
5.4. NGC 3923,
The central galaxy of this group, NGC 3923, is a nearby early-type galaxy classified as E4 (de Vaucouleurs et al. 1991). This galaxy has numerous shell structures (Malin & Carter 1983) indicating past merger activity but shows no signs of an AGN.
The X-ray surface brightness of this group has a regular appearance and the X-ray emission can be traced to about . This group shows the presence of numerous point sources which somewhat complicates the analysis. NGC 3923 has previous ROSAT PSPC and HRI data. The PSPC spectral results are for two zones out to 2′ and show no evidence for a temperature gradient (Buote & Canizares 1998) at the level of keV. The ASCA data for a slightly larger region indicate a slightly higher best fit temperature of keV (Sato & Tawara 1999), yet a two-component fit yields a temperature of 0.55 keV (Buote & Fabian 1998). The XMM data reveals a temperature structure within 2′ consisting of patches of lower ( keV) temperature and an approximately constant temperature outside this region at the level of keV. We note that we include a hard component as part of the fit to account for a contribution of unresolved LMXB.
The results of the spectroscopic analysis reveal that variations in the temperature are associated with the presence of the gas with entropy lower than the value expected by interpolating other points. Such low-entropy regions could, for example, be produced by gas entrainment during preceding jet activity and have not yet settled down. An alternative explanation may be that merger activity can inject low entropy gas. The statistical analysis, reported in Tab.8 concludes that the statistically significant fluctuations are only seen in the entropy.
Overall, the pressure map shows a fairly symmetric structure. There is a small enhancement 0.5 arcminute to the north-east of the galaxy, which is blended with the central emission and cannot be separated spectrally for an independent analysis. This enhancement is visible on the temperature map and may show up faintly in the entropy map. Overall the entropy map appears quite symmetric as well.
The overlay of the X-ray surface brightness contours on the optical image shows the enhancement in the pressure corresponds to the direction of the major axis of the galaxy and therefore might be associated with triaxiality of the gravitational profile.
5.5. NGC 4168,
The two peaks in the pressure and entropy maps correspond to the two bright galaxies in the XMM field of view. The pressure map does not show any sign of hydrodynamic interaction between those two galaxies and is elongated to the north, possibly indicating the direction of the gas accretion.
Lack of counts precludes a detailed analysis of this group. The galaxy to the west (NGC 4164) turns out to be a background galaxy (, while the central galaxy in this group, NGC 4168, has a velocity of ). While a discrimination of the background galaxy is trivially done by separating them in the velocity space, the important point is that we were able to separate the effects of projection from the interaction.
5.6. NGC 4261,
X-ray emission of NGC 4261, also reported in Gliozzi et al. 2003, extends over the whole XMM field of view. Both pressure and entropy maps appear symmetric with some elongation in the north-south direction.
![[Uncaptioned image]](/html/astro-ph/0611858/assets/x29.png)
The surface brightness profile in NGC4261. The circles (stars) demarcate the profile in the north-south (east-west) direction. The figure zooms in to the spatial region, where differences are seen, while the profiles are identical within the central and outside .
![[Uncaptioned image]](/html/astro-ph/0611858/assets/x30.png)
Wavelet reconstructed X-ray image of NGC 4261, overlaid with the radio contours.
The spectroscopic analysis confirms the extension in the pressure in the north and south directions. Overall, the very high temperature (1.–1.5 keV) and low luminosity of the system yield very high entropy levels.
The differences between the north-south and the east-west directions are clearly seen in the surface brightness reported in Fig.3 as well as in the profile shown in Fig.5.6. The profiles are identical within the central and outside . An explanation to the peculiar emission in NGC 4261 is offered through the comparison with the radio data, as is seen in Fig.5.6, the radio lobes fill the space between the X-ray emission. The presence of the radio bubble introduces an additional pressure at the level of dyne cm-2. Detailed analysis shows that the thermal gas inside the eastern bubble is in pressure equilibrium with its immediate surroundings. The gas inside the bubbles is characterized by a higher entropy keV cm2 to the east and keV cm2 to the west compared with keV cm2 at similar distance to the center as well as keV cm2 in the central 10 kpc. The western bubble has lower pressure compared to surroundings, indicating an importance of the relativistic particle energy. Our measurements support the claim of Croston et al. (2005) of finding the direct evidence of the AGN reheating of gas in groups. We note a remarkable similarity in the optical properties of NGC 4261 and NGC 5322, they have similar absolute B magnitudes (derived using the distance measurements from Tonry et al. 2001 and the corrected B magnitude from the RC3), -19.52 and -19.84 respectively, they are both classified as liners, and the effective radii are similar, log re=1.59 and 1.54 respectively. In addition the colors are similar =0.03 as are the color gradients (Michard 1999). Yet, the entropy of the gas at the center of NGC 4261 is a factor of four larger (the entropy in the core of NGC 5322 is keV cm2). As the gas properties at the center are dominated by the stellar mass loss which is expected to be the same between the two galaxies, the observed difference measures the degree of impact the AGN has on the interstellar medium.
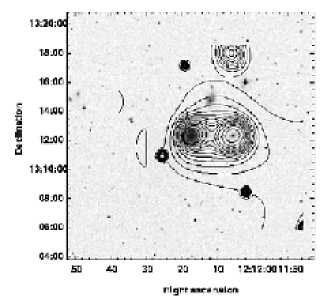
5.7. NGC 4636,
NGC 4636 has been classified as a very symmetric, E0, elliptical galaxy (RC3) based on the optical analysis of the central region. However, at larger radii the optical isophotes become increasingly elliptical (King 1978). The Einstein IPC image of this galaxy reflects the optical morphology with very symmetric emission near the center and asymmetry on larger scales (Forman et al. 1985; Stanger & Warwick 1986). The ROSAT PSPC data show a flattening of the X-ray surface brightness profile starting about 4 to the north-east of the galaxy center (Trinchieri et al. 1994).
The XMM data show this flattening of the profile at the same position as the PSPC data. Examining the pressure map near this location we identify a peculiar inward-pointed bow-shape enhancement also 4 arcminutes to the north-east from the center. We find no associated entropy dip with any of these pressure enhancements. This might indicate the presence of a shock. Similar conclusions have been reported using Chandra observations (Jones et al. 2002).
The entropy map shows complex structures which are well correlated with structures seen in the pressure map in the inner 3. At larger radii the entropy map shows fewer distinct features. One possible explanation for the small scale features might be that foreground or background objects might be contributing to the X-ray emission at these locations. However, the DSS optical image does not reveal any optical object corresponding to the identified pressure and entropy features.

The most striking large-scale feature of NGC 4636 consists of the strong enhancement of the emission 10 arcminutes to the north from the center, which we will refer to as a plume (Fig.6). Although appearing on the edge of the XMM-Newton field of view, this emission is also seen in ROSAT data. The optical data do show that there is a small galaxy concentration to the north of the galaxy. Redshift information from NED shows that this group has a redshift of , but this system does not coincide with features in the maps. Also, an association with the polar spur appears unlikely, as no peculiarity is seen in the IR maps. Furthermore, the parameters of the emission (0.6 keV) are not typical of that of the spur (0.3 keV). In addition, we have examined the RASS data and this is not part of a larger scale feature that extends beyond the XMM FOV.
The results of spectral analysis reported in Fig.6-6 show that the plume has a similar pressure to the surroundings, and it has a low element abundance consistent with its surroundings. However, the entropy is low when compared to the surrounding gas and indeed shows some of the lowest entropy in the NGC 4636 system. One explanation is that this is low-entropy group gas. Analysis of the pressure map indicates an azimuthal variation in the pressure at radius from the center, possibly related to the origins of the plume. Low entropy gas is seen to the south and west of the galaxy center. The structure of this low entropy gas is reflected in the iron abundance maps and can be seen as a region of high abundance. The plume to the north of the galaxy is a sign that NGC 4636 is undergoing stripping. Recently Chandra observation have revealed a cold front on the southern part of NGC4636 (Jones, C. 2004, private communication), which on one hand is an additional argument supporting our association of the plume with the ongoing stripping process and on the other, favors a core oscillation scenario (.e.g. Tittley & Henriksen 2005) as an origin of interaction. In the case of NGC4636, the core oscillation could be caused by the gravitational pull of the Virgo supercluster, a suggestion that could be tested using numerical simulations. The iron abundance map, present in Fig.6, reveals a strong contrast in the metalicity. The metalicity inside the central (5.9 kpc) varies between 0.5 and 1.0 with a typical error of 0.05 and a typical element resolution of 2 kpc. At distance from the center the metalicity reaches value (shown in red). The high-metalicity zone has a stronger extension towards the south-west. The metalicity of the plume is much lower, , but comparable to the zone outside the core at a similar () distance to the center, studied with annuli.
Our reinvestigation of the group membership suggest absence of galaxies at velocities similar to NGC 4636. On the other hand, the arguments of the X-ray analysis infer that NGC 4636 has a group-size halo, which confirms a conclusion of Matsushita et al. (1998) attributing NGC 4636 to fossil groups, a recently emerged class of objects (Ponman & Bertram 1993; Vikhlinin et al. 1999; Mulchaey & Zabludoff 1999).
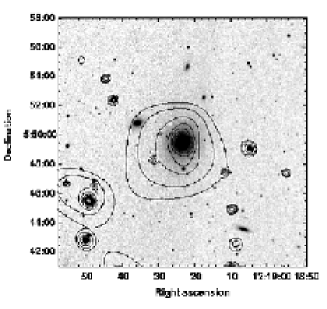
5.8. NGC 5044,
The two dimensional spectral mapping of the properties of the X-ray emission from NGC 5044 is done at the effective 4–10 kpc resolution, within the central 50 kpc. The temperature map of NGC 5044 (Fig.3) reveals a cool zone one arcminute south-east from the X-ray center. The parameters of this zone are the following: , kT keV, FeFe⊙, S= keV cm2, P dyne cm-2. This feature has been seen in the analysis of the ROSAT data by David et al. (1994), who associate its appearance with a cooling wake. The idea was that motion of NGC 5044 in the cooling gas of its group creates an enhancement of the dropping-in gas behind the galaxy. However, an assumption of the cooling flow, used in that scenario is no longer a prefered interpretation of the data (e.g. Tamura et al. 2001). XMM-Newton data, shown in Figs.6–6 reveal that the wake has an entropy lower compared to both the mean trend for the atmosphere of NGC 5044 as well as the entropy of the gas located on the opposite side from the center. On the other hand, the entropy of the wake is similar to the entropy of the gas at the center, which suggests a similar origin. The characteristics of the central region where a similar mass of the gas is encompassed are the following: kT keV, FeFe⊙, S= keV cm2, P dyne cm-2. The parameters of the gas at the same distance to the center as the wake are: kT keV, FeFe⊙, S= keV cm2, P dyne cm-2. High metalicity of the wake, detected by XMM-Newton, also supports a conclusion of the same origin of the gas in the wake and in the center of NGC 5044. After reexamining the origin of the wake, we conclude that both the motion of the galaxy (e.g. due to the core oscillations) and former AGN activity can provide an explanation. The extent and form of the entropy wake of NGC 5044, shown in Fig.6 supports the gas stripping hypothesis. The reported deviations bear a local character, while the statistical analysis run within the radius from the center (Tab.8) confirms the regularity in the pressure distribution. A dispersion in the Fe abundance (Tab.8) is higher than the dispersion in the entropy (Tab.8), indicating different origins of the gas that shares the same state. Indeed, stellar mass loss of the central galaxy, stripping of the group members as well as low-entropy part of the intragroup medium are very close in their gas characteristics, yet poses a different metalicity. We conclude that XMM-Newton supports the work on using the metalicity as a tracer of the formation of IGM (e.g. Schindler et al. 2004).
5.9. NGC 5322,
The central galaxy NGC 5322 is a bright, E3 galaxy (de Vaucouleurs et al. 1991). Early radio observations show that this galaxy is a weak radio source (Feretti & Giovannini 1980; Hummel 1980) with symmetric jets emanating from an unresolved core located at the optical center (Feretti et al. 1984).
The bright part of the X-ray emission is rather compact (), peaked on NGC 5322, and extends only to the south of the galaxy. There is a dip in the entropy map 1.2 arcminutes to the south-west from the center with no optical counterpart in DSS2 images. Insufficient quality of the data only allowed us to select 6 regions for the spectral analysis, precluding us from confirming the entropy dip. The enhancement in the pressure to the south-east of NGC 5322 is only marginally seen in the spectral analysis.
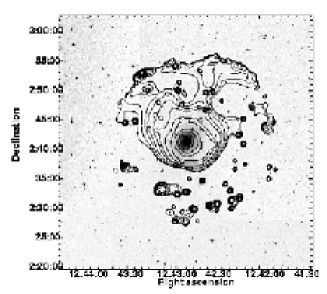
5.10. NGC 5846,
This system reveals a number of ring-like structures in the image, which we identify with metalicity enhancements. No optical counterpart for this structure is seen in the DSS2 images, consistent with the idea of metalicity enhancements. Although an optical image reveals a small galaxy south to NGC 5846 (NGC 5846a, velocity difference 500 km/s), it is not demarcated on the entropy map. This rules out a significant gas halo for this object and so it should have in any case a negligible impact on the X-ray appearance.
The two dimensional spectral mapping of the properties of the X-ray emission from NGC 5846 is done at the effective 6–10 kpc resolution, within the central 50 kpc. As the spectroscopic analysis shows (see Fig.6), entropy, pressure, temperature and iron abundance all appear relaxed with only a slight displacement between the central peak and the center of the large-scale emission. The large-scale elongation of the entropy is confirmed and an associated elongation in the high-element abundance zone is found. In addition, some disturbance in the pressure map is observed in the core. Given the long time scale for the entropy disturbance to relax, it is not surprising that the associated radio activity is not observed. The presence of an AGN in NGC 5846 is supported by the detection of a central radio point source in the NRAO VLA Sky Survey (Becker et al. 1995). There is a zone of high Fe abundance to the north-east from the center (shown in red in Fig.6, on the level of solar, compared to detected at a similar distance from the center, which is a base of our claim on metalicity variations. Patches of higher abundance, shown in white in Fig.6 correspond to a values and are of marginal significance.
Another possibility is that the structures seen in NGC 5846 are sound waves, as have recently been reported for the Perseus cluster (Fabian et al. 2003).
5.11. NGC 7582,
The extent of the X-ray emission of NGC 7582 is shown in Fig.4. Two other galaxies, NGC 7590 and NGC 7599, (not shown in Fig.4) also reveal extended X-ray emission on the scales of , each one centered on a galaxy. Our study confirms the lack of diffuse X-ray emission from this group reported by Mulchaey & Zabludoff (1998) based on the ROSAT data. NGC 7582 is a well studied Seyfert 2 galaxy. Its hard (2-10 keV) X-ray emission has been detected in many X-ray surveys (Ward et al. 1978) and the X-ray spectrum of this AGN is complex (c.f. Turner et al. 2000). Detailed spectroscopic analysis shows a presence of emission from the AGN and complex diffuse emission from the bright spiral galaxy (NGC 7582). Since the origin of the emission from the spiral galaxy is likely to be a mixture of emission from hot gas, point sources and supernova remnants, which is quite different from the rest of the sample, we omit this system from further analysis.
In Koribalski (1996) the HI image of the NGC 7582 group was presented. A comparison shows that the X-ray emission is embedded within the , and that the shape of the X-ray emission is determined by the star-formation processes, as opposed to the case where the hot gas fills the potential of the galaxy.
6. Summary and Conclusions
We performed an innovative 2-dimensional analysis of the IGM properties in a representative sample of low-z groups of galaxies. We have well sampled the transition region between the regular groups and the X-ray faint groups and also have two examples of a strong AGN feedback.
The properties of the hot gas in the X-ray faint groups are studied at radii reaching for the first time. The properties of the hot gas in NGC 5322 and NGC 3923 deviate from the relations derived using brighter groups and clusters even at largest radii. These faint systems having higher entropy and lower pressure than expected. Our findings suggest that the X-ray emitting gas in roughtly half of X-ray faint groups (groups with bolometric ergs s-1) does not originate from infalling gas heated to X-ray temperatures but instead is a byproduct of the galaxy-galaxy merger activity associated with the formation of an elliptical galaxy. In fact, we note a similarity in the properties of the X-ray faint groups studied here and the X-ray appearance of the post-merger galaxies.
Four other X-ray faint groups, IC 1459, NGC 2300, NGC 4168 and NGC 4261, exhibit typical group IGM properties outside and we consider them as regular groups. One such group, NGC4261, also reveals AGN activity and our study reveals faint X-ray cavities, filled with the relativistic plasma, extending to a similar distance from the center, which are also reported in Croston et al. (2005) and confirms their conclusion that AGN activity has a substantial impact on the state of the gas at the central part of groups.
Examination of the structure in the gas of three groups reveals fluctuations in the entropy and pressure on a typically 10-30% and metalicity on the 30–50% level. The larger scatter in the metalicity of the gas within the group, compared to its entropy suggests a diversity in the origin of the gas in the core and supports the work on using the metalicity as a tracer of the formation of IGM. However, use of metalicity measurements is currently limited to a small number of systems, due to requirement of a large number of detected counts in each region. In our study, such analysis is only possible for NGC4636, NGC5044 and NGC5846.
The two dimensional information, related to the analysis reported in this paper, is released under http://www.mpe.mpg.de/2dXGS/ homepage.
7. Acknowledgments
The paper is based on observations obtained with XMM-Newton, an ESA science mission with instruments and contributions directly funded by ESA Member States and the USA (NASA). The XMM-Newton project is supported by the Bundesministerium für Bildung und Forschung/Deutsches Zentrum für Luft- und Raumfahrt (BMFT/DLR), the Max-Planck Society and the Heidenhain-Stiftung, and also by PPARC, CEA, CNES, and ASI. The authors thank an anonymous referee for an insightful referee report, which led to substantial improvements in the quality of presented material. AF thanks Joe Mohr, Stefano Borgani, Trevor Ponman, and Mark Henriksen for useful discussions. AF thanks Steve Helsdon for his help in the regression analysis. AF acknowledges support from BMBF/DLR under grant 50 OR 0207, MPG and a partial support from NASA grant NNG04GF686. AF and MZ thank the Joint Astrophysical Center of the UMBC for the hospitality during their visit. DSD acknowledges partial support for this project from NASA grant NAG5-12739. JSM acknowledges partial support for this program from NASA grant NNG04GC846.
References
- (1) Anders, E. & Grevesse, N. 1989, GeCoA, 53, 197
- (2) Becker, R. H., White, R. L., & Helfand, D. J. 1995, ApJ, 450, 559
- (3) Bender, R., Burstein, D., & Faber, S. M. 1992, ApJ, 399, 462
- (4) Bîrzan, L., Rafferty, D. A., McNamara, B. R., Wise, M. W., & Nulsen, P. E. J. 2004, ApJ, 607, 800
- (5) Biviano, A., & Katgert, P. 2004, A&A, 424, 779
- (6) Borgani S., et al., 2004, MNRAS, 348, 1078
- (7) Borgani, S., Finoguenov, A., Kay, S. T., Ponman, T. J., Springel, V., Tozzi, P., & Voit, G. M. 2005, MNRAS, 529
- (8) Briel, U. G., Finoguenov, A., Henry, J. P. 2004, A&A, 426, 1
- (9) Buote, D. A., Canizares, C. R. 1998, MNRAS, 298, 811
- (10) Buote, D. A., Fabian, A. C. 1998, MNRAS, 296, 977
- (11) Burkert, A., & Naab, T. 2004, Coevolution of Black Holes and Galaxies, 422
- (12) Churazov, E., Brüggen, M., Kaiser, C. R., Böhringer, H., & Forman, W. 2001, ApJ, 554, 261
- (13) Croston, J. H., Hardcastle, M. J., & Birkinshaw, M. 2005, MNRAS, 357, 279
- (14) David, L. P., Jones, C., Forman, W., Daines, S. 1994, ApJ, 428, 544
- (15) Davies, R. L., Burstein, D., Dressler, A., et al. 1987, ApJS, 64, 581
- (16) Davis, D. S., Mushotzky, R. F., Mulchaey, J. S., et al. 1995, ApJ, 444, 582
- (17) Davis, D. S., Mulchaey, J. S., Mushotzky, R. F.& Burstein, D. 1996, ApJ, 460, 601
- (18) Dekel, A., Stoehr, F., Mamon, G. A., Cox, T. J., Novak, G. S., & Primack, J. R. 2005, Nature, subm., (astro-ph/0501622)
- (19) de Vaucouleurs, G., de Vaucouleurs, A., Corwin, H. G., et al. 1991, Third Reference Catalogue of Bright Galaxies, Springer
- (20) Dolag, K., Vazza, F., Brunetti, G., & Tormen, G. 2005, MNRAS, 364, 753
- (21) Dos Santos, S. & Doré, O. 2002, A&A, 383, 450
- (22) Evrard, A. E. & Henry, J. P. 1991, ApJ, 383, 95
- (23) Fabbiano, G., Elvis, M., Markoff, S., et al. 2003, ApJ, 588, 175
- (24) Fabian, A. C., Sanders, J. S., Allen, S. W., Crawford, C. S., Iwasawa, K., Johnstone, R. M., Schmidt, R. W., & Taylor, G. B. 2003, MNRAS, 344, L43
- (25) Feretti, L., Giovannini, G. 1980, A&A 92, 296
- (26) Feretti, L., Giovannini, G., Hummel, E. & Kotanyi, C. G. 1984 A&A, 137, 362
- (27) Finoguenov, A., Jones, C., Forman, W., & David, L. 1999, ApJ, 514, 844
- (28) Finoguenov, A. & Ponman, T. J. 1999, MNRAS, 305, 325
- (29) Finoguenov, A. & Jones, C. 2000, ApJ, 539, 603
- (30) Finoguenov, A. & Jones, C. 2001, ApJ, 547, L107
- (31) Finoguenov, A., Reiprich, T., Böhringer, H. 2001, A&A, 368, 749
- (32) Finoguenov, A., Jones, C., Böhringer, H., & Ponman, T. J. 2002, ApJ, 578, 74
- (33) Finoguenov, A., Briel, U. G., & Henry, J. P. 2003a, A&A, 410, 777
- (34) Finoguenov, A., Burkert, A., Böhringer, H. 2003b, ApJ, 594, 136
- (35) Finoguenov, A., Miniati, F. 2004, A&A, 418, L21
- (36) Finoguenov, A., Pietsch, W. N., Aschenbach, B. R., Miniati, F. 2004a, A&A, 415, 415
- (37) Finoguenov, A., Henriksen, M. J., Briel, U. G., de Plaa, J., Kaastra, J. S. 2004b, ApJ, 611, 811
- (38) Finoguenov, A., Briel, U. G., Henry, P. J., et al. 2004c, A&A, 419, 47
- (39) Finoguenov, A., Böhringer, H., Osmond, J.P.F., Ponman, T.J., Sanderson, A.J.R., Zhang, Y.-Y., Zimer, M., 2005a, Adv. in Sp. Sci., 36, 622
- (40) Finoguenov, A., Ponman, T.J., Osmond, J.P.F., Zimer, M. 2005b, MNRAS, subm.
- (41) Forman, W., Jones, C., & Tucker, W. H. 1985, ApJ, 293, 102
- (42) Freyberg, M. J., Briel, U. G., Dennerl, K., et al. 2004, SPIE, 5165, 112
- (43) Garcia, A. M. 1993, AAPS, 100, 47
- (44) Geller, M. J., & Huchra, J. P. 1983, ApJS, 52, 61
- (45) Gliozzi, M., Sambruna, R. M., & Brandt, W. N. 2003, A&A, 408, 949
- (46) Gruendl, R. A., Vogel, S. N., Davis, D. S., Mulchaey, J. S. 1993, ApJL, 413, L81
- (47) Helsdon, S. F. & Ponman, T. J. 2000, MNRAS, 319, 933
- (48) Henry, J. P., Finoguenov, A., Briel, U. G. 2004, ApJ, 615, 181
- (49) Hickson, P. 1982, ApJ, 255, 382
- (50) Ho, L. C., Filippenko, A. V., Sargent, W. L. W. 1995, ApJS, 98, 477
- (51) Huchra, J. P., & Geller, M. J. 1982, ApJ, 257, 423
- (52) Hummel, E. 1980, A&AS, 41 151
- (53) Hummel, E., & Beck, R. 1995, A&A, 303, 691
- (54) Hwang, U., Mushotzky, R. F., Burns, J. O., Fukazawa, Y., & White, R. A. 1999, ApJ, 516, 604
- (55) Jansen, F., Lumb, D., Altieri, B., et al. 2001, A&A, 365, L1
- (56) Jones, C., Forman, W., Vikhlinin, A., et al. 2002, ApJ, 567, L115
- (57) Kaiser, N. 1986, MNRAS, 222, 323
- (58) Kaiser, N. 1991, ApJ, 383, 104
- (59) King, I. R. 1978, ApJ, 222, 1
- (60) Kodama, T., Smail, I., Nakata, F., Okamura, S., & Bower, R. G. 2001, ApJL, 562, L9
- (61) Koprolin, W. & Zeilinger, W. W. 2000, A&AS, 145, 71
- (62) Koribalski, B. 1996, ASP, 106, 238
- (63) Lumb, D. H., Finoguenov, A., Saxton, R., et al. 2003, ExA, 15, 89
- (64) Mahdavi, A., Böhringer, H., Geller, M. J., & Ramella, M. 2000, ApJ, 534, 114
- (65) Mahdavi, A., Finoguenov, A., Böhringer, H., Geller, M. J., Henry, J. P. 2005, ApJ, 622, 187
- (66) Maia, M. A. G., da Costa, L. M., Latham, D. W. 1989, ApJS, 69, 809
- (67) Malin, D. F. & Carter, D. 1983, ApJ, 274, 534
- (68) Markevitch, M. 1998, ApJ, 504, 27
- (69) Mathews, W. G., Faltenbacher, A., Brighenti, F., & Buote, D. A. 2005, ApJ, 634, L137
- (70) Matsumoto, H., Koyama, K., Awaki, H., et al. 1997, ApJ, 482, 133
- (71) Matsushita, K. 2001, ApJ, 547, 693
- (72) Mazzotta, P., Fusco-Femiano, R., & Vikhlinin, A. 2002, ApJ, 569, L31
- (73) McNamara, B. R., Wise, M. W., Nulsen, P. E. J., David, L. P., Carilli, C. L. 2001, ApJL, 562, L149
- (74) McNamara, B. R., Wise, M. W. & Murray, S. S. 2004, ApJ, 601, 173
- (75) Metzler, C. A. & Evrard, A. E. 1994, ApJ, 437, 564
- (76) Michard, R. 1999, A&AS 137, 245
- (77) Mulchaey, J. S., Davis, D. S., Mushotzky, R. F., Burstein, D. 1993, ApJL, 404,9
- (78) Mulchaey, J. S. & Zabludoff, A. I. 1998, ApJ, 496, 73
- (79) Mulchaey, J. S. & Zabludoff, A. I. 1999, ApJ, 514, 133
- (80) Mulchaey, J. S., Davis, D. S., Mushotzky, R. F., Burstein, D. 1996, ApJ, 456, 80
- (81) Mulchaey, J. S. 2000, ARAA, 38, 289
- (82) Mulchaey, J. S., Davis, D. S., Mushotzky, R. F., Burstein, D. 2003, ApJS, 145, 39
- (83) Mushotzky, R., Figueroa-Feliciano, E., Loewenstein, M., Snowden, S. L. 2003, preprint astro-ph/0302267
- (84) Nolthenius, R. 1993, ApJS, 85, 1
- (85) Osmond, J. P. F. & Ponman, T. J. 2004, MNRAS, 350, 1511
- (86) Ostriker, J. P., Lubin, L. M., Hernquist, L. 1995, ApJ, 444, L61
- (87) Pedersen, K., Rasmussen, J., Sommer-Larsen, J., Toft, S., Benson, A. J., & Bower, R. G. 2005, ArXiv Astrophysics e-prints, arXiv:astro-ph/0511682
- (88) Ponman, T. J. & Bertram, D. 1993, Nature, 363, 51
- (89) Ponman, T. J., Bourner, P. D. J., Ebeling, H., Böhringer, H. 1996, MNRAS, 283, 690
- (90) Ponman, T. J., Cannon, D. B., Navarro, J. F. 1999, Nature, 397, 135
- (91) Ponman, T. J., Sanderson, A. J. R., Finoguenov, A. 2003, MNRAS, 343, 331
- (92) Pratt, G. W., Arnaud, M. 2003, A&A, 408, 1
- (93) Read, A. M. & Ponman, T. J. 1998, MNRAS, 297, 143
- (94) Reiprich, T. H. & Böhringer, H. 2002, ApJ, 567, 716
- (95) Ricker, P. M., Sarazin, C. L. 2001, ApJ, 561, 621
- (96) Rines, K., Geller, M., Diaferio, A., et al. 2001, ApJ, 124, 1266
- (97) Romanowsky, A. J., Douglas, N. G., Arnaboldi, M., et al. 2003, Science, 301, 1696
- (98) Schindler, S. 2004, Ap&SS, 289, 419
- (99) Schuecker, P., Finoguenov, A., Miniati, F., Böhringer, H., Briel, U. G. 2004, A&A, 426, 387
- (100) Stanger, V. J. & Warwick, R. S. 1986, MNRAS, 220, 363
- (101) Tamura, T., et al. 2001, A&A, 365, L87
- (102) Tonry, J. L., Dressler, A., Blakeslee, J. P., Ajhar, E. A., Fletcher, A. B., Luppino, G. A., Metzger, M. R., & Moore, C. B. 2001, ApJ, 546, 681
- (103) Trinchieri, G., Kim, D.-W., Fabbiano, G., Canizares, C.R.C. 1994, ApJ, 428, 555
- (104) Trinchieri, G., Sulentic, J., Breitschwerdt, D., & Pietsch, W. 2003, A&A, 401, 173
- (105) Turner, T. J., Perola, G. C., Fiore, F., et al. 2000, ApJ, 531, 245
- (106) Vikhlinin, A., McNamara, B. R., Forman, W., et al. 1998, ApJ, 502, 558
- (107) Vikhlinin, A., McNamara, B. R., Hornstrup, A., Quintana, H., Forman, W., Jones, C., & Way, M. 1999, ApJ, 520, L1
- (108) Vikhlinin, A., Markevitch, M., & Murray, S. S. 2001, ApJ, 551, 160
- (109) Voit, G. M., Balogh, M. L., Bower, R. G., Lacey, C. G., & Bryan, G. L. 2003, ApJ, 593, 272
- (110) Voit, G. M. & Ponman, T. J. 2003, ApJ, 594, L75
- (111) Ward, M. J., Wilson, A. S., Penston, M. V., et al. 1978, ApJ, 223, 788
- (112) Zhang, Y.-Y., Finoguenov, A., Böhringer, H., et al. 2004, A&A, 413, 49