Properties of the Narrow-Line Region in Seyfert Galaxies
Abstract
We study the narrow-line region (NLR) of six Seyfert-1 and six Seyfert-2 galaxies by means of spatially resolved optical spectroscopy and photoionization modelling. From spatially resolved spectral diagnostics, we find a transition between the AGN-excited NLR and the surrounding star-forming regions, allowing us to determine the NLR size independent of stellar contamination. CLOUDY photoionization models show that the observed transition represents a true difference in ionization source and cannot be explained by variations of physical parameters. The electron density and ionization parameter decrease with radius indicating that the NLR is photoionized by the central source only. The velocity field suggests a disky NLR gas distribution.
Institute of Geophysics and Planetary Physics, University of California, Riverside, CA 92521, USA; nicola.bennert@ucr.edu
Astronomical Institute, Academy of Sciences of the Czech Republic, Boční II 1401, 141 31 Prague 4, Czech Republic
Max-Planck Institut für extraterrestrische Physik, Giessenbachstrasse 1, D-85748 Garching, Germany
Astronomisches Institut Ruhr-Universität Bochum, Universitätsstrasse 150, D-44708 Bochum, Germany
The Narrow-Line Region in Active Galaxies
The narrow-line region (NLR) in active galactic nuclei (AGNs) is ideally suited to study the central region through its various emission lines. It has the great advantage over the broad-line region (BLR) to be spatially resolvable, at least for nearby AGNs. Since the NLR is affected by various parameters such as the energy input from the central engine, the existence of a nuclear torus, radio jets, and star formation, it accesses a number of key questions of AGN physics.
[O iii] 5007 Å (hereafter [O iii]) narrow-band imaging is commonly used to study the NLRs of active galaxies, especially Seyferts (e.g. Mulchaey et al. 1996a, Falcke et al. 1998). For QSOs, this method was first applied by Bennert et al. (2002) using an HST emission-line imaging survey of seven radio-quiet PG QSOs with z0.5. Including seven Seyferts, they discovered a relation between NLR size and [O iii] luminosity. This newly found NLR size-luminosity relation connects the NLR of QSOs and Seyferts over three orders of magnitude. This relation seems to continue the relation found between BLR size and luminosity [e.g. Kaspi et al. (2000)], indicating that both BLR and NLR size are only determined by the AGN luminosity. Indeed both sizes are related, providing the potential to estimate black hole (BH) masses from the NLR size (Bennert et al. 2004, 2005). Still, the question remains whether the NLR size-luminosity relation holds at high luminosity or whether these objects lose their very large, dynamically unbound NLR (Netzer et al. 2004).
However, the slope of the NLR size-luminosity relation has been controversial. While Bennert et al. (2002) obtained a slope of 0.5 suggesting a self-regulating mechanism that determines the size to scale with the ionization parameter, Schmitt et al. (2003) report a slope of 0.33 for their sample of 60 Seyfert galaxies imaged with HST. Such a slope is expected for a homogeneous gaseous sphere ionized by a central source (Strömgren sphere). When comparing the two samples and calculating a fit to all type-1 and type-2 AGNs separately, the relation for type-2 AGNs is close to 0.33, while type-1 objects are fit with a slope of 0.55 (Bennert et al. 2005, 2006c). This result explains the different slopes found by the two groups: In the sample of Bennert et al. (2002), type-1 QSOs determine the slope whereas the slope of the sample studied by Schmitt et al. (2003) is dominated by Sy2s. The difference can be explained by the observers viewing angle in the framework of the unified model and a receding torus (Bennert et al. 2005, 2006c).
One problem that remains when studying the NLR by [O iii] imaging alone is that this emission can be contaminated by contributions from e.g. star formation or shock-ionized gas, altering the NLR size. In addition, the measured size depends on the depth of the images: When comparing ground-based [O iii] images of Seyfert galaxies from Mulchaey et al. (1996) with the HST snapshot survey of Schmitt et al. (2003), the latter reveal, on average, six times smaller NLR sizes, probably due to the 15 to 20 times lower sensitivity. These considerations question the determination of the “NLR size” from [O iii] imaging alone.
Answers from Spatially Resolved Spectral Diagnostics
Spatially resolved spectroscopy is a valuable alternative approach as it can directly probe the size in terms of AGN photoionization and discriminate the stellar or shock-ionized contribution by making use of selected emission-line ratios. In addition, several physical parameters of the NLR such as ionization parameter, electron density, and velocity can be directly accessed and analysed as a function of distance from the nucleus.
Therefore, we studied the NLR of six Sy1 and six Sy2 galaxies by means of optical longslit spectroscopy with VLT/FORS1 and NTT/EMMI. In the following, we summarize these results, focussing on the nearby Seyfert-2 galaxy NGC 1386 which can be considered as prototypical for the whole sample. For a detailed discussion of the sample properties, observations, data reduction and analysis, as well as results, see Bennert et al. (2005, 2006a,b,d).
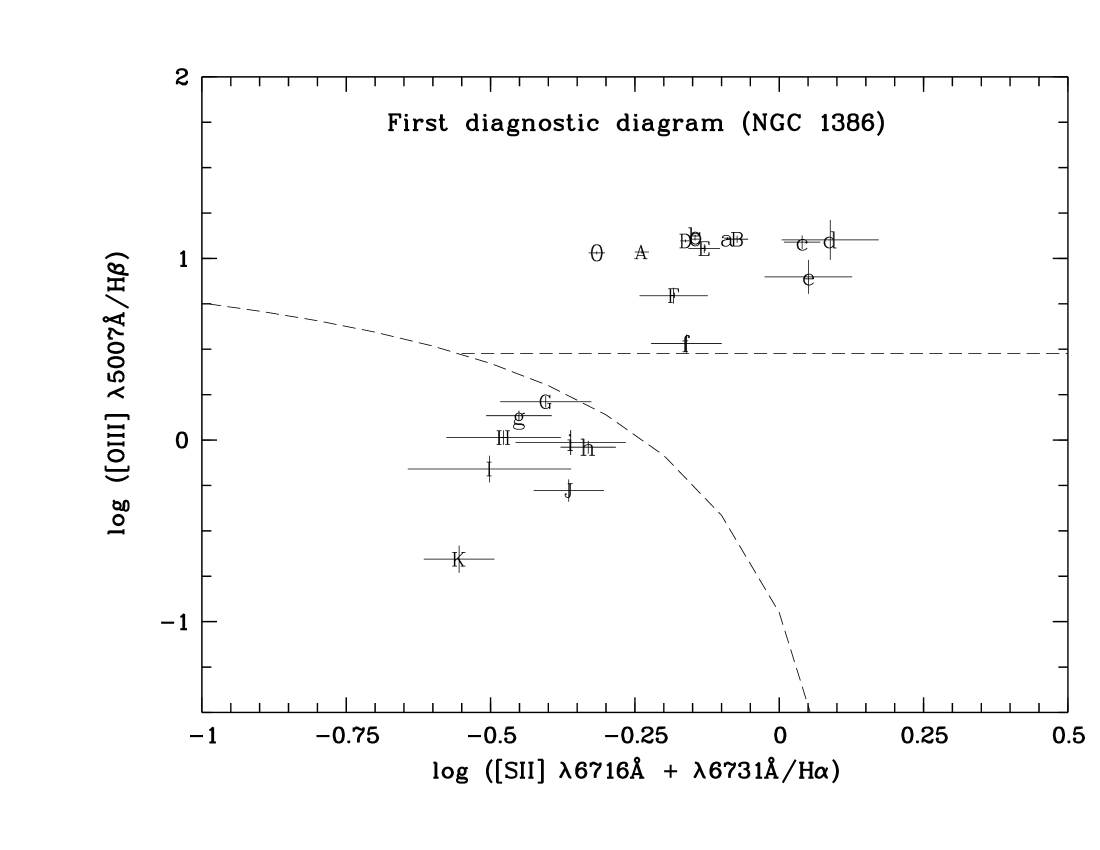
We use the galaxy itself, to subtract the underlying stellar absorption lines, applying reddening corrections for the increasing amount of dust towards the center.
From spatially resolved spectral diagnostics, we find a transition between central line ratios falling into the AGN regime and outer ones in the H ii-region regime for four objects in our sample (two Sy1s, two Sy2s; Fig. 1 (left panel). Applying CLOUDY (Ferland et al. 1998) photoionization models, we show that the observed distinction between H ii-like and AGN-like ratios in NGC 1386 represents a true difference in ionization source and cannot be explained by variations of physical parameters such as ionization parameter, electron density or metallicity (Bennert et al. 2006a). We interpret it as a real border between the NLR, i.e. the central AGN-photoionized region, and surrounding H ii regions. It allows us to determine the NLR size free of stellar contamination, yielding an NLR radius of 6′′. This is twice as large as the one measured from the Schmitt et al. (2003) [O iii] HST image, due to the low sensitivity of their snap-shot survey. On the other hand, it is half the value derived by Fraquelli et al. (2003) from long-slit spectroscopy as their NLR size includes [O iii] emission from surrounding H ii regions.
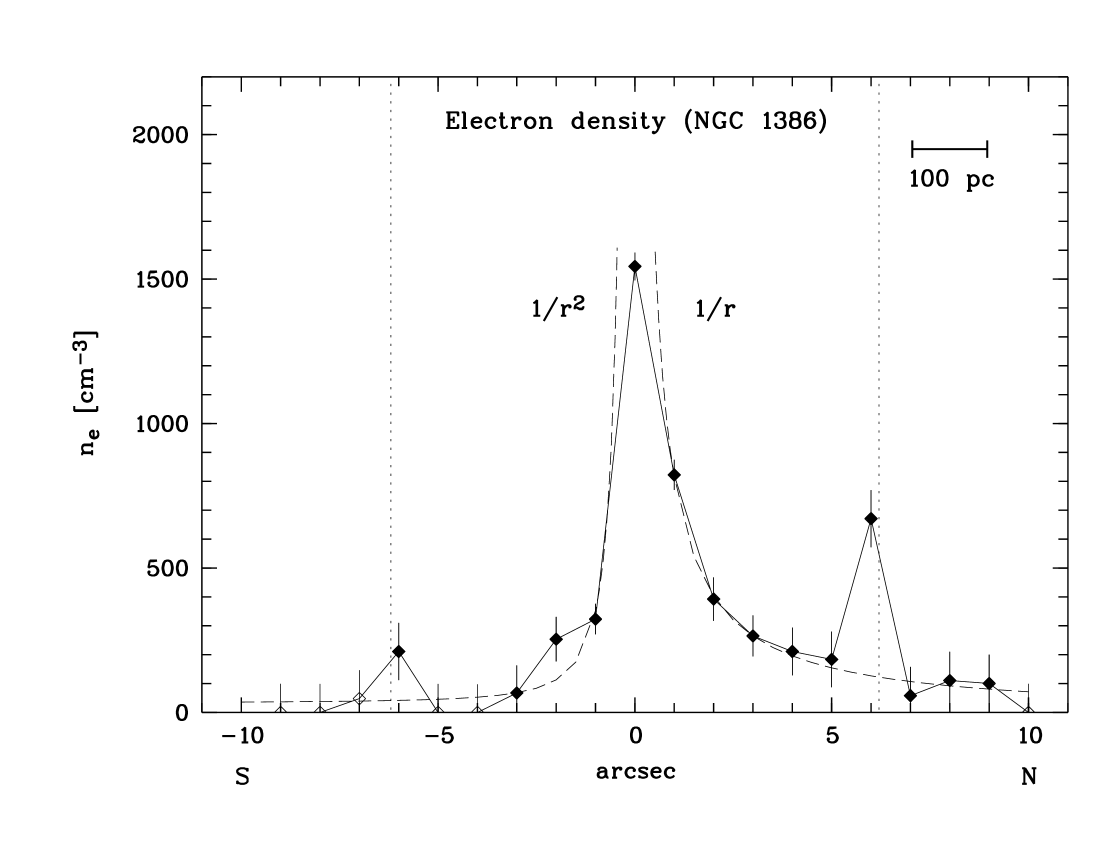
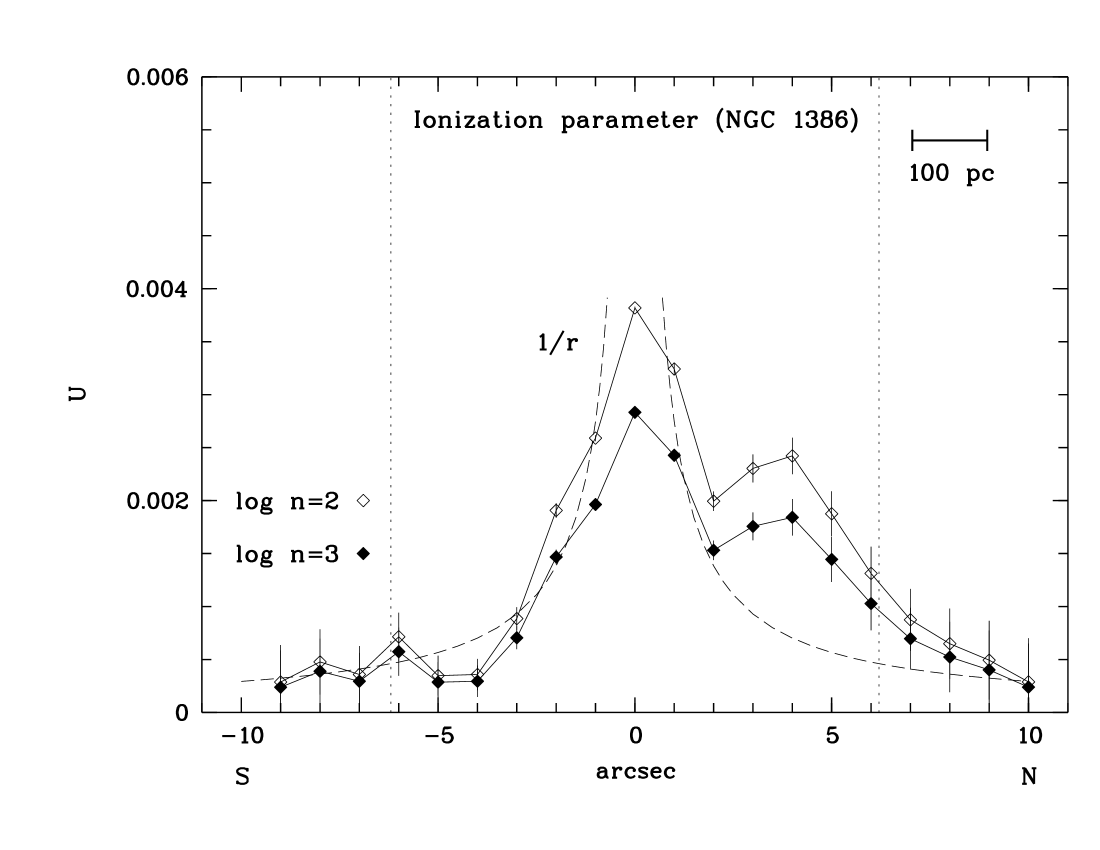
For almost all 12 Seyfert galaxies, we find that both the electron density and the ionization parameter decrease with roughly (Fig. 2). This is in agreement with photoionization of the NLR by a central source, supporting our approach to determine the NLR size via diagnostic diagrams.
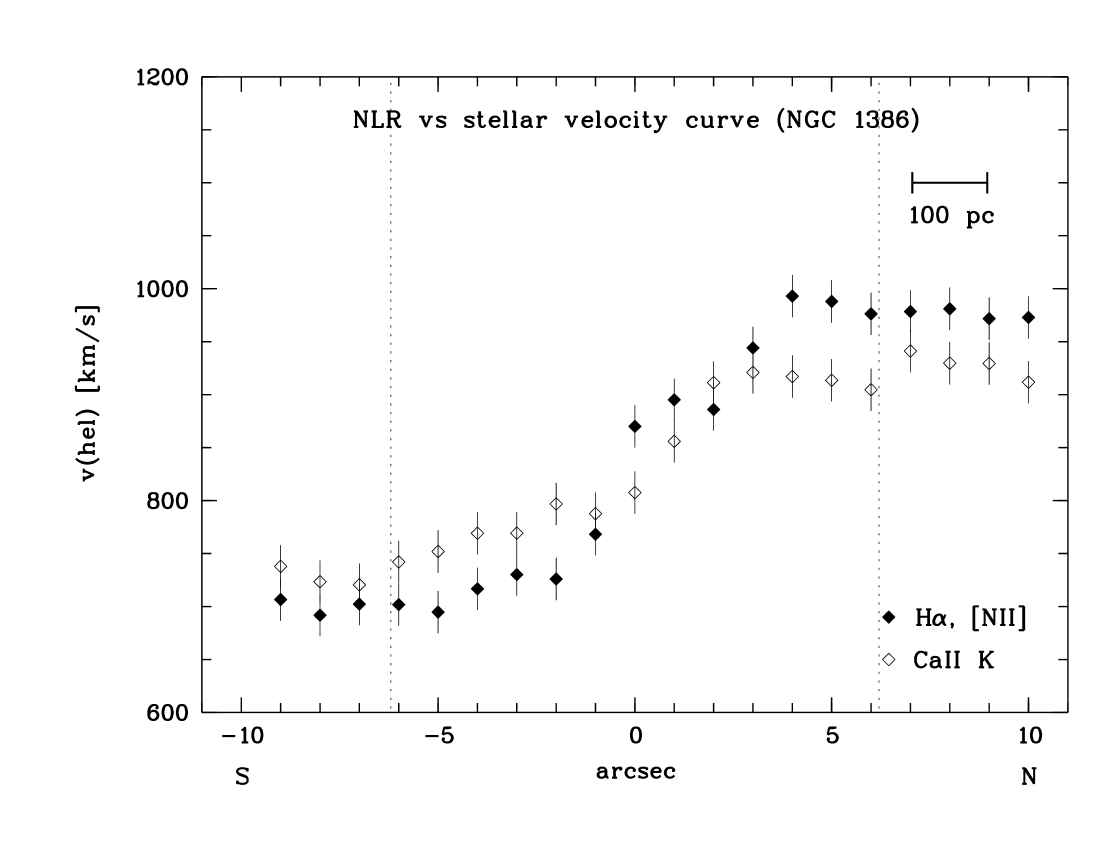
In most objects, the NLR and stellar velocity fields are similar and indicative of rotation (Fig. 1, right panel), implying that the NLR gas is distributed in a disk.
Acknowledgments.
N.B. and S.K. thank the organizers for invitation and hospitality. N.B. acknowledges the support of the American Astronomical Society and the National Science Foundation in the form of an International Travel Grant. B.J. acknowledges the support of the Czech Research Project No. AV0Z10030501. M.H. is supported by “Nordrhein-Westfälische Akademie der Wissenschaften”.
References
- Bennert et al. (2002) Bennert, N., Falcke, H., Schulz, H., et al. 2002, ApJ, 574, L105
- Bennert et al. (2004) Bennert, N., Falcke, H., Shchekinov, Y., Wilson, A. S. 2004, IAUS, 222, 307
- Bennert et al. (2005) Bennert, N. 2005, PhD Thesis, University of Bochum, Germany
- Bennert et al. (2006a) Bennert, N., Jungwiert, B., Komossa, S., Haas, M., Chini, R. 2006a, A&A, 446, 919
- Bennert et al. (2006b) Bennert, N., Jungwiert, B., Komossa, S., Haas, M., Chini, R. 2006b, A&A, 456, 953
- Bennert et al. (2006c) Bennert, N., Jungwiert, B., Komossa, S., Haas, M., Chini, R. 2006c, NewAR, 50, 708
- Bennert et al. (2006d) Bennert, N., Jungwiert, B., Komossa, S., Haas, M., Chini, R. 2006d, A&A, in press
- Falcke et al. (1998) Falcke, H., Wilson, A. S., & Simpson, C. 1998, ApJ, 502, 199
- Ferland et al. (1998) Ferland G. J., Korista K. T., Verner D. A., et al., 1998, PASP, 110, 761
- Fraquelli et al. (2003) Fraquelli, H. A., Storchi-Bergmann, T., & Levenson, N. A. 2003, MNRAS, 341, 449
- Kaspi et al. (2000) Kaspi, S., Smith, P. S., Netzer, H., et al. 2000, ApJ, 533, 631
- Kewley et al. (2001) Kewley, L., Dopita, M., Sutherland, R., et al. 2001, ApJ, 556, 121
- Netzer et al. (2004) Netzer, H., Shemmer, O., Maiolino, R. et al. 2004 ApJ, 614, 558
- Mulchaey et al. (1996) Mulchaey, J. S., Wilson, A. S., & Tsvetanov, Z. I. 1996, ApJS, 102, 309
- Schmitt et al. (2003) Schmitt, H., Donley, J., Antonucci, R., et al. 2003, ApJS, 597, 768