The Mid-infrared Fine-structure Lines of Neon as an Indicator of Star Formation Rate in Galaxies
Abstract
The fine-structure lines of singly ([Ne II] 12.8 m) and doubly ([Ne III] 15.6 m) ionized neon are among the most prominent features in the mid-infrared spectra of star-forming regions, and have the potential to be a powerful new indicator of the star formation rate in galaxies. Using a sample of star-forming galaxies with measurements of the fine-structure lines available from the literature, we show that the sum of the [Ne II] and [Ne III] luminosities obeys a tight, linear correlation with the total infrared luminosity, over 5 orders of magnitude in luminosity. We discuss the formation of the lines and their relation with the Lyman continuum luminosity. A simple calibration between star formation rate and the [Ne II] +[Ne III] luminosity is presented.
1 Introduction
The star formation rate (SFR) is one of the most fundamental parameters in galaxy evolution, but not trivial to measure. Practical methods of estimating the SFR ultimately rely on indirect indicators of the hydrogen Lyman continuum luminosity. From this, one estimates the number of massive, ionizing stars, and for an assumed initial mass function, the total stellar mass. The most commonly used SFR estimators make use of the optical hydrogen recombination lines and [O II] 3727 (see, e.g., Kennicutt 1998 for a review). Depending on the application, a variety of estimators based on continuum emission have been devised and intercalibrated, including X-rays, mid-ultraviolet, far-infrared (IR), and radio synchrotron (e.g., Bell 2003; Gilfanov et al. 2004).
The advent of the Infrared Space Observatory (ISO) and especially the Spitzer Space Telescope has brought renewed interest in mid-IR diagnostics of star formation. Two mid-IR SFR estimators have been discussed: the strength of polycyclic aromatic hydrocarbon (PAH) features (Peeters et al. 2004; Wu et al. 2005) and the mid-IR continuum (Roussel et al. 2001; Wu et al. 2005). These estimators, however, are not without complications. The PAH features are known to be exceptionally weak in low-metallicity galaxies (e.g., Wu et al. 2006, and references therein), their strength being governed by complicated, but poorly understood formation and destruction processes (O’Halloran et al. 2006; Wu et al. 2006). PAH emission arises from a variety of interstellar environments, not only star-forming sites, and thus its ability to reliably trace starburst regions remains a matter of debate (Haas et al. 2002; Peeters et al. 2004). The mid-IR continuum strength, on the other hand, shows considerable variation in its relation to the total IR luminosity for star-forming galaxies (Dale et al. 2005; but see Takeuchi et al. 2005). Moreover, without additional diagnostics it is often difficult to tell whether the primary source of dust heating responsible for the mid-IR emission derives from star formation or active galactic nuclei.
This paper proposes a new SFR indicator based on the strength of the fine-structure transitions of [Ne II] 12.814 m () and [Ne III] 15.554 m (). [Ne II] is an excellent tracer of ionizing stars because (1) its ionization potential (21.56 eV) is higher than that of hydrogen; (2) it is a dominant ionization species in H II regions, being one of the principal coolants (Burbidge et al. 1963; Gould 1963); (3) its relatively high critical density ( cm-3; Petrosian 1970) ensures that the line flux is insensitive to density, since most H II regions have electron densities substantially below ; (4) it is abundant (solar Ne/H = ; Grevesse & Sauval 1998), with a nucleosynthetic history closely following that of oxygen (Garnett 2002); and (5) its long wavelength significantly reduces its sensitivity to dust extinction compared to optical lines (the extinction at mid-IR wavelengths is only a few percent of the extinction at optical wavelengths). Doubly ionized Ne shares these properties, with the difference that [Ne III] can be the dominant ionic species in regions of lower density ( cm-3) and higher excitation (blackbody radiation temperatures K). For example, low-mass, low-metallicity galaxies, which are known to exhibit systematically higher excitation, show a greater fraction of ionized neon emission in the [Ne III] 15.6 m line rather than in the [Ne II] 12.8 m line (O’Halloran et al. 2006; Wu et al. 2006).
We demonstrate, using a sample of star-forming galaxies with mid-IR spectra, that the sum of [Ne II] + [Ne III] luminosity tightly correlates with a well-known measure of star formation, the total IR luminosity. We discuss the ionization of Ne and the connection between the [Ne II] and [Ne III] emission and Lyman continuum luminosity, from which a simple relationship between [Ne II] + [Ne III] luminosity and SFR follows.
2 Data
To explore the utility of the mid-IR fine-structure lines of Ne as a SFR indicator, we have assembled from the literature data for star-forming galaxies with measured [Ne II] and [Ne III] fluxes. We have strived to ensure that the data were obtained with a sufficiently large aperture so that most of the emission is included. Since the [Ne II] line sits adjacent to the prominent 12.7 m PAH feature, it is also important that the spectra have sufficient spectral resolution so that the line can be unambiguously resolved. Lastly, while the resulting compilation is necessarily heterogeneous, we have tried to minimize systematic effects by concentrating only on a few relatively large, uniformly analyzed samples from the literature that were observed with the same instrumental setup. The final sample of 57 sources, summarized in Figure 1, contains 34 galaxies observed with the Short Wavelength Spectrometer (SWS) on ISO (Genzel et al. 1998; Thornley et al. 2000; Verma et al. 2003) and 23 galaxies observed with the Infrared Spectrograph (IRS) on Spitzer (O’Halloran et al. 2006; Wu et al. 2006). Although some of the sources are well-known composite systems that contain both an active galactic nucleus and a starburst (e.g., Arp 220 and NGC 6240), it has been previously established that the bulk of the bolometric luminosity in these sources is dominated by the starburst component. Our diverse sample spans a wide range of galaxy types, from low-mass, low-metallicity dwarf galaxies to massive merger remnants. Among the 57 objects in the sample, 16 are early-type spirals (Sa–Sbc; mag), 7 are late-type spirals (Sc–Sm; mag), 14 are irregulars and blue compact dwarfs (Im, I0, BCD; mag), and 20 are well-known merger or strongly interacting systems with peculiar morphologies ( mag).
Figure 1 illustrates that the [Ne II] emission strongly correlates with the IR emission, over 5 orders of magnitude in luminosity. An ordinary least-squares regression of on yields
| (1) |
with a scatter of 0.51 dex. The correlation appears to steepen toward low luminosities ( ), in that less [Ne II] emission is produced for a given amount of IR luminosity. The lower-luminosity galaxies have a higher ratio of [Ne III] to [Ne II] emission, suggesting that in these galaxies a significant fraction of the Ne is doubly ionized, most likely because in a low-metallicity environment the ionizing radiation field hardens as a result of reduced line blanketing and blocking in stellar atmospheres (e.g., Thornley et al. 2000; Madden et al. 2002). We examine this effect by plotting the sum of [Ne II] and [Ne III] (solid points in Fig. 1), for those objects for which both lines are measured. Indeed, the lower-luminosity points now exhibit significantly less scatter and follow more closely a smooth continuation of the trend defined by the higher-luminosity systems. An ordinary least-squares regression of on yields
| (2) |
and a scatter of 0.49 dex.
The IR luminosity is a robust indicator of the SFR in star-forming galaxies because a significant fraction of the bolometric luminosity of young stars is absorbed and reradiated by dust grains. We expect the IR and Ne luminosities to be related because, as discussed in the next section, the lines of ionized Ne directly trace the Lyman continuum, which is itself produced primarily by young stars. The tight correlation between the luminosity of ionized Ne and the IR luminosity indicates that the luminosity of the Ne fine-structure lines can be used as an effective substitute to estimate the SFR. The theoretical basis for this expectation is examined in the next section.
3 The Relation between the Neon Lines and SFR
3.1 The Ionization of Ne
The relative abundances of the ionic species are set by a balance of the rates of photoionization and recombination for each species :
| (3) |
The photoionization rate is the integral over a frequency-dependent absorption cross section and the ionizing radiation above the ionization threshold :
| (4) |
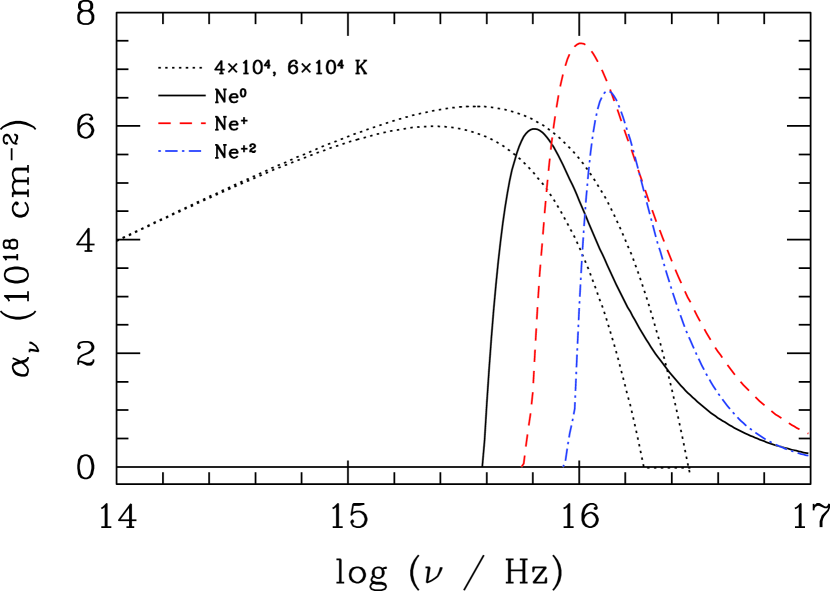
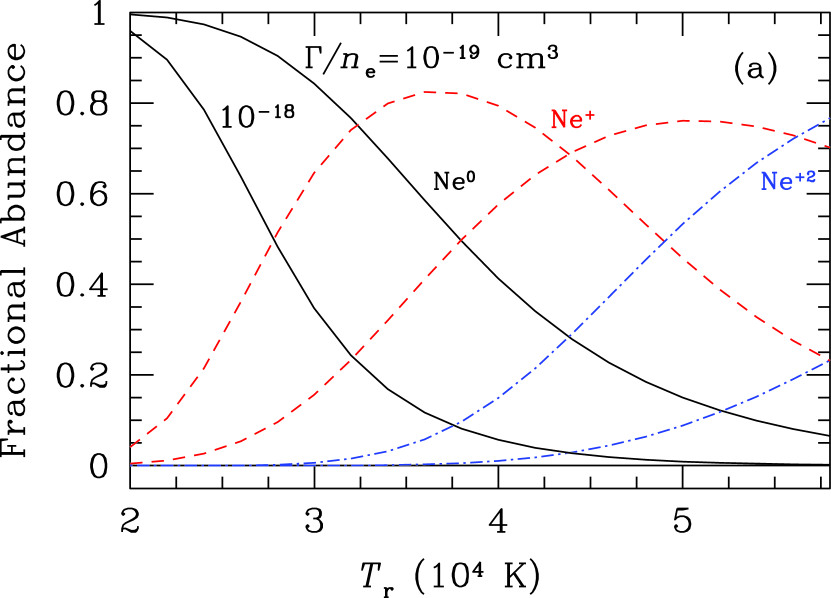
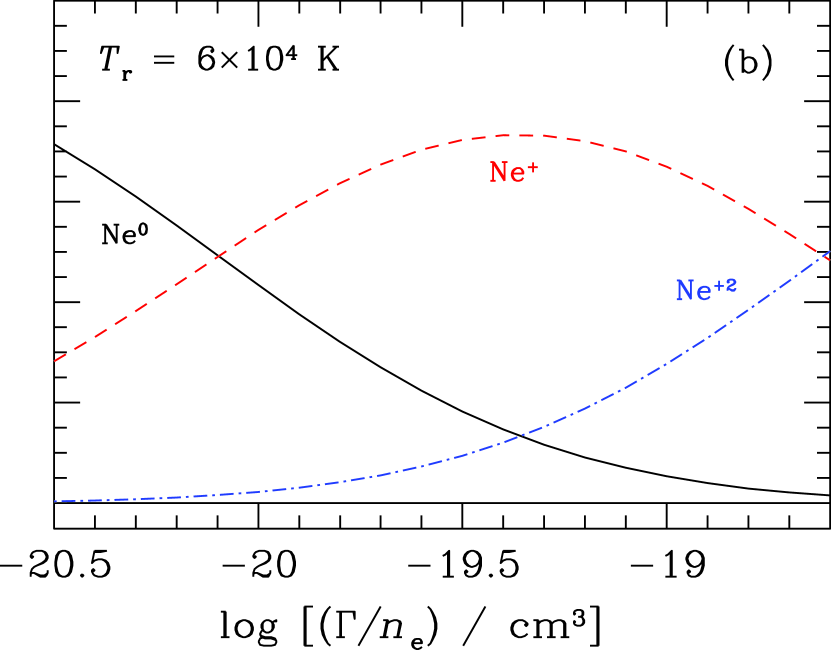
In the case of Ne, Figure 2 shows that the absorption cross section of Ne+ peaks at a frequency corresponding to a Wien temperature of K, which is higher than the characteristic radiation temperature of early-type stars ( K). Thus, in a region ionized by typical massive stars the dominant ionic species would be Ne+. However, as shown in Figure 3, [Ne III] will begin to replace [Ne II] in ionized gas that is at lower density or subject to intense or high-temperature radiation. The ionization equilibrium shown in Figure 3 is calculated in the absence of a specific model by expressing the mean radiation as diluted blackbody radiation,
| (5) |
where is analogous to the geometrical dilution in a spherical model. In Equation 3, the dilution factor may then be combined as a ratio, , with the density, which is also unspecified in the absence of a specific model. Figure 3 illustrates how the use of the combination of [Ne II] + [Ne III] improves the robustness of Ne as an indicator of the SFR, by extending its applicability to galaxies with higher , for example, to lower-luminosity, lower-metallicity galaxies that have higher excitation (e.g., Thornley et al. 2000; Madden et al. 2006).
3.2 The Line Intensity
The general expression for the intensity of a spectral line is,
| (6) |
where is the Einstein coefficient for spontaneous emission, is the number density of ions in the upper state, and the integral is over pathlength . The population of the upper state is in general found from the equilibrium set by the rate equations for collisional and radiative transitions between all levels of a species. The radiative rates are considerably faster than the collisional rates at electron densities below the critical density for collisional de-excitation, cm-3, for both the [Ne II] and [Ne III] fine-structure transitions. Therefore, for lower densities, it is possible to approximate the rate of emission, , by the upward collisional rate alone. In the case of the [Ne II] doublet, the line intensity is then approximately
| (7) |
where is the interstellar abundance of neon relative to hydrogen (; Simpson et al. 1998), is the fraction of Ne that is singly ionized (Fig. 3), and is the upward collisional rate (s-1) between the and the levels, and is the emission measure.
In the case of the [Ne III] triplet, one needs to consider the upward transitions to both higher states because a collisional transition to the uppermost level will result in a radiative transition to the intermediate level, followed immediately by a transition at 15.6 m to the ground state . The rate of the electric quadrupole transition is negligible compared to the rates of the two magnetic dipole transitions . Thus, the intensity of [Ne III] is approximately
| (8) |
where the subscripts 1, 2, and 3 on the collision rates refer to the levels , , and , respectively, in order of increasing energy.
The collision rates are related to the collision strengths , assuming a thermal velocity for the electrons,
| (9) |
where is the statistical weight of the lower level. For the [Ne II] 12.8 m line, (Griffin et al. 2001). For the [Ne III] 15.6 m line, and (Butler & Zeippen 1994).
Integrating over the source area and assuming K, the sum of the luminosities of the two lines can be expressed as
| (10) |
The Ne luminosity can be easily related to the Lyman continuum luminosity by recognizing that, in equilibrium, the ionizing rate of hydrogen is equal to the recombination rate:
| (11) |
where is the Case B recombination rate and is the volume of the emitting region. Combining Equations 10 and 11,
| (12) |
Here, is the number fraction of ionizing photons that are actually absorbed by the gas (as opposed to being absorbed by dust or freely escaped from the nebula). Hirashita et al. (2003) estimate that in starburst galaxies.
To check the validity of Equation 12, we present in Figure 4 a compilation of [Ne II], [Ne III], and Br measurements for a large collection of H II regions observed with the ISO SWS. The data for the H II regions in the Galaxy and the Small and Large Magellanic Clouds come from Giveon et al. (2002), while the M33 sources come from Willner & Nelson-Patel (2002)111Giveon et al. (2002) also give data for some M33 H II regions, but the data set of Willner & Nelson-Patel (2002) is more extensive.. Three points deserve notice. First, for the Galactic sources both [Ne II] and the sum of [Ne II] + [Ne III] trace Br linearly. Second, for the extragalactic sources, all of which have subsolar abundances (especially the Small Magellanic Cloud), [Ne II] systematically deviates from a linear correlation with Br whereas the sum of [Ne II] + [Ne III] remains linear. Finally, the relation given in Equation 12, with (which is a reasonable estimate from the peak of the curves shown in Fig. 3) and , extremely well describes the [Ne II] data for the Galactic sources. The same relation, with a small adjustment in zeropoint to account for the ionization fraction, very well matches the sum of [Ne II] + [Ne III] for all the sources; the scatter around the linear relation is only dex, which is expected simply from the metallicity variation among the four galaxies and within each galaxy (e.g., Willner & Nelson-Patel 2002).
Given the relation between the [Ne II] + [Ne III] luminosity and the ionizing photon rate, it is straightforward to translate into a SFR, using one of the many existing calibrations between SFR and . Adopting the calibration of Kennicutt (1998), which assumes solar abundances and a Salpeter (1955) initial mass function with a lower mass limit of 0.1 and an upper mass limit of 100 , and choosing a fiducial value of ,
| (13) |
4 Discussion and Summary
We have investigated the utility of the mid-IR fine-structure lines of Ne as a SFR indicator. Being dominant coolants in H II regions, the [Ne II] and [Ne III] lines are among the most prominent and easy-to-measure features in the mid-IR spectra of virtually all extragalactic sources, especially with the advent of Spitzer. Unlike commonly used SFR indicators such as the synchrotron radio continuum or even the IR luminosity, which relate to massive stars in a complex manner, the formation of the [Ne II] and [Ne III] lines is particularly simple. Their intensity scales with the emission measure of an ionized nebula, and hence directly with the Lyman continuum luminosity. This property makes them an extremely attractive tool to estimate the SFR in extragalactic systems. The obvious advantage of [Ne II] and [Ne III] over optical lines such as H and [O II] is their greatly reduced sensitivity to dust extinction.
Using a sample of star-forming galaxies with available mid-IR spectra from the literature, we show that the [Ne II] luminosity correlates linearly with the total IR luminosity, over 5 orders of magnitude in luminosity and ranging from low-metallicity dwarf galaxies to high-metallicity, ultraluminous IR galaxies. The observed scatter in this correlation is only dex, which is remarkably tight, considering several likely sources of variation. First, the neon abundances span at least a factor of 5 (e.g., Verma et al. 2003). Second, aperture effects must contribute to at least part of the scatter. Both the SWS aperture and the effective aperture of the IRS (either in mapping or staring mode) are significantly smaller than the IRAS beam. Although one usually expects the IR emission to be centrally peaked in starburst systems, given the diversity of our sample it is quite likely that the IR emission arises from a larger area than is sampled by the [Ne II] measurements. The data set from Thornley et al. (2000) attempted to correct the IR emission for aperture effects, but in general this was not available for the other data sets. To estimate the likely impact of aperture effects, we sorted the sample by optical angular diameter, but find no obvious dependence of angular size scatter with scatter around the correlation. Third, the fractional ionization of Ne is variable. However, inclusion of both the [Ne II] and [Ne III] luminosities improves the empirical correlation in that the scatter and turnover of the correlation at the low-luminosity end decrease with the combined luminosities. Lastly, while the extinction at mid-IR wavelengths is much less than in the optical, in some cases it can still be non-negligible (e.g., Genzel et al. 1998).
A quantitative explanation of the vs. correlation is nontrivial, since the IR emission arises not only from dust grain heating by massive stars but also by nonionizing stars, both young and old (e.g., Hirashita et al. 2003). However, to a first approximation this correlation indicates that, to the extent that the IR luminosity traces the SFR (e.g., Kennicutt 1998; Bell 2003; Hirashita et al. 2003), so, too, does the [Ne II] + [Ne III] luminosity, as expected from the basic theoretical considerations discussed in § 3.
To our knowledge, this is the first systematic analysis of the [Ne II] and [Ne III] lines for a large sample of star-forming galaxies with the expressed intent of using them to derive SFRs. In their ISO survey of ultraluminous IR galaxies, Genzel et al. (1998) had explicitly recognized that the [Ne II] luminosity can be used as a surrogate for the Lyman continuum luminosity. From a subset of 12 starburst galaxies, they empirically determined that the average ratio of Lyman continuum luminosity to [Ne II] luminosity is 64. This value is smaller than that deduced from our calculations in §3: according to the starburst synthesis models presented in Hirashita et al. (2003), the average Lyman continuum photon has an energy of eV, and if , , and , then Equation 12 implies . In a recent Spitzer IRS study of low-redshift quasars and starburst-dominated ultraluminous IR galaxies, Schweitzer et al. (2006) presented a correlation between [Ne II] luminosity and 60 m luminosity, showing that the two quantities are significantly correlated. Although Schweitzer et al. argue that the [Ne II] emission in their sample largely originates from star-forming regions rather than the accretion-powered narrow-line region, this is difficult to prove in the absence of a detailed analysis of the narrow-line spectra of their sample. In any event, our analysis spans a larger dynamic range in luminosity and galaxy environment, and it conclusively demonstrates that in star-forming galaxies the combined [Ne II] + [Ne III] luminosity tracks the IR emission.
We propose that the relationship between the [Ne II] + [Ne III] luminosity and the SFR (Eq. 13) be added to the arsenal of SFR indicators presently used in the literature. If possible, the [Ne II] and [Ne III] luminosities employed in Equation 13 should be corrected for extinction. We note, however, that our calibration itself, which is derived from theoretical considerations, does not depend on extinction correction. Our calibration is based on (1) the relation between the luminosity of the neon lines and the ionizing photon rate (Eq. 12) derived in this paper and (2) a previously determined and widely accepted conversion between the ionizing photon rate and the SFR (Kennicutt 1998). While the neon-based SFR calibration explicitly depends on the fractional abundance of singly and doubly ionized Ne (as expressed by the factors and in Eq. 13), which can only be ascertained from detailed modeling of individual sources, if most of the Ne is ionized, the distribution between the [Ne II] and [Ne III] states introduces a variation in the calibration of less than a factor of 2.
As an independent check of the reliability of our new method, we have compared the SFR obtained from the [Ne II] + [Ne III] luminosity with the SFR derived more traditionally from the IR luminosity for the sample of 57 galaxies plotted in Figure 1. Using the IR calibration given in Kennicutt (1998), the ratio of the IR-based SFRs to the Ne-based SFRs has an average value of and a median value of 0.7. Within the significant scatter, there is no evidence for a large systematic bias in the Ne-based method.
References
- (1) Bell, E. F. 2003, ApJ, 586, 794
- (2) Burbidge, G., Gould, R. J., & Pottasch, S. R. 1963, ApJ, 138, 945
- (3) Butler, K., & Zeippen, C. J. 1994, A&AS, 108, 1
- (4) Dale, D. A., et al. 2005, ApJ, 633, 857
- (5) Garnett, D. R. 2002, Rev. Mexicana Astron. Astrofis., 12, 183
- (6) Genzel, R., et al. 1998, ApJ, 498, 579
- (7) Gilfanov, M., Grimm, H.-J., & Sunyaev, R. 2004, MNRAS, 347, L57
- (8) Giveon, U., Sternberg, A., Lutz, D., Feuchtgruber, H., & Pauldrach, A. 2002, ApJ, 566, 880
- (9) Gould, R. J. 1963, ApJ, 138, 1308
- (10) ——. 1978, ApJ, 219, 250
- (11) Grevesse, N., & Sauval, A. J. 1998, Space Sci. Rev., 85, 161
- (12) Griffin, D. C., Mitnik, D. M., & Badnell, N. R. 2001, J. Phys. B, At. Mol. Opt. Phys., 34, 4401
- (13) Haas, M., Klaas, U., & Bianchi, S. 2002, A&A, 385, L23
- (14) Hirashita, H., Buat, V., & Inoue, A. K. 2003, A&A, 410, 83
- (15) Kennicutt, R. C. 1998, ARA&A, 36, 189
- (16) Madden, S. C., Galliano, F., Jones, A. P., & Sauvage, M. 2006, A&A, 446, 877
- (17) Nussbaumer, H., & Storey, P. J. 1987, A&AS, 69, 123
- (18) O’Halloran, B., Satyapal, S., & Dudik, R. P. 2006, ApJ, 641, 795
- (19) Osterbrock, D. E. 1989, Astrophysics of Gaseous Nebulae and Active Galactic Nuclei (Mill Valley: Univ. Science Books)
- (20) Peeters, E., Spoon, H. W. W., & Tielens, A. G. G. M. 2004, ApJ, 613, 986
- (21) Petrosian, V. 1970, ApJ, 159, 833
- (22) Roussel, H., Sauvage, M., Vigroux, L., & Bosma, A. 2001, A&A, 372, 427
- (23) Salpeter, E. E. 1955, ApJ, 121, 161
- (24) Sanders, D. B., & Mirabel, I. F. 1996, ARA&A, 34, 749
- (25) Schweitzer, M., et al. 2006, ApJ, 649, 79
- (26) Simpson, J. P., Witteborn, F. C., Price, S. D., & Cohen, M. 1998, ApJ, 508, 268
- (27) Takeuchi, T. T., Buat, V., Iglesias-Paramo, J., Boselli, A., & Burgarella, D. 2005, A&A, 432, 423
- (28) Thornley, M. D., Schreiber, N. M. F., Lutz, D., Genzel, R., Spoon, H. W. W., Kunze, D., & Sternberg, A. 2000, ApJ, 539, 641
- (29) Verma, A., Lutz, D., Sturm, E., Sternberg, A., Genzel, R., & Vacca, W. 2003, A&A, 403, 829
- (30) Willner, S. P., & Nelson-Patel, K. 2002, ApJ, 568, 679
- (31) Wu, H., Cao, C., Hao, C. N., Liu, F. S., Wang, J. L., Xia, X. Y., Deng, Z. G., & Young, C. K. S. 2005, ApJ, 632, L79
- (32) Wu, Y., Charmandaris, V., Hao, L., Brandl, B. R., Bernard-Salas, J., Spoon, H. W. W., & Houck, J. R. 2006, ApJ, 639, 157