Long Term Cooling of Magnetar Crusts
Abstract
X-ray emission following giant flares of magnetars can be categorized into three categories of time scales (a) short term afterglow (b) medium term afterglow and (c) long term afterglow. Short term afterglow, which declines over several hours, seems to correspond to gravitational resettling of uplifted material. Medium term afterglow, which declines over several weeks or months, appears to be the cooling of the heated outer crust, and long term afterglow, which declines over a period of many years, can be understood to be the cooling of the inner crust. The long term afterglow profile may be a very sensitive indicator of neutron star mass.
1 Introduction
The cooling of neutron stars is a very old subject; it dates back almost to the discovery of neutron stars. Most of the cooling theory has been directed at long term cooling following the supernova that produces the neutron star. Recent reviews on the subject include Yakovlev and Pethick (2004). Eichler and Cheng (1989) proposed that sufficiently energetic episodic energy releases ( ergs) in the crust might be able to heat it enough to generate detectable transient X-ray emission from the crust after such events as the crust cools. For many years it appeared unlikely that episodic releases of ergs or more could be arranged in the crusts of neutron stars. The March 5, 1979 event was an outstanding exception, but at the time it was one of a kind and mysterious. Now, however, following the spin down measurements of Kouveliotou et al. (1998, 1999) and the August 27, 1998 giant flare from SGR 1900+14, it is generally accepted that magnetars (Duncan and Thompson 1992, Thompson and Duncan, 1995, 1996), whose magnetic fields contains to ergs, are able to release sufficiently large amounts from their reserves of magnetic energy to account for the giant flares. Indeed the three recorded such events - the giant flares of March 5, 1979, August 27, 1998, and December 27, 2004 - all seem to be similar and to be associated with large magnetic reconnection powerful enough to move and heat the crust of the magnetar.
The details of the giant flares are not the subject of this paper. Rather, the intent is to sketch how the X-ray afterglow seen from the magnetars in the wake of these giant flares may teach us something about the makeup of the magnetar crust. In particular, it is significant that we can explain these x-ray light curves in terms of normal neutron star material, where ”normal” takes into account the fact that the magnetic field is exceedingly large. Checking the theory of normal matter in superstrong magnetic fields (e.g. by Yakovlev and coworkers, see Potekhin 1999; Yakovlev, Levenfish & Shibanov 1999, Yakovlev et al 2001) against observations sets a background against which abnormal neutron stars, such as those containing strange matter, could be so identified.
Observations of outer crust cooling following intense heating may also provide a rare opportunity to observe the effects, via the data, of nuclear processes associated with strongly heated heavy nuclei (SHHN) that are not observable in other situations, e.g. reversible nuclear dissociation of, radioactivity of, pycnonuclear activity in, and enhancement of neutrino cooling processes by SHHN.
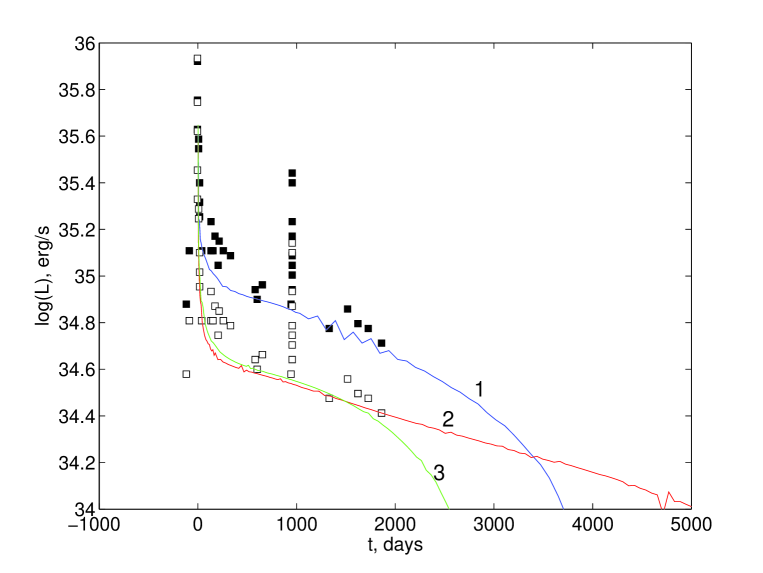
Several cautionary remarks should be issued from the start: First, there is little doubt that magnetospheric activity can cause short term enhancement of the X-ray emission. The April 2001 flare in SGR 1900+14 was a clear example of this. It produced a large, short spike in the X-ray emission that stands out clearly in the light curve (see Figure 3). Thus, we do not attempt to fit the irregular bumps that appear on top of the overall long term declining X-ray light curve.
Similarly, it is extremely likely that magnetospheric activity can cause long term X-ray emission. The high persistent luminosity from SGR 0526-66, (Rothschild, Kulkarni and Lingenfelter, 1994, Kulkarni et al. 2003), about erg/s, is too large to be thermal emission from the surface 20 years after a heating event, unless there is a huge amplification in the magnetosphere. Some sort of energy release must be continuous, and dissipation of magnetospheric currents seems the most likely. It could, in fact, be argued that magnetospheric emission is responsible for all long term X-ray emission from magnetars, including the component that declines over several years. The high pulsed fraction observed in the X-ray emission of many AXP’s certainly suggests that the pulsed emission comes from a heated polar cap, and the amount is certainly comparable to what is theoretically expected from current dissipation in the twisted magenetic loops of the magnetospheres. We have no way of disproving this alternative hypothesis at present. However, we now have two cases - SGR 1627-41 after a period of high activity in 1998 and SGR 1900+14 after the giant flare of Aug 27, 1998 - for which a curious pattern in the X-ray light curve was observed over several years: a decline, followed by a plateau, followed, with relative suddenness, by a steeper decline, and finally a leveling out well below the level of the plateau. It is not clear why , the sudden change in the rate of decline of luminosity L, would be so high in a magnetospheric current dissipation model for the X-ray decline. In the crustal cooling model we have proposed (Kouveliotou et al 2003), there is a natural explanation for the plateaus in terms of the heat storing capacity of the inner crust.
Because magnetars are observed only occasionally, we do not have detailed histories of the long term decline in the X-ray emission following intense activity. The inferred monotonic decrease in this emission over the several years following an active period is generally based on only five or six points so far, and there is always a small probability that the observed ”pattern” is a matter of chance. This could be remedied with more frequent observations.
Finally, the non-thermal spectra typical of the persistent X-ray emission from SGR’s suggest that the magnetosphere at least plays some role, possibly cyclotron upscattering of thermal seed photons (Thompson, Lyutikov and Kulkarni 2002). The decline would then be attributed to that of the seed photons in the crustal cooling model, rather than to a decline in the extent of cyclotron upscattering. The latter would predict softening of the spectrum as the luminosity declined and this can be tested. There is an alternative possibility that the non-thermal emission is from a tenuous atmosphere heated by coronal currents (Thompson and Beloborodov 2005; Beloborodov and Thompson 2006). This emission is totally decoupled from the crustal cooling because, near the surface of the neutron star, the cyclotron energy is too high.
Short term afterglow arises when energy released in the outer g/cm2 of the crust lifts these layers above the surface (Eichler and Cheng 1989, Eichler et al 2003). The uplifted material settles in the strong gravitational field of the magnetar, as the pairs whose pressure supports it against gravity annihilate and release the heat, over the course of several hours, through the top of the raised material layer. It is not hard to show that in this case the luminosity decreases approximately as with a slight steepening near the end of the burst (Eichler et al 2003). This is in extremely good agreement (ibid) with observation of short term afterglow from SGR 1900+14 ( Ibrahim et al 2001) after an SGR event on August 29, 1998 (shortly after the giant flare). Because the fit is so sensitive to opacity (and hence to the surface field) the data provide a rather sensitive if indirect measurement of the surface magnetic field. The best fit to the August 29, 1998 event (Eichler et al 2003) is with a surface field of G, in excellent agreement with the spindown estimate (Kouveliotou et al. 1998).
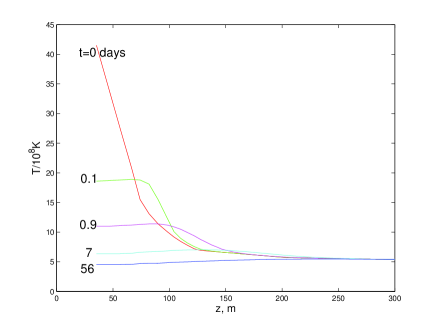
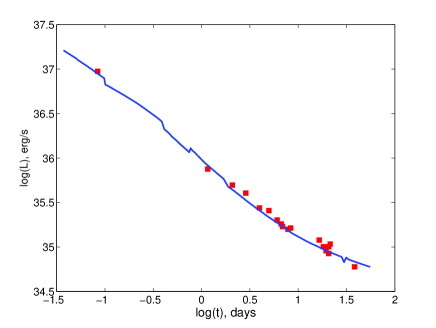
In the medium term afterglow that was observed following the August 27, 1998 flare in SGR 1900+14, the X-ray emission declined as a power law over 40 days following the giant flare. Beyond that point, the decaying X-ray tail merged with (what was then considered) the persistent X-ray emission of that magnetar (Woods et al 2001). This 40 day afterglow was explained as the cooling of the outer crust under the assumption that the energy released per unit volume below the surface was comparable to that above the surface (Lyubarsky, Eichler & Thompson 2002). A fit is shown in Figure 1 for a neutron star mass of 1.5 solar masses.
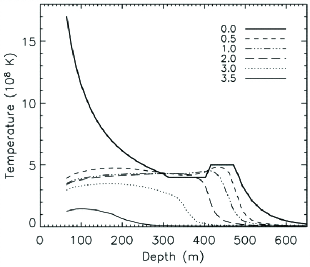
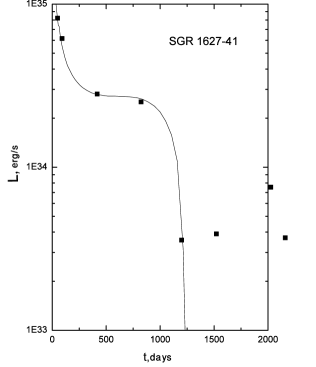
Long term afterglow was observed following a very active period of bursting activity from the magnetar SGR 1627-41. Here the X-ray luminosity declined gradually for about one year; it then plateaued for the second year and dropped off very sharply during the third year. It has since leveled out into what we believe is probably pulsed emission from a polar cap that was heated by the persistent current. Kouveliotou et al. (2003) explained this curious time profile in the cooling curve as being due to the cooling of the inner crust of the magnetar. The plateau phase during days 400-800 of this light curve can be explained as being due to the huge heat storing capacity of the inner crust which keeps the outer crust at a more or less constant temperature profile until this reservoir of heat is used up. Once the heat is used up, the surface cools very rapidly as observed. A good fit to the data was obtained under the assumption that the inner crust was heated to hundreds of millions of degrees but that the core remained cool. In order for the inner crust to cool within a year or so, the surface gravity of the neutron star must be quite high, at least 1.5 solar masses, and this implies that the core is cooled by the direct URCA process (Gnedin et al. 2001). Thus the assumption of a cool core is justified once the assumption of a massive neutron star is made. Most of the heat in the inner crust is conducted down into the core and the duration of the plateau in the surface emission lasts only as long as the heat in the inner crust remains. The fit from Kouveliotou et al (2003) is reproduced and the data updated in Figure 2. The final leveling out is attributed to magnetospheric current dissipation taking over the main role of surface heating after the crust below has cooled sufficiently. It is conjectured that during the decline of the X-ray emission after a major heating event in 1998, SGR 1627-41 has become more like an AXP.
The X-ray emission from SGR 1900+14 beyond the first 40 days after the August 1998 flare at first appeared to be the persistent x-ray emission generated by heat stored in the core of a young neutron star. However, eight years after this event it now appears that this emission is actually in slow decline. It has declined by a factor of two in the past eight years. Nevertheless we have been able to fit this decline with cooling of the inner crust of SGR 1900+14 if we assume a high mass, . The medium term afterglow must now be fit with the same large mass, which is more than originally assumed in the original paper (Lyubarsky, Eichler and Thompson (2002), and in Figure 1 we have replotted this fit for the higher mass.
Note that the cooling time profile is extremely sensitive not only to neutron star mass via surface gravity and crust thickness, but also sensitive to the assumed inner core temperature. This is due in part to the non-linearities in the heat conduction. Cool material at these densities conducts heat much more effectively. An abrupt end to a plateau in the cooling curve can happen only if the core is cool, and this probably requires core cooling by the direct URCA process. Data points beyond those shown here, to appear soon (Wilson et al, in preparation), should be able to discriminate between the various theoretical curves plotted in Figure 3.
In conclusion, the long term X-ray emission of the soft gamma repeaters SGR 1627-41 and SGR 1900+14 following intense heating episodes, which declines over a timescale of several years, can be modeled as cooling of their inner crusts under the assumption that they are made of otherwise normal material and that their masses are at least . It might be supposed that any observed light curve could be fit by picking the initial temperature distribution (ITD) that reproduces it. However, it turns out that there does not seem to be any ITD in the crust that explains these light curves unless the mass is chosen to be large and the core to be cool. If the core were hot - as would be expected if the direct URCA process were suppressed - we find no ITD that can fit the data without implausibly fine tuning. It thus seems that observations of these long term cooling curves may provide a good way to narrowly constrain the masses of neutron stars that undergo large transient heating events.
Because the cooling time of the inner crust is such a sensitive function of the ”margin of safety” - i.e. the difference between the magnetar mass and the maximum mass - it is in principle possible to obtain some information about the clustering of neutron stars near their maximum masses and perhaps even the fraction of them that become black holes. It would be interesting to compare the distribution obtained in this way to that of binary neutron star masses.
The authors gratefully acknowledge support from the Israel-US Binational Science Foundation, the Israel Science Foundation, the German-Israel Foundation, the Arnow Chair of Theoretical Astrophysics, and the Israeli Ministry of Absorption.
References
- (1) Beloborodov, A. M. & Thompson, C. 2006, astro-ph/02417
- Duncan & Thompson (1992) Duncan, R.C. & Thompson, C. 1992, ApJ, 392, L9
- Eichler & Cheng (1989) Eichler, D. & Cheng, A.F. 1989, ApJ, 336, 360
- (4) Eichler, D.; Lyubarsky, Y.; Thompson, C.; Woods, P. M. 2003. In: Pulsars, AXPs and SGRs observed with BeppoSAX and Other Observatories, Proc. International Workshop held in Marsala, September 23-25, 2002. Eds. G. Cusumano, E. Massaro, T. Mineo. Roma, Italy: Aracne Editrice, July, 2003, p. 215; astro-ph/0303296
- (5) Gnedin, O.Y.; Yakovlev, D.G.; Potekhin, A.Y. 2001, MNRAS 324, 725
- (6) Ibrahim, A.I. et al. 2001, ApJ 558, 237
- (7) Kouveliotou, C.; Dieters, S.; Strohmayer, T.; van Paradijs, J.; Fishman, G. J.; Meegan, C. A.; Hurley, K.; Kommers, J.; Smith, I.; Frail, D.; Murakami, T. 1998, Nature 393, 235
- (8) Kouveliotou, C.; Strohmayer, T.; Hurley, K.; van Paradijs, J.; Finger, M. H.; Dieters, S.; Woods, P.; Thompson, C.; Duncan, R. C. 1999, ApJ 510, L115
- (9) Kouveliotou, C.; Eichler, D.; Woods, P. M.; Lyubarsky, Y.; Patel, S. K.; Gögüs, E.; van der Klis, M.; Tennant, A.; Wachter, S.; Hurley, K. 2003, ApJ596, L79
- (10) Kulkarni, S. R.; Kaplan, D. L.; Marshall, H. L.; Frail, D. A.; Murakami, T.; Yonetoku, D. 2003, ApJ 585, 948
- (11) Lyubarsky, Y.; Eichler, D.; Thompson, C. 2002, ApJ 580, L69
- Potehkin (1999) Potekhin, A.Y. 1999, A&A, 351, 787
- (13) Rothschild, R. E.; Kulkarni, S. R.; Lingenfelter, R. E. 1994, Nature 368, 432
- (14) Thompson, C. & Beloborodov, A. M. 2005, ApJ 634, 565
- Thompson & Duncan (1995) Thompson, C. & Duncan, R.C. 1995, MNRAS, 275, 255
- Thompson & Duncan (1996) Thompson, C. & Duncan, R.C. 1996, ApJ, 473, 322
- (17) Wilson, C.A. et al., 2006, (in preparation)
- Woods et al. (2001) Woods, P.M., Kouveliotou, C., Gögüs., E., Finger, M.H., Swank, J., Smith, D.A., Hurley, K., & Thompson, C. 2001, ApJ, 552, 748
- (19) Yakovlev D.G., Levenfish K.P. & Shibanov Yu.A. 1999, Physics-Uspekhi 42, 737
- (20) Yakovlev D.G., Kaminker A.D., Gnedin O.Y. & Haensel P. 2001, Phys.Rep. 354, 1
- (21) Yakovlev, D. G.; Pethick, C. J. 2004, ARA&A..42, 169