Two Disk Components from a Gas Rich Disk-Disk Merger
Abstract
We employ N-body, smoothed particle hydrodynamical simulations, including detailed treatment of chemical enrichment, to follow a gas-rich merger which results in a galaxy with disk morphology. We trace the kinematic, structural, and chemical properties of stars formed before, during, and after the merger. We show that such a merger produces two exponential disk components, with the older, hotter component having a scale-length 20% larger than the later-forming, cold disk. Rapid star formation during the merger quickly enriches the protogalactic gas reservoir, resulting in high metallicities of the forming stars. These stars form from gas largely polluted by Type II supernovae, which form rapidly in the merger-induced starburst. After the merger, a thin disk forms from gas which has had time to be polluted by Type Ia supernovae. Abundance trends are plotted, and we examine the proposal that increased star formation during gas-rich mergers may explain the high -to-iron abundance ratios which exist in the relatively high-metallicity thick disk component of the Milky Way.
1 Introduction
That major mergers of two gas-rich disk galaxies can sporn a disk galaxy was shown in Springel & Hernquist (2005). Disk galaxies can result from such events for a large range of mass ratios, orbits, and rotational velocities of progenitor galaxies (Robertson et al. 2006). The discovery that thick disks are common, and perhaps even ubiquitous in disk galaxies (Dalcanton & Bernstein, 2000; Mould, 2005), and their old age means that the thick disk holds important clues to the formation of such galaxies. It also implies that disk galaxies forming from a major merger should have a thick disk component. Examining Figure 2 of Robertson et al. (2006), it is clear that a relatively hot (thick) disk component will naturally form in such mergers, motivating our desire to further investigate such events. In general terms, mergers were presumably increasingly gas-rich at increasingly early epochs. The possibility that gas-rich mergers play an essential role in disk galaxy formation has gained momentum in recent years. Brook et al. (2004b, 2005) suggest that the thick disk is formed in a high-redshift, gas-rich merger epoch, characteristic of a CDM Universe, during which the galaxy is born. High-redshift mergers being gas-rich is also consistent with other constraints including a low-mass, metal-poor stellar halo (Brook et al. 2004a), the chemical abundance patterns of the stellar halo (Renda et al. 2005; Font et al. 2006), and the angular momentum of disks (e.g. Governato et al. 2006). For a review of these issues, see Brook et al. (2006a).
The ratio of element to iron abundances has been used as a “clock” to infer different formation time-scales for different galaxy types, as well as for components of the Milky Way. Type II supernovae (SNe II), which trace star formation closely due the short life-spans of their high-mass progenitor stars, produce large quantities of oxygen, magnesium, silicon — the so-called elements. By contrast, iron is produced predominately in Type Ia supernovae (SNe Ia), whose explosions are delayed. Hence, the high -to-iron ratio characteristic of elliptical galaxies is interpreted as implying a rapid formation, while the low -to-iron ratio of disks and dwarf galaxies implies a protracted formation. In our Galaxy, the low metallicity stellar halo, with peak iron abundance has a ratio , while the relatively metal rich thick disk (peak ) also has enhanced elements compared with solar abundances. Recently, several studies (e.g. Bensby et al. 2005; Reddy, Lambert, & Allende 2006) have highlighted the difference in the -to-iron element abundance ratio between the hot and cold disk components of the Milky Way, providing a clue to the processes involved in the formation of the components. In Brook et al. (2005), we suggested that high star formation rates in gas-rich mergers result in increased metallicities with high element abundances. Such events may be central in forming the thick disk component of the Milky Way. Here, we examine in detail a single isolated example of such a merger, and follow the [/Fe] ratio, and how it evolves as the metallicity of the final galaxy increases during the merger event.
Our study shows that two disk components naturally form in a gas-rich merger, and we examine structural and kinematic features of the resulting galaxy. We show that the starburst which accompanies this merger has clear chemical signatures. We analyze and compare abundances in two specific groups of stars: merger stars, which are formed before and during the merger, and disk stars, those forming in the relatively quiescent period after the merger. The starburst which accompanies the merger results in rapid chemical enrichment with the large number of SNe II forming, ensuring high element abundances. We discuss implications for the end products of gas-rich merger events, and the importance of such events in the formation of disk galaxies. This merger simulation will form part of a larger suite of simulations which explore the kinematic, structural, and chemical properties of gas-rich mergers remnants with various values of progenitor mass ratio, rotational velocities, and impact angles.
2 Simulation Details and Results
We simulate the merger using GCD+, which self-consistently models the effects of gravity, gas dynamics, radiative cooling, and star formation. We give an outline of the code here, whilst full details are found in Kawata & Gibson (2003). GCD+ is a Tree/SPH algorithm that includes SNe Ia and SNe II feedback, and traces the lifetimes of individual stars, enabling us to monitor the chemical enrichment history of our simulated galaxies. Star formation occurs in a convergent gas velocity field where gas density is greater than a critical density, . The star formation rate (SFR) of eligible gas particles is then where is a dimensionless star formation efficiency, and is the dynamical time. This formula corresponds to the Schmidt law: SFR . The mass, energy, and heavy elements are smoothed over the neighboring gas particles using the SPH smoothing kernel. We assume that is fed back as thermal energy from each SNe. Gas within the SPH smoothing kernel of SNe II explosions is prevented from cooling, creating an adiabatic phase for gas heated by such SNe. This adiabatic phase is assumed to last for the lifetime of the lowest mass star that ends as a SN II, i.e., the lifetime of an star (100 Myr). This is similar to a model presented in Thacker & Couchman (2000). For SNe II, the metallicity-dependent stellar yields of Woosley & Weaver (1995) are adopted. For low- and intermediate-mass stars, we use the stellar yields of van den Hoek & Groenwegen (1997). We adopt SNe Ia model of Kobayashi, Tsujimoto, & Nomoto (2000), and the yields of Iwamoto et al. (1999).
The initial conditions are two galaxies with exponential gas disks, embedded in dark matter halos. These are created using GalactICS (Kuijken & Dubinski 1995), and are essentially stable in the that their density profiles, potential, and velocity ellipsoids will not change significantly when individual galaxies are evolved. GalactICS uses the lowered Evans model for the dark matter halo, which leads to a constant-density core. Numerical simulations suggest that halos have a cuspy central density profile (Navarro, Frenk, & White, 1996, 1997; Moore et al, 1999; Ghigna et al., 2000; Jing & Suto, 2000; Klypin et al., 2001). However, these results are in conflict with many observations, so we prefer to use a constant-density core. In any case, our results should not be sensitive to the details of the central density profile, since the core contains only a small fraction of the total mass.
The larger galaxy has total mass of . The mass ratio is 2:1, disk scale lengths are 4.5 and 3.1 kpc, and each has baryon fraction of 17. Each galaxy consists of 40,000 baryonic and 100,000 dark matter particles. The small galaxy approaches with its orbital angular momentum vector inclined to that of the large galaxy. Both galaxies have prograde rotation with respect to the angular momentum of the system, the orbital energy of the system is 1.7 ergs. The system is bound, and the spin parameter (ratio of orbital energy to binding energy) is . The gas disks evolve and form stars prior to the merger, and have gas fractions of at the time of the merger. Gas is given an initial metallicity of , and . We follow the simulation for 1.5 Gyrs.
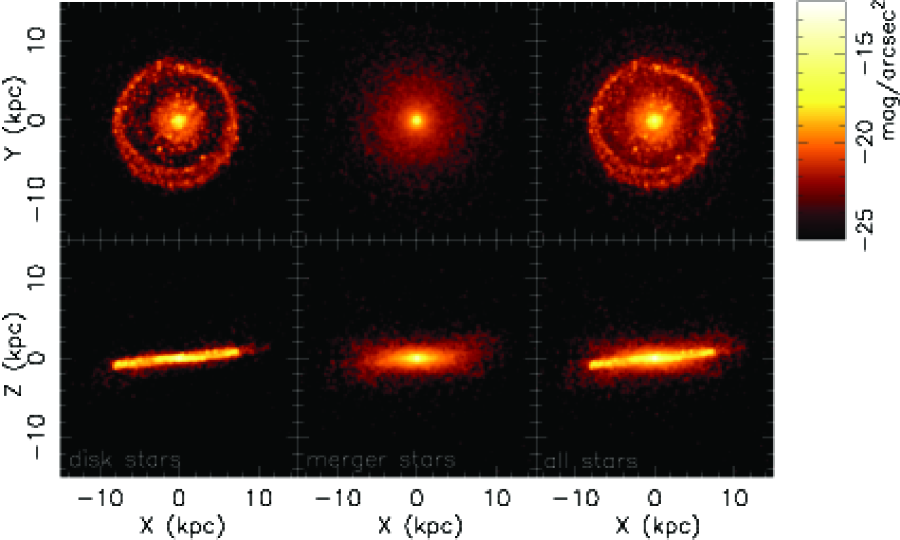

The gas-rich merger results in a final galaxy with disk morphology. Figure 1 shows the B-band luminosity map of the resultant galaxy after 1.5 Gyrs of the simulation, where we employ the simple stellar population of Kodama, & Arimoto (1997). Shown, both face on (upper panels) and edge on (lower panels) are all stars (right panel), what we will call merger stars, which are those formed before and during the merger (middle panel), and disk stars, which are those that form after the merger (left panel). From the face-on view, it is evident that the remnant of this particular merger simulation is a ring galaxy, which indicates that prograde gas-rich disk-disk mergers can produce ring galaxies. We find this especially interesting in light of Lavery et al. (2004), who found that the incidence of rings increases rapidly with redshift. We will study this further in our future papers.
The B-band luminosity profiles are shown in Figure 2, and used to determine scale-lengths of 5.1 and 4.1 kpc respectively for the merger and disk stars. A bulge component, within the inner , is apparent from the surface density profile, which is best fit with a bulge, disk, and thick disk. This is consistent with the merger remnant depicted in Figure 2 of Robertson et al. (2006). We note that our idealized initial disks do not have spheroid stellar components. Any stars in such component would end up in a spheroidal component in the final galaxy, and thus the idealized initial conditions are partially responsible for the lack of a significant spheroidal component in the final galaxy. Our results remain valid so long as any initial spheroid component is of low enough mass not to effect the dynamics of the merger.
The star formation rate, Figure 3, shows a starburst which peaks at around , during the merger. The end of this starburst is used to divide stars into merger and disk stars. Prior to the merger, star formation is around 30 M⊙yr-1. After the merger event, the star formation rate drops below after around a Gyr, although this is affected by our idealized initial conditions that assumes a dense gas disk. The mass of stars born before, during, and after the merger, are , , and respectively. The merger stars have a thicker morphology than disk stars. In the disk region, and , the merger and disk stars have total stellar mass of 3.5, and respectively. These two components also separate when we consider their metallicity distribution function. Figure 4 shows the metallicity distribution function for merger and disk stars. The merger stars have a peak metallicity of around , while the disk stars peak at . The long low-metallicity tail of the merger component is due to a difference in metallicity between merger stars born before and during the merger-induced starburst.


The top panel of Figure 5 shows the rotation velocity of merger and disk stars. Not surprisingly, the merger stars have significantly slower rotation. It is worth mentioning that a part of merger stars are counter-rotating. We also measure the rotation excluding the counter-rotating stars, and found that their rotation is still much lower than the disk stars. The timing of our division between merger and disk stars is consistent with the change in velocity dispersion, as seen in the bottom panel of Figure 5 which plots dispersion of rotational velocity versus formation time of the stars.

The chemical abundances of the merger simulation are explored in Figure 6. The average abundances of O, Mg, and Si are used to calculate [/Fe], and we take a slice through the galaxy at . The [/Fe] versus radius plot (top left panel) shows the merger stars ( symbols) have independent of radius (although the inner regions, associated with a bulge, is a little lower), whilst the later-forming disk stars ( symbols) have a value lower. The plot of [/Fe] versus [Fe/H] in the top middle panel is interesting, and motivated this letter. The merger stars maintain a higher ratio, [/Fe], even when their [Fe/H] has increased to solar values, whilst the disk stars which are formed with values of do so with relatively low values of [/Fe]. Examination of the bottom left panel, where we plot the evolution of [/Fe] with time, helps to explain this result. The first stars have , close to the initial condition, and their ratio drops prior to the merger. The value of [/Fe] increases during the time of the starburst, as indicated by the jump from the second to the third points, before decreasing to the value found in the disk. During the starburst, associated large numbers of SNe II provide a supply of elements which allows the maintenance of a high ratio of [/Fe], even as the iron content of the gas reservoir is increased (bottom middle panel). After the starburst, the pollution of SN Ia becomes effective, and along with the contribution of abundances of low- and intermediate- mass stars, the value of [/Fe] is maintained at a constant value. Further information on disk galaxy formation is found in vertical abundance gradients. The upper right panel of Figure 6 shows that neither merger nor disk stars have vertical gradient of [/Fe], while disk stars show a slight decrease in [Fe/H] at larger vertical height.
3 Discussion
In gas-rich mergers, two disk components naturally emerge. A thick disk consists of stars born before and during the merger, although we note that stars born before the merger can also end up in the stellar halo, which they did in the simulation of Springel & Hernquist (2005). A thin disk forms rapidly at the end of the merger. The high star formation triggered in such events can also help explain the chemical abundances of the stars. The starburst results in rapid increase in metallicity (Fig. 6, bottom middle panel), with the short star formation timescale ensuring that stars formed are enriched largely by SNe II, and hence merger stars maintain a higher [/Fe], even when their [Fe/H] has increased to solar values. The stars which form after this starburst epoch are formed with low values of [/Fe], even those formed with low , and this quiescent epoch means that the stars form in a thin disk, with low velocity dispersion (Fig. 5, bottom panel).

In Brook et al. (2004b), we found that the thick disk scale-length of our simulated galaxy was shorter than that of the thin disk. The observations of Yoachim & Dalcanton (2006) find that thick disk scale-lengths are systematically larger than those of thin disks. In this merger simulation, the hot merger star population has an exponential profile with scale-length larger than that of the later-forming disk star population. This may favor a significant gas-rich merger being a feature of disk galaxy formation. Further simulations will determine whether old, hot disks with scale-length larger than those of young cold disks result for a wide range of merger parameters. Caution is required in interpreting the result, as subsequent “inside-out” thin disk growth through gas infall (not present in the current simulation) may increase the thin disk scale-length (Brook et al., 2006b). Yoachim & Dalcanton (2006) further find that low-mass disk galaxies have larger thick:thin disk mass ratios. They interpret this as evidence for the formation of the thick disk by direct accretion of stars, as progenitors of lower mass galaxies will more easily expel their gas from their small potential well prior to the merger. Yet observations suggest that low mass galaxies are in fact more gas-rich, both at low redshift (e.g. Schombert, McGaugh, & Eder 2001) and high redshift (Erb et al. 2006), favoring gas-rich mergers as an interpretation of the higher thick:thin disk mass ratio in low mass galaxies. Also, the growth of the thin disk in small galaxies is perhaps regulated by their low densities (Dalcanton 2006) and supernovae feedback, i.e. the high thick to thin disk ratio of low-mass galaxies may be the result of less growth of a thin disk.
Our idealized study does not include cold accretion from the intergalactic medium and infall processes, which are important in the birth of disk galaxies. Further, in the hierarchical structure formation scenario, a range of merger histories exists, and to explain the predominance of thick disk components in disk galaxies, one cannot rely on a single merger event. Rather, a few or several significant gas-rich merger events are likely to occur at an early epoch in the formation of a disk galaxy (Brook et al. 2005). A cold mode of accretion from filamentary structures also occurs in this scenario. But our study supports the view that the violent accretion of gas-rich galaxies is central in producing thick disk properties. By ignoring cold accretion, our simplified study highlights the effect of the starburst associated with such mergers on the chemical abundances of the forming stars, in particular the high element abundances at high metallicities, and vertical abundance gradients. It is yet to be shown that cold accretion alone, perhaps resulting in a thin disk which is heated by an infalling satellite, or the dispersion of large star clusters (Kroupa 2002; Elmegreen & Elmegreen 2006), can reproduce such chemical signatures. Gas-rich mergers as the dominant process in forming thick disks provide a natural explanation of observed abundance patterns and gradients in the Milky Way disk components. A high-redshift epoch of gas-rich mergers is emerging as an important phase in the very birth of disk galaxies.
References
- Bensby et al. (2005) Bensby, T., Feltzing, S., Lundström, I., & Ilyin, I., 2005, A&A, 433, 185
- Brook et al. (2005) Brook, C. B., Gibson, B. K., Martel, H., & Kawata D. 2005, ApJ, 630, 298
- Brook et al. (2004a) Brook, C. B., Kawata, D., Gibson, B. K., & Flynn C. 2004a, MNRAS, 349, 52
- Brook et al. (2004b) Brook, C. B., Kawata, D., Gibson, B. K., & Freeman K. 2004b, ApJ, 612, 894
- Brook et al. (2006a) Brook, C. B., Veilleux, V., Kawata D., Martel, H., & Gibson, B. K. 2006a, in Island Universes, eds. Roelof de Jong, in press (astro-ph/0511002)
- Brook et al. (2006b) Brook, C. B., Kawata D., Martel, H., Gibson, B. K., & Bailin, J. 2006b, ApJ, 639, 126
- Dalcanton & Bernstein (2000) Dalcanton, J. J., & Bernstein, R. A. 2000, AJ, 120, 203
- Dalcanton (2006) Dalcanton, J. J. 2006, ApJ, in press (astro-ph/0608590)
- Elmegreen & Elmegreen (2006) Elmegreen, B. G., & Elmegreen, D. M. 2006, ApJ, in press (astro-ph/0607540)
- Erb et al. (2006) Erb, D. K., Shapley, A. E., Pettini, M., Steidel, C. C., Reddy, N. A., & Adelberger, K. L. 2006, ApJ, in press (astro-ph/0602473)
- Font et al. (2006) Font, A. S., Johnston, K. V., Bullock, J. S., & Robertson, B. E. 2006, ApJ, 638, 585
- Ghigna et al. (2000) Ghigna, S., Moore, B., Governato, F., Lake, G., Quinn, T., & Stadel, J. 2000, ApJ, 544, 616
- Governato et al. (2006) Governato, F., Willman, B., Mayer, L., Brooks, A., Stinson, G., Valenzuela, O., Wadsley, J., & Quinn, T. 2006, MNRAS, submitted (astro-ph/0602351)
- Iwamoto et al. (1999) Iwamoto, K., Brachwitz, F., Nomoto, K., Kishimoto, N., Umeda, H., Hix, W. R., & Thielemann, F.-K. 1999 ApJS, 125, 439
- Jing & Suto (2000) Jing, Y. P., & Suto, Y. 2000, ApJ, 529, L69
- Kawata & Gibson (2003) Kawata, D., & Gibson, B. K. 2003, MNRAS, 340, 908
- Klypin et al. (2001) Klypin, A., Kravtsov, A. V., Bullock, J. S., & Primack, J. R. 2001, ApJ, 554, 903
- Kobayashi, Tsujimoto, & Nomoto (2000) Kobayashi, C., Tsujimoto, T., & Nomoto, K. 2000, ApJ, 539, 26
- Kodama, & Arimoto (1997) Kodama, T., & Arimoto, N. 1997, A&A, 320, 41
- Kuijken & Dubinski (1995) Kuijken, K., & Dubinski, J. 1995, MNRAS, 277, 1341
- Kroupa (2002) Kroupa, P. 2002, MNRAS, 330, 707
- Lavery et al. (2004) Lavery et al. 2004, ApJ, 612, 679
- Moore et al (1999) Moore, B., Quinn, T., Governato, F., Stadel, J., & Lake, G. 1999, MNRAS, 310, 1147
- Mould (2005) Mould, J. 2005, AJ, 129, 698
- Navarro, Frenk, & White (1996) Navarro, J. F., Frenk, C. S., & White, S. D. M. 1996, ApJ, 462, 563
- Navarro, Frenk, & White (1997) Navarro, J. F., Frenk, C. S., & White, S. D. M. 1996, ApJ, 490, 493
- Reddy, Lambert, & Allende (2006) Reddy, B. E., Lambert, D. L., & Allende, P. C. 2006, MNRAS, 367, 1329
- Renda et al. (2005) Renda, A., Gibson, B. K., Mouhcine, M., Ibata, R. A., Kawata, D., Flynn, C., & Brook, C. B. 2005, MNRAS, 363, L16
- Robertson et al. (2006) Robertson, B. E., Bullock, J. S., Cox, T. J., Di Matteo, T., Hernquist, L., Springel, V., & Yoshida, N. 2006, ApJ, 645, 986
- Schombert, McGaugh, & Eder (2001) Schombert, J., M., McGaugh, S., S., & Eder, J.-A. 2001, AJ, 121, 2420
- Springel & Hernquist (2005) Springel, V., & Hernquist, L. 2005, ApJ, 622, L9
- Thacker & Couchman (2000) Thacker, R. J., & Couchman, H. M. P. 2000, ApJ, 545, 728
- van den Hoek & Groenwegen (1997) van den Hoek, L. B., & Groenwegen, M. 1997, A&AS, 123, 305
- Woosley & Weaver (1995) Woosley S. E., & Weaver, T. A., 1995, ApJS, 101, 181
- Yoachim & Dalcanton (2006) Yoachim, P. & Dalcanton, J. J. 2006, AJ, 131, 226