STUDYING THE EVOLUTION OF MULTI-WAVELENGTH EMISSIVITIES WITH THE VIMOS VLT DEEP SURVEY
The VIMOS VLT Deep Survey (VVDS) is a unique -selected spectroscopic sample to study galaxies all the way from to . We recapitulate the first results about the evolution of the galaxy populations as a function of type, morphology, environment and luminosity.
1 Introduction
Galaxy redshift surveys are outstanding tools for observational cosmology because they produce large sample of standard galaxies at different cosmic epochs. Redshift acquisition has undergome tremendous progress thanks to advances in technology, and redshift surveys appear nowdays as routine. Even though they may look simple at face-value, the strategy of a survey and the galaxy-selection criteria have crucial impacts on the interpretation of results. Since galaxies are directly observable point-like tracers of dark matter halos, they represent only the tip of the iceberg of what drives the evolution of the Universe. Hence interpretation of these surveys via model-dependent approches provide fundamental insights into galaxy evolution and formation.
The construction of various distribution functions in different redshift bins leads to the description of the galaxy populations through cosmic time. In this process a key-point is to define and quantify the completeness of sources so we can compare galaxy samples both at different redshift bins within a single survey, and with other observed or simulated surveys (see discussions in Tresse, 1999). The luminosity function, , that is the distribution of the comoving number density of galaxies as a function of their intrinsic luminosity, is a fundamental measurement to quantify the evolution of the galaxy populations. Moreover, integrated quantities such as the luminosity density, , are little dependent on the individual evolutionnary histories, and are solid links to the underlying processus of galaxy evolution and formation, such as the star formation rate (SFR) history or the stellar mass assembly. Nevertheless, because galaxy evolution involves a complex interplay of galaxy morphology, color, SFR, mass accretion and environment, it is necessary to acquire large samples to trace the galaxy populations sorted out according to these parameters. These galaxy characteristics are supplied by the new generation of redshift surveys, like the VVDS (www.oamp.fr/virmos/), over the same regions of sky as broad-band or follow-up observations.
2 The VIMOS VLT Deep Survey
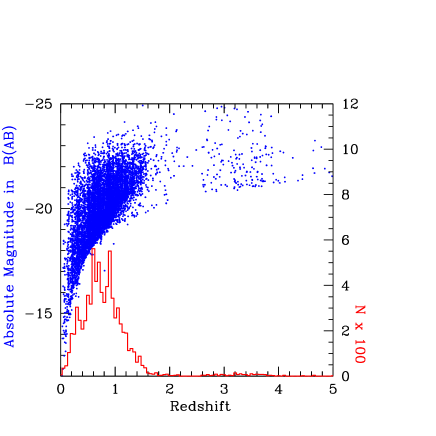
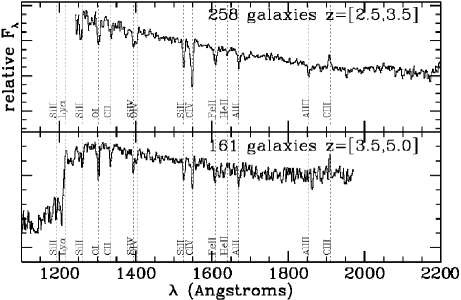
The VVDS redshift survey is based primarily on observations with the 8.2m ESO-VLT Melipal telescope in Paranal, Chili. It consists of spectra of over faint sources covering deg2 in five regions of sky. The survey is divided into three selection functions with sources selected to have (VVDS-Deep), (VVDS-Wide), and (VVDS-Ultra Deep). Sources have been targeted on the sole criterion of an flux limit. No pre-selection has been applied in term of colors, sizes, photometric redshifts, or peculiar sources. We present results from the first epoch observations (VVDS-Deep) obtained in two fields of view, VVDS-02 and VVDS-CDF (see details in Le Fèvre et al., 2004; Le Fèvre et al., 2005a). The sample is composed of 11564 spectra over 2200 arcmin2 of sky area observed in UBVRI broad-band photometry. The measured redshifts are at with an average redshift of (and a median of ), and with a 1 accuracy of the measurement of (see Fig. 1a). We have classified 79% (7840 galaxies, 751 stars, 71 QSOs), and 14% (1500 galaxies, 80 stars) of spectra with confidence levels at %, and within []%, respectively, and 7% of spectra have not been identified. The most amazing discovery was the high-quality spectra of galaxies at high redshifts, which were not expected (see Fig. 1b). We emphasize that we have obtained an excellent efficiency for determing redshifts at and at . At reliable spectral features are difficult to detect, and observations extending further to the blue or into the near-infrared are required to fill this gap with more redshifts. Absolute magnitude measurements are optimized accounting for the full information given by the multi-band photometric data in a way which minimizes the dependence to the templates used to fit the observed colors (Ilbert et al., 2005). We adopt the set (, , ) = (0.3, 0.7, 0.7) for the cosmological parameters.
3 The Evolution of Galaxy Population Emissivities
3.1 Since
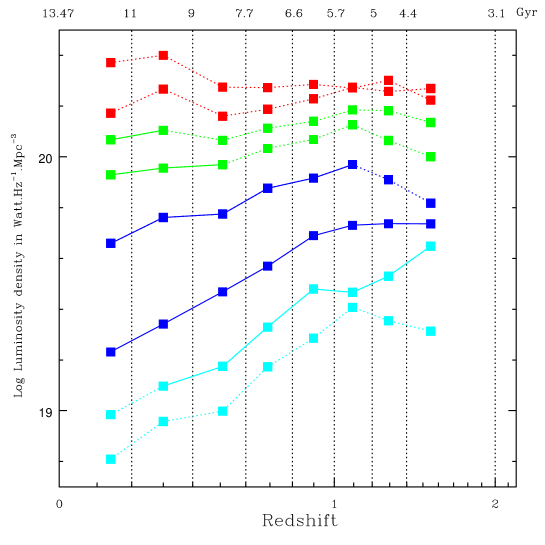
We have built the luminosity functions (LF) using the VVDS multi-wavelength data in the rest-frame bands U-3600, B-4400, V-5500, R-6500, I-7900 (see Ilbert et al., 2004; Ilbert et al., 2005), in the GALEX rest-frame bands FUV-1500 (see Arnouts et al., 2005) and NUV-2800, and in the rest-frame K-22000. The corresponding luminosity densities (LD) are derived in summing them over all luminosities (see Fig. 2). As we do not observe the faintest galaxies (and neither a cut-off at faint luminosities), the latter estimates are extrapolations of the LFs using the STY estimator. The global galaxy population exhibits a clear differential, wavelength-dependent evolution which undergoes an upturn at redder wavelengths than the -band. This evolution is related more or less directly to the very different stellar populations which dominate a given rest-frame band. Although error bars are still large, most LDs display a transition at in the evolutionary tendency. Over the last 8.5 Gyrs, the SFR-related LD(FUV) drops by a factor 4 while the stellar mass-related LD(K) increases by a factor 1.3 in the last 4.5 Gyrs. It might be evidence for recent merger events, but which should produce little star formation.
3.2 Since
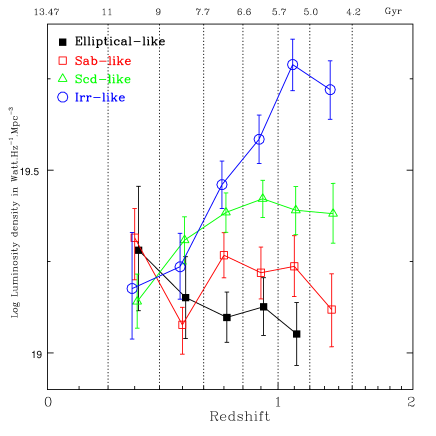
The VVDS selection function provides a sample of high- galaxies which have not been pre-selected given fixed criteria. It has enabled to discover between 1.6 to 6.2 times more luminous galaxies at (see Le Fèvre et al., 2005b; Paltani et al., 2006). Within a single survey, it makes possible to compare our galaxy populations all the way from to . We begin to see structures in the global emissivity evolution, such as the several up-and-down phases through cosmic time of the global rest-frame LD(FUV) (see Fig. 3). In particular, from to it increases by at most a factor . From to it globally decreases by a factor 1.2, with a potential decline by a factor from to , and an increase by a factor from to . From to it declines steadily by a factor 4.

4 The Evolution per Galaxy Populations
Galaxies present various features which can be regrouped into classes related to fundamental observables, such as the morphology, the colors, the luminosity, the environment, etc. Classes are usually set using well-known local parameters. Through their individual history, galaxies might change of class through cosmic time, and thus the comparative study of the distribution functions built at different redshifts enables us to trace the evolution of galaxy populations, but not the evolution of individual galaxies.
4.1 Per spectral type
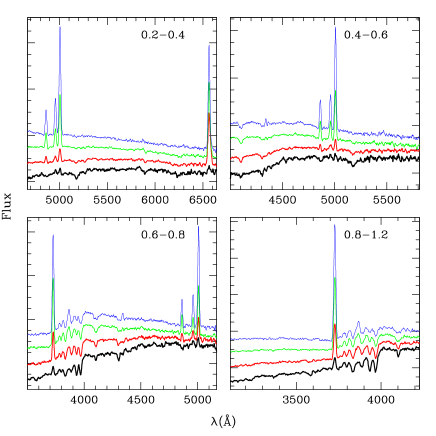
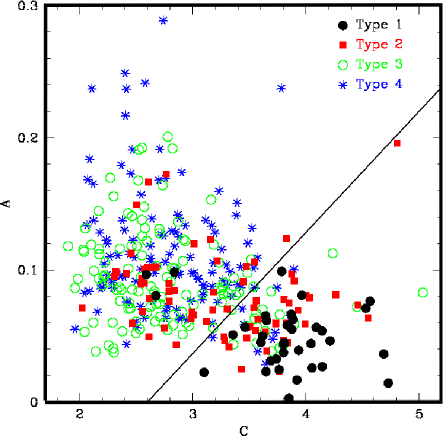
Using the whole photometric information, we have classified our galaxies in four VVDS spectral classes, using both their colors and redshift, from early to late type galaxies. Our classification is thus not model-dependent, in the sense that it does not take any color evolution with redshift. Each class is large enough to encompass spectral energy distributions as both the four observed CWW spectra at , and luminosity-evolved templates (see discussion in Zucca et al., 2006). That is the VVDS classes are globally related to the standard spectroscopic and morphological shape of local normal galaxies as it can be seen in Fig. 4.
From Zucca et al. (2006) and Tresse et al. (2006), we find the following results for the early and late type classes up to look-back times corresponding to 30 percent of the current age of the Universe (see Fig. 5a). The LF of the early-type population is consistent with only passive luminosity evolution since , while the fraction of bright early-type galaxies ( mag) increases from 0.05 to 55 percent from to (see Fig. 5b). The corresponding LD(B) increases continuously by a factor . This population suggests that luminous red galaxies must appear at low redshifts to keep increasing the LD since this population is faintening by 0.3 mag only. The LF of the late-type population undergoes a strong evolution in density and luminosity. There is a steady decrease in volume density by a factor coming from both the bright and faint parts of the LF. The fraction of bright late-type galaxies decreases from to percent from to . Thus the corresponding LD(B) decreases markely by a factor . This population supports a downsizing scenario where most star formation is shifting to faint galaxies at .
4.2 Per morphological shape
We have split the VVDS-CDFS galaxies in bulge- and disk-dominated classes (see Fig. 4b and Ilbert et al., 2006a). We show that the bulge-dominated class is composed of two populations; a red and bright galaxy populations (70%) and a blue, compact galaxy population (30%).
As shown in Fig. 6a, we have measured a mild evolution of the disk-dominated population with a LD(B) decreasing by a factor , corresponding to a mag faintening of the stellar populations from to with no significant density evolution. For the red bulge-dominated population, we measure a small increase of the LD(B) by a factor , corresponding to a faintening of 0.2 mag and an increasing density evolution by a factor from to . In contrast, the blue bulge-dominated population undergoes the strongest evolution with the LD(B) increasing by a factor 16 in the last 8.5 Gyrs, corresponding to a faintening of 0.7 mag. This latter population could be the progenitors of the local low-mass spheroidal galaxies.
4.3 Per local environment
The 3D galaxy density field is reconstructed using a gaussian filter smoothing length 5 Mpc over the VVDS-F02 field. The galaxies have been classified in two environment classes, the under- and over-dense environments relative to the average density contrast. The LF shape is strongly dependent on the large-scale environment, suggesting that the environment has been efficiently in place at (Ilbert et al., 2006b). Since the local measurements do not exhibit this dependence, our result suggests that the number of faint red galaxies increases with cosmic time in over-dense environment, consistent with the evolution of the color-environment relationship described in Cucciati et al. (2006).
As shown in Fig. 6b, from to the evolution of the LD(B) continuously decreases by a factor in under-dense environments driven by faintening of 0.6 mag. It is in agreement with the strong LD decline of the late-type polulation, and which dominates the under-dense environments. In over-dense environments, the LD(B) increases by a factor from to , and then decreases by a factor . The over-dense environments are dominated by the bright early-type galaxies and faint late-type galaxies. And thus the over-dense environments are the place where there is a complex interplay between the decrease of the star formation rate in late types and the increasing fraction of bright early types.


4.4 Per intrinsic luminosity
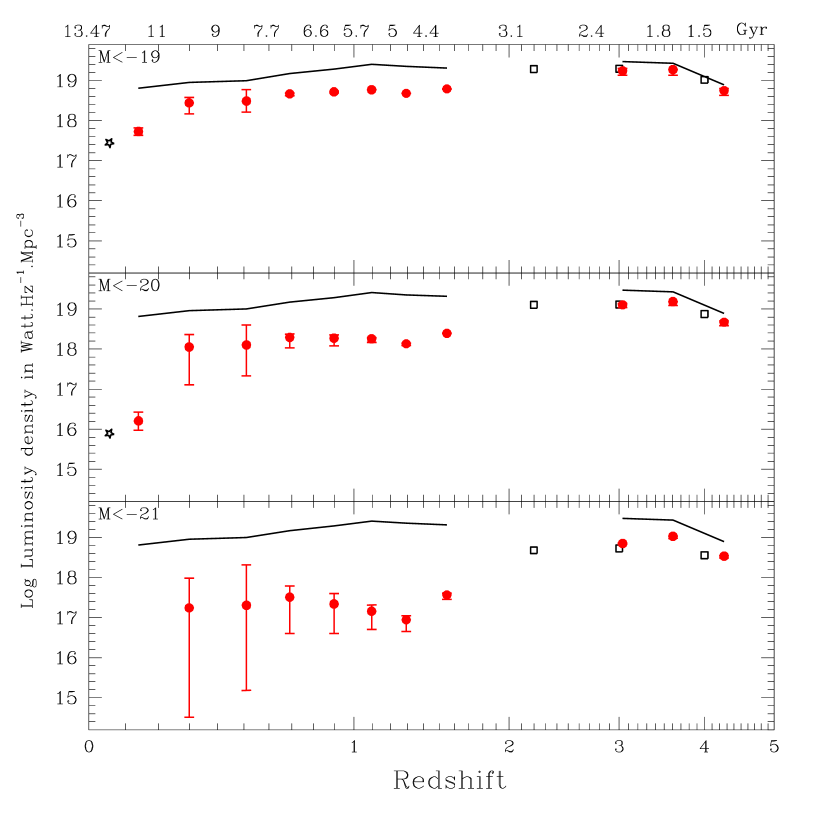
The SFR-related LD(FUV) is strongly luminosity-dependent as shown in Fig. 7. The old, most luminous () galaxy population has exhausted its cold gas reservoir during its early intense star formation which has occured in the early Universe at , and since , i.e. 12 Gyrs, its undergoes passive evolution as star formation cease. It creates excellent dry candidates. Creation of new galaxies occurs as the threshold amplitude for forming bright galaxies decrease as described in Marinoni et al. (2005). That is the typical of the population created at a given redshift will decrease with decreasing redshift. This imply that the younger, less luminous galaxy population continues to efficently form stars with a large reservoir of cold gas up to . And at , this later population appears to have also exhausted its gas supply. The gas-exhaustion would favor the evolution of morphologies toward early-type galaxies.
At , both processes, i.e. dry mergers toward decreasing redshift and morphologies evolving toward early-type galaxies, might contribute to an increase of the bright early-type population by a factor to reach percent of the total population from to , while the early-type population undergoes a passive luminosity evolution. However, it leaves little room for mergers even dry ones from to , since the mass related LD(K) does not evolve in this redshift range, except from to and from to .
5 Summary
Within a single survey, as the VVDS, we have quantified the galaxy population distributions since . Our observed global evolution does not seem to be in agreement with a continuous smooth decrease from to as predicted by the simulations. It is related to both the characteristics of the dominant population at a given cosmic time and the evolution of the galaxy populations (per type, per morphology, per environment, per luminosity). The picture is globally consistent with a downsizing scenario for the star formation rate in galaxies, while the dwarf population undergoes density evolution. The blue compact galaxy population is the class which undergoes the strongest evolution than any other galaxy class over the last 8.5 Gyrs. The red, spheroid galaxy population is the class which undergoes the strongest positive density evolution over the last Gyrs. From to today, the emissivity of the Universe is increasingly dominated by a dust deficient galaxy population, in constrast with the more distant Universe dominated by dust rich, star forming galaxies.
References
References
- [1] Arnouts S., Schiminovich, D., Ilbert, O., 2005, ApJL, 619, L43
- [2] Cucciati, O., Iovino, A., Marinoni, C. et al. 2006, A&A, 458, 39
- [3] Gabasch, A., Bender, R., Seitz, S. et al. 2004, A&A, 421, 41
- [4] Ilbert, O., Tresse, L., Arnouts, S. et al. 2004, MNRAS, 351, 541
- [5] Ilbert, O., Tresse, L., Zucca, E. et al. 2005, A&A, 439, 863
- [6] Ilbert, O., Lauger, S., Tresse, L. et al. 2006a, A&A, 453, 809
- [7] Ilbert, O., Cucciati, O., Marinoni, C. et al. 2006b, arXiv:astro-ph/0602329
- [8] Le Fèvre, O., Vettolani G., Paltani, S, et al. 2004, A&A, 428, 1043
- [9] Le Fèvre, O., Vettolani G., Garilli, B. et al. 2005a, A&A, 439, 845
- [10] Le Fèvre, O., Paltani, S., Arnouts, S. et al. 2005b, Nature, 437, 519L
- [11] Marinoni, C., Le Fèvre, O., Meneux, B. et al. 2005, A&A, 442, 801
- [12] Paltani, S., Le Fèvre, O., Ilbert, O. et al. 2006, arXiv:astro-ph/0608176
- [13] Sawicki, M., Thompson, D. 2006, ApJ, 648, 299
- [14] Tresse, L. 1999, arXiv:astro-ph/9902209
- [15] Tresse, L., Ilbert, O., Zucca, E. et al. 2006, arXiv:astro-ph/0609005
- [16] Zucca, E., Ilbert, O., Bardelli, S. et al. 2006, A&A, 455, 879
- [17] Wyder, T., Treyer, M., Milliard, B. et al. 2005, ApJL, 619, L11