Modeling active galactic nuclei: ongoing problems for the faint-end of the luminosity function
Abstract
We consider simple semi-analytic models that relate the active galactic nuclei (AGN) evolution to the merging history of their host dark matter haloes and quantify their ability of matching the AGN luminosity function and its spatial clustering at low and intermediate redshifts. In particular, we focus on the recent determinations of the AGN luminosity function in the hard X-ray band at which constitutes the most stringent observational test for our models. Indeed, while we find an acceptable agreement between the model bolometric luminosity function and the data at and for luminosities larger than , no semi-analytic model is capable of reproducing the number density of faint X-ray sources in the local universe. Some improvement can be obtained by advocating energy feedback that we model through a time-dependent Eddington ratio. Even in this case, however, the number density of faint AGNs is significantly below observations. This failure indicates that major mergers cannot constitute the only trigger to accretion episodes in the local AGN population.
keywords:
AGN: general – galaxies: formation – galaxies: active – cosmology: theory – cosmology: observations1 Introduction
The luminosity function (LF) of AGNs, namely the derivative of their co-moving number density with respect to luminosity, is a very important tool to understand their cosmological evolution. In the recent years, the AGN LF has been measured in a wide range of redshifts, luminosities and in different wavelength bands: radio (see e.g. Nagar et al., 2005), optical (see e.g. Koehler et al., 1997; Grazian et al., 2000; Croom et al., 2005; Richards et al., 2005, 2006; Siana et al., 2006), infra-red (see e.g. Brown et al., 2006; Matute et al., 2006), soft X-ray (see e.g. Miyaji et al., 2001; Hasinger et al., 2005), hard X-ray (see e.g. Ueda et al., 2003; Sazonov & Revnivtsev, 2004; La Franca et al., 2005; Shinozaki et al., 2006; Beckmann et al., 2006). In this work we are mainly interested in the two most recent determinations of the AGN LF in the hard () X-ray band that, despite being very local, provides strong constraints to AGN models. The first one, provided by Shinozaki et al. (2006) (hereafter S06), consists of a complete, flux-limited sample of 49 sources from the HEAO-1 All-Sky catalogue, complemented with spectral information from ASCA, XMM-Newton and Beppo-SAX observations. All objects in the catalogue are optically classified as emission-line Seyfert galaxies at high galactic latitude () with column density and . The second AGN LF has been determined in a harder X-ray band by Beckmann et al. (2006) (hereafter B06), using a sample of 38 objects, preferentially located at low galactic latitude, detected by the imager IBIS/ISGRI on-board INTEGRAL, with . The main reason for concentrating on these two datasets is that they allow to span a large band in which it is possible to detect absorbed and unabsorbed AGNs at all galactic latitudes.
Further observational constraints to theoretical models are provided by the AGN spatial clustering, which is often quantified by means of the angular or spatial two-point correlation function. Uncertainties in current modeling of the AGN clustering, however, make this second constraint less effective than the LFs. In spite of that, in this work we also check the ability of our models in matching the AGN biasing function, defined as the ratio between the spatial two-point correlation function of AGNs and dark matter (DM): , where is the mass of the hosting halo. Also in this case, we consider the very recent determination of the AGN biasing function in the B-band by Porciani & Norberg (2006) (hereafter PN06), which provide the most accurate estimate of the AGN clustering to date.
Over the years, several analytic (see e.g. Efstathiou & Rees, 1988; Haehnelt & Rees, 1993; Haiman & Loeb, 1998; Percival & Miller, 1999; Haiman & Menou, 2000; Martini & Weinberg, 2001; Hatziminaoglou et al., 2001; Wyithe & Loeb, 2002, 2003; Hatziminaoglou et al., 2003) and semi-analytic (see e.g. Cattaneo et al., 1999; Kauffmann & Haehnelt, 2000; Cavaliere & Vittorini, 2000; Cattaneo, 2001; Cavaliere & Vittorini, 2002; Enoki et al., 2003; Volonteri et al., 2003; Springel et al., 2005; Cattaneo et al., 2005; Croton et al., 2006; Malbon et al., 2006) models have been proposed to describe the co-evolution of supermassive black holes (BH) powering AGNs and their DM halo hosts within the hierarchical clustering framework. These models proved to be successful in matching the optical LF of AGNs around their peak of activity at . However, modifications to the simple analytic models in which the AGN activity is triggered by haloes’ mergers have been subsequently introduced to bring predictions into agreement with the observed AGN LFs both at higher and lower redshifts. For example, selective BH accretion at early stages occurring either at super-critical rate (e.g Volonteri & Rees, 2005) or at Eddington rate for BHs hosted in the high-density peaks (e.g. Volonteri & Rees, 2006), can explain the observed number density of AGNs at .
At low redshifts (), inefficient cooling in large haloes is required to improve the match to the bright end of the LF in both the optical and hard X-ray bands (Marulli et al., 2006) (hereafter M06). In the same redshift range, Volonteri et al. (2006) have recently shown that inefficient accretion, suggested by the results of numerical simulations that track accretion onto BHs following halo mergers (Hopkins et al., 2005), increases the number density of faint AGNs matching their optical luminosity function. Whether these modifications can also reproduce the LF of AGNs in the very nearby universe and in other luminosity bands it is still matter of debate.
Before addressing this question, it is worth stressing that comparisons between model and observed LFs are hampered by the fact that, while the former refer to bolometric luminosities, the latter are measured in some specific bands. Luminosity band corrections represent therefore a key issue that has been addressed by several authors (see e.g. Elvis et al., 1994; Marconi et al., 2004). In this paper, we adopt the bolometric correction recently proposed by Hopkins, Richards & Hernquist (2006) (hereafter H06) using a number of determinations of AGN LFs in the interval and in different bands ranging from infrared to optical, soft and hard X-ray bands. It is worth noticing that the H06 bolometric correction was not calibrated using the S06 and B06 results. Yet, as we have verified, the bolometric correction successfully applies to both LFs. This is less obvious for the B06 than for the S06 dataset which, in fact, contains a significant fraction of objects that have been included in the H06 analysis.
The main aim of this work is to predict the LF of AGNs using standard semi-analytic hierarchical models at and compare it to the S06 and B06 results by using the H06 bolometric corrections. In doing so, we also show model predictions for the AGN LFs and clustering up to , hence updating the results of M06.
The outline of the paper is as follows. In the first section we briefly present the semi-analytic models considered in this work and summarize the main assumptions used therein. In Section 3 we compare model predictions with the observed luminosity and biasing function of AGNs. Finally, in the last section we discuss our results and draw our main conclusions.
Throughout this paper we assume a flat CDM cosmological model with Hubble constant , a dominant contribution to the density parameter from the cosmological constant, , and a CDM density power spectrum with primordial spectral index .
2 Semi-analytic models
Most of the semi-analytic models used in this work have been already considered by M06. They all assume that the evolution of AGNs can be followed within the standard hierarchical scenario of structure evolution under the hypothesis that, at every redshift, the AGN activity is solely determined by the cosmological merging history of their DM halo hosts. In this framework, the merging history of dark haloes is described by the extended Press & Schechter formalism (Bond et al., 1991; Lacey & Cole, 1993), while phenomenological prescriptions are adopted to model the feeding of the central BH and the physical processes of the AGN activity.
Like in M06, the models are based on the semi-analytic code developed by Volonteri, Haardt & Madau (2003). AGN activity is assumed to be triggered when major mergers occur, i.e. when the two merging haloes have a mass ratio larger than . Due to the lack of an exhaustive study of the ultimate consequences of a galaxy merger in its whole parameter space, we are forced to make some simplifying assumptions to follow the merging events. Following Cox (2004), we can assume that all halo mergers, except the ones with mass ratio smaller than , can destabilize the gas at the centre of the more massive halo, and consequently induce star formation and BH mass accretion. Notice that this threshold is lower than the value of generally used in the literature, but it is not low enough to reproduce the observed faint AGN number counts, as we will describe later. So, an higher value of the mass ratio would worsen our results, while a lower one would be in disagreement with the results of Cox (2004), which show that a typical merger with a mass ratio of does not induce starbursts. Moreover, according to Taffoni et al. (2003), when the dynamical friction timescale is larger than the Hubble time, hence preventing the merging of satellite galaxies and, reasonably, making the accretion efficiency onto the central BH very low.
We stress here that considering galaxy rather than halo mergers could lead to different predictions as it is not always true that a major merger of two dark matter haloes will result in a major merger of their galaxies (and viceversa). A galaxy-merger-driven scenario has the virtue of matching the observed correlation between BHs and their galaxy hosts (Magorrian et al., 1998; Ferrarese & Merritt, 2000; Gebhardt et al., 2000) but can only be self-consistently implemented within the framework of a full semi-analytic or numerical model of galaxy formation and evolution. This is beyond the scope of this work in which, instead, we use a model meant to minimise the number of free parameters.
It is also assumed that the seed BHs formed with masses of following the collapse of the very rare Pop III stars, in minihaloes forming at from the density peaks above a threshold; however, as shown by Volonteri et al. (2003), the final results are not very sensitive to this choice. After every major merger, the BH at the centre of the more massive halo increases its mass, , after a dynamical free-fall time when a significant fraction of the gas falls to the centre of the merged system (Springel, Di Matteo & Hernquist 2005; Di Matteo, Springel & Hernquist 2005) and is accreted at an appropriate rate. To implement this mechanism we need to specify the prescriptions for the mass accretion, that can be modeled by the following relation
| (1) |
in which , is the Eddington ratio of mass accretion, and is the radiative efficiency.
We have considered four different scenarios.
-
•
In the first one, labeled E1 in all plots, the accreted mass is proportional to the mass of the available gas and hence to the total mass of the more massive progenitor: . We set , in agreement with the normalization of the relation at , where is the velocity dispersion of the host galaxy (Tremaine et al., 2002), scaling with the halo circular velocity, , as suggested by Ferrarese (2002). As , the slope of the relation is flatter than the observed one (but see Wyithe & Loeb, 2005).
-
•
The second scheme, labeled E2, assumes a scaling relation between the accreted mass and the circular velocity of the host halo, , which is normalized a-posteriori to reproduce the observed relation between and at (Ferrarese, 2002). As in M06, we assume a linear dependence of on redshift, as , in order to account for the decrease of the gas available to fuel BHs. Unlike model E1, here and in the other three models the relation between and evolves in redshift as in Wyithe & Loeb (2003): , in which , and represents the mass density parameter. Finally, we account for inefficient cooling in large haloes by preventing accretion within haloes of masses . It is worth noticing that this prescprition has a physical motivation connected to both galaxy and AGNs formation since it has the same effect of including the low luminosity radio mode AGN heating, as done in many semi-analytic models of galaxy formation to produce a massive galaxy population similar to the one observed (see e.g. Kang et al., 2006; Bower et al., 2006; Cattaneo et al., 2006; Croton et al., 2006).
-
•
Another model, labeled B, assumes an early stage of super-critical accretion during which the central BH (AGN) accretes mass at a rate that can be estimated by the Bondi-Hoyle formula (Bondi & Hoyle, 1944). This model applies to metal-free haloes, therefore we assume that by the interstellar medium has been enriched, and we inhibit super-critical accretion rates. When the super-critical phase ends, accretion proceeds in subsequent episodes as in model E2. This possibility has been recently advocated by Volonteri & Rees (2005) to reconcile a hierarchical evolution with the existence of QSO at , hosting SBHs with masses .
In all these models, which do not account for possible feedback mechanisms, we set in Eq. (1) the Eddington ratio of mass accretion, .
-
•
In this work we consider also a different model, labeled H, which accounts for the results of the recent hydrodynamic simulations of galactic mergers in which AGN feedback is included (Hopkins et al., 2005) that show that the Eddington ratio is not constant but depends on AGN luminosity. As the main variable in the model is the BH mass rather than the AGN luminosity, Volonteri et al. (2006) model as follows. First the time spent by a given AGN per logarithmic luminosity interval is approximated as
(2) where , , and is the luminosity of the AGN at the peak of its activity and it can be approximated as the Eddington luminosity of the BH at its final mass, i.e. when it sets on the relation (Hopkins et al., 2005). Then, since the AGN luminosity can be written as , where is the radiative efficiency, 111The radiative efficiency has been self-consistently determined by tracking the evolution of BH spins throughout the calculations (Volonteri et al., 2005)., the following differential equation is used to describe the evolution of
(3) The instantaneous Eddington ratio is obtained by solving Eq. 3. Model H assumes that the final mass of the black hole is determined by the circular velocity of the host halo, as in model E2.
3 Models vs. observations
3.1 The bolometric luminosity function between
| Model | |||||
|---|---|---|---|---|---|
| E1 | 5.3 (0.2%) | 2.2 (13.6%) | 1.5 (34.9%) | 1.1 (45.0%) | 6.6 (2.5%) |
| E2 | 2.5 (2.4%) | 3.3 (7.4%) | 4.6 (4.9%) | 2.8 (16.4%) | 0.5 (80.8 %) |
| B | 5.4 (0.3%) | 5.2 (3.2%) | 5.7 (4.0%) | 3.1 (12.2%) | 1.1 (50.8 %) |
| H | 2.3 (2.5%) | 3.7 (6.0%) | 5.5 (4.3%) | 1.9 (26.9%) | 0.4 (90.8 %) |
To compute the model LF we have considered binary merger trees with masses in the range (Volonteri et al., 2003). M06 have used models E1, E2 and B described in the previous section to follow the accretion history of the BHs and the evolution of AGN luminosity at the centre of haloes. Here we have repeated this procedure to implement the novel model H .
We have calculated the bolometric LF by simply discretizing the luminosity range of our modeled AGN sample in finite bins, counting their number density in all our merger trees, each of them weighted by the halo number density at (Sheth & Tormen, 1999) and normalizing for the number of merger trees and time-steps considered. Uncertainties in the model LF have been computed assuming Poisson statistics.
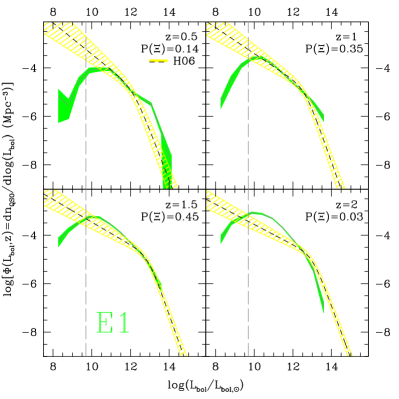
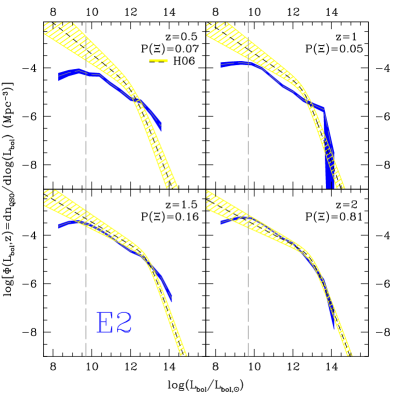
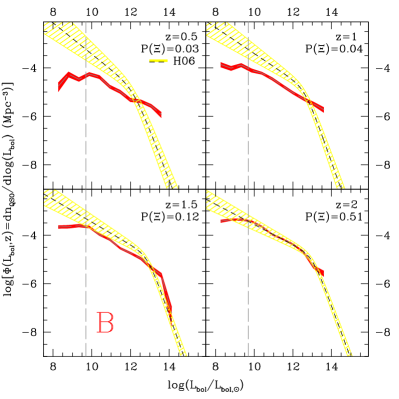
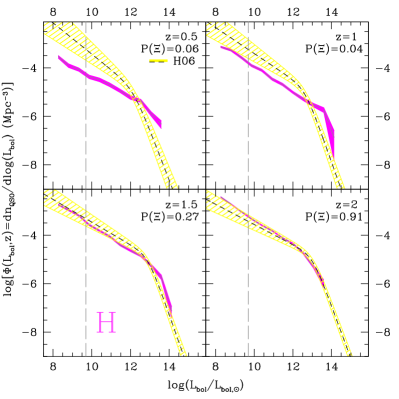
As a first step, we extend the M06 analysis by comparing the bolometric luminosity function of H06 with the analogous quantity predicted by the four models at redshifts and . This comparison represents a more severe test to the models than the one performed by M06, since the number of AGNs used by H06 to model their bolometric LF is significantly larger than those considered by M06, and consequently the uncertainties are smaller. The results are shown in Fig. 1, which is divided in four sets of plots, each one referring to a different model. In each set, composed by four panels, the dark-shaded area represents the uncertainty strip around the model LF. The dashed curve shows the bolometric LF of H06 along with uncertainty strip, plotted as a light-shaded area. In all plots the vertical, dashed line shows the minimum bolometric luminosity accessible to observations, , which turns out to be remarkably constant in the interval of redshifts considered. Model predictions extend up to a maximum luminosity resulting from having set an upper limit to the mass of our DM haloes ().
To quantify the consistency between models and data we have estimated the following -like quantity:
| (4) |
where and represent the model and observed mean comoving number density of AGNs in the luminosity interval at redshift , and are the logarithmic errors and the sum runs over the luminosity bins in the interval . We have verified that all our results are not sensitive to the choice of the bin size.
The values of , evaluated at all redshifts, are shown in Table 1 for all models explored. To compare these values with theoretical expectations, we use Monte Carlo techniques to compute distribution of , , expected when is a Gaussian random variable, normally distributed around with variance . This function is used to evaluate the cumulative probability of by integrating :
| (5) |
which is defined in analogy to the -probability and represents the probability that a function that genuinely describes the dataset would give a value larger or equal to . The values of are listed (in parentheses) in Table 1 and indicated in each plot.
The results confirm those of the M06 analysis, in the sense that all models, apart from E1 that significantly overpredicts the abundance of AGNs at , match the LFs in the range fairly well. The advantage of considering bolometric rather than B-band or hard X-ray LFs is apparent at lower redshifts where discrepancies between models and observations at the bright and faint ends of the luminosity functions are more significant here than in the M06 analysis. Indeed, all models overpredict the abundance of bright objects and underpredict the abundance of the faint ones at and .
In the LF bright end, the mismatch can be reduced by advocating some physical mechanism, like inefficient cooling, that hampers mass accretion in large haloes. Our simple model E2, in which mass accretion is inhibited in haloes with masses larger than , provides a better match to data, especially at , although the effect is less apparent here than in M06 which considered the optical B-band LF. The overabundance of bright AGNs is also alleviated in model H since the variable Eddington ratio guarantees that a BH hosted in the largest halos accretes most of the time at a sub-Eddington rate, resulting in a fainter AGN.
In all models, but E1, the LF faint end is biased low. The effect is systematic and, in the luminosity range accessible to observations, it does not depend on luminosity. Discrepancies grow larger when extrapolating the comparison below to objects fainter than , below which the LF predicted by most semi-analytic models turns-over while the model LF of H06 is fitted by a power-law. The power-law behaviour is, however, recovered by model H, that assumes a time-dependent Eddington ratio.
3.2 The hard X-ray luminosity function at
To understand whether the under-abundance of faint AGNs predicted by most semi-analytic models is real or a mere artifact resulting from having extrapolated the power-law behaviour of the bolometric LF of H06 below requires probing the AGN LF to lower luminosities, which is only possible in the nearby universe.
In this section we do not compare the model LFs with the bolometric LF at . Instead, we apply the inverse bolometric conversion of H06 to compare model predictions with the LFs of S06 and B06 at in the band. The rationale behind this choice is as follow. First of all, these two datasets, especially the B06 one, include objects that were not considered in the H06 analysis. Secondly, selection in the hard X-ray allows to include obscured AGNs which make bolometric corrections less severe in this band. Third, the two samples have rather similar composition as of the objects are Seyfert galaxies. As a result, comparing model with S06 and B06 LFs allows to maximize the number of nearby, homogeneous objects, while reducing uncertainties in model bolometric corrections.
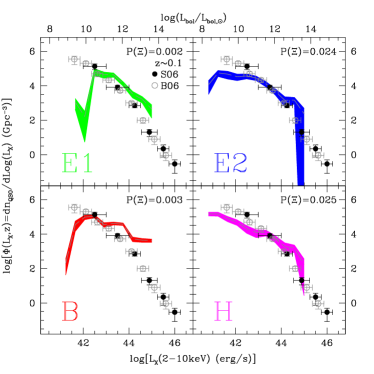
Model vs. data comparisons are shown in Fig. 2, where the S06 and B06 LFs are represented by filled and open dots, respectively. Vertical errorbars represent uncertainties, while horizontal bars indicate the size of the luminosity bins. The AGN luminosity in the B06 sample are measured in the band and transformed in the band according to (Beckmann et al., 2006).
The shaded areas show the model LFs at together with their uncertainties expressed in the band by using the bolometric correction of H06
| (6) |
with s, , and . The bolometric luminosities are indicated on the X-axis in the upper part of the plot. In order to correct for the extinction in the X-ray bands, we have used the following equation, also provided by H06:
| (7) |
where , and is the bolometric luminosity correspondent to , as given by the bolometric corrections of Eq. (6).
The comparison between model and data confirm our previous extrapolation, since the observed number density of faint AGNs with is significantly larger than that predicted by all models, as indicated by the sudden drop in the values of the at . This is due to the fact that, for a given value of , the distribution at redshifts is more positively skewed than at , as we have verified. Discrepancies are larger for models E1 and B, while models E2 and H provide a better match to the faint end of the local LF. The sharp downturn in the E1 and B models is a robust feature since the characteristic mass of halos populating the faint luminosity bins () is well above the mass resolution limit in our merger trees.
Note that the largest discrepancies are found in the faintest luminosity bin which can only be probed by the B06 sample. With this respect, it is worth noticing that Sazonov & Revnivtsev (2004) have used yet another dataset of hard X-ray selected AGNs to estimate the AGN LF down to . Their LF is consistent with those of S06 and B06 down to the faintest objects. The sample of Sazonov & Revnivtsev (2004) consists of 95 AGNs in the interval at high galactic latitude serendipitously detected in the RXTE slew survey. However, only of these AGNs are classified as Seyfert galaxies, many of which also belong to the S06 sample. Since in this work we prefer to deal with a homogeneous sample of local AGNs, we have decided not to consider the Sazonov & Revnivtsev (2004) LF in our quantitative analysis.
3.3 The biasing function
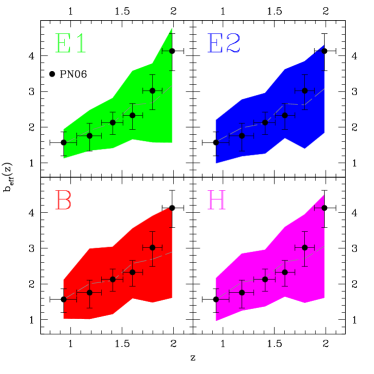
For the sake of completeness, we follow the M06 analysis and quantify the clustering of our model AGNs at through their biasing function, . The latter has been computed by weighting the analytic biasing function of the DM haloes provided by Sheth et al. (2001), , with the mass function of the haloes hosting AGNs with luminosities larger than the thresholds of the observations,:
| (8) |
where the minimum B luminosity at the 5 redshifts explored is . The difference with respect to the M06 analysis is that here we have used the bolometric correction of H06 to convert our bolometric luminosities to B-band ones, i.e. using the Eq. (6) with , , and , and the Eq. (7) with , . We have compared model predictions with the most recent observational determination of the biasing function at (Porciani & Norberg, 2006), estimated in the B-band.
The result is shown in Fig. 3, where the points represent the observed B-band AGN biasing function and the shaded areas show the uncertainty interval around model predictions. As in the M06 analysis, the large model uncertainties do not allow us to place strong constraint based on the AGN clustering. Indeed, all our models are in acceptable agreement with the data, suggesting, however, that possible disagreements may become significant at .
4 Discussion and conclusions
In this paper we tested the validity of the assumption that the evolution of AGNs is simply related to the cosmological merging history of DM haloes. To do that, we have compared the predictions of hierarchical semi-analytic models with the most recent determination of the AGN LF in the hard X-ray band and their biasing function in the B-band at . Our main results can be summarized as follows.
(i) We confirm the success of simple semi-analytic models in reproducing both the AGN bolometric LF at , i.e. around the peak of activity, and their clustering, quantified by the biasing function, at .
(ii) As pointed out by several previous analyses, problems occur at lower redshifts, where hierarchical models systematically overestimate the number density of bright AGNs and underestimate the faint ones.
(iii) Comparing bolometric LFs rather than the optical or hard X-rays ones allows to spot significant discrepancies already at moderate redshifts , i.e. earlier than what was found in previous analyses (e.g. M06).
(iv) The predicted number density of bright AGNs can be reduced not only by advocating inefficient cooling within massive haloes, as in model E2, but also by accounting for feedback mechanisms, as we did in model H.
(v) The underestimate of faint AGNs looks like a more serious problem that we have tried to tackle by assuming a time-dependent Eddington ratio, as suggested by the outcome of the hydrodynamical simulations by Hopkins et al. (2005). As shown by Volonteri et al. (2006), implementing this prescription within a semi-analytic framework, as we did in model H, proved to be successful in reproducing the redshift distribution of the faint X-ray counts (Volonteri et al., 2006). In this work, we extended the analysis of Volonteri et al. (2006) by comparing model predictions with the most recent determinations of the local AGN LF by S06 and B06 in the hard X-ray band, to include absorbed AGNs and minimize the impact of bolometric corrections. This is a very demanding test for semi-analytic models, which constitutes the main focus of this paper since, as we have pointed out, the mismatch in the number density of faint AGNs grows larger when decreasing the redshift. We found that the two most successful models E2 and H are in acceptable agreement with the data at , but struggle to match the correct number density of faint X-ray sources in the nearby universe.
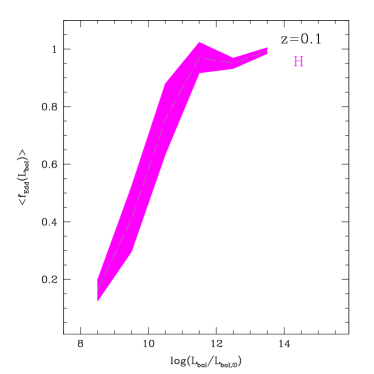
Model H, based on the results of hydrodynamical simulations of Hopkins et al. (2005) within a pure merger driven scenario, seems unable to account for local faint AGNs. If the accretion efficiency were much lower, the lifetime of faint AGNs would increase proportionally and help alleviate the discrepancy. However, the Eddington factors derived from Hopkins et al. (2005) light curve are well below only when a galaxy hosts a black hole with an initial mass anomalously smaller than that predicted by the correlation. This is evident in Figure 4: our models assume that accretion processes bring the black holes onto the relation and the accretion efficiency is for most systems above . This can be understood using a very simple argument. Let us assume that (i) quiescent black holes sit on the relation, as observed in the nearby galaxy where the relation was indeed derived. This is therefore a safe assumption in the local Universe. (ii) Accretion is triggered only by major mergers, that is mergers between similar size galaxies, with a mass-ratio larger than at least 0.1 (Cox, 2004). And, (iii) an accretion episode grows black holes until they reach the relation for the newly formed galaxy, due to feedback effect. Studies of local samples of AGN seem indeed to confirm that typically AGN masses scale with the relation (e.g., Ferrarese et al., 2001; Greene & Ho, 2006). Within these simple but sensible assumptions, the accretion efficiency is bound to be high, as can be easily estimated by equation 3. If we consider, for example, a major merger of a Milky-Way sized galaxy, the Eddington factor of the black holes remains for only about yr.
The inadequacy of the pure merger driven scenario becomes more evident when considering the observational constraints on the Eddington factor of Seyfert galaxies, which constitute about of the local AGN population. Woo & Urry (2002) analyze a sample of 234 AGNs at , composed, at mainly by Seyfert galaxies. They find a large scatter (2 orders of magnitude) in the Eddington factor at both fixed luminosity and fixed BH mass. Woo & Urry (2002) do not find any trends of the Eddington factor with either luminosity, mass or redshift, which cannot be explained by selection effects.
It turns out that the S06 and B06 catalogues are largely composed by Seyfert galaxies that constitute respectively and of the total galaxy host populations. Only a small fraction of these local Seyfert galaxies have disturbed morphology, and thus did not experience any recent merging event. Indeed, only of the sources in the S06 catalog are hosted in galaxies that show evidences of recent interactions. The AGNs in the B06 catalogue are typically found at low galactic latitudes which hamper a systematic analysis of their host galaxy morphology. Yet, the similar galaxy composition of the two catalogues suggests that also B06 AGNs preferentially populate quiescent environments. Based on this observational evidence, it may be suggested that galaxy mergers might not constitute the only trigger to AGN activity.
To decide whether this is indeed a viable hypothesis, it is worth reviewing the observational evidences of local AGN samples. Bright, low-redshift quasars and ultra luminous infrared galaxies, that are generally regarded as hosting obscured AGNs, are often found in merging systems (see, e.g. Sanders & Mirabel, 1996; Canalizo & Stockton, 2001; Capetti & Balmaverde, 2006, and references therein) which indicates a possible connection between mergers of gas-rich galaxy and AGN activity. On the contrary, as we have seen, fainter AGNs typically reside in quiescent, non-interacting galaxies (e.g. Kauffmann et al., 2003; Grogin et al., 2005, and references therein). However, this alone does not guarantee that an alternative AGN triggering mechanism is at work, as this observational evidence can still fit into a merger-driven scenario. In fact, the brightest among these objects could be the relics of a previous bright quasar epoch in a spheroid-forming merger (see, e.g. Hopkins et al., 2006, and references therein), while the fainter ones would consist of AGNs hosted in “dead” elliptical galaxies fueled via accretion of hot spheroid gas and steady mass loss from stars (see, e.g. Ciotti & Ostriker, 2001; Sazonov et al., 2005; Croton et al., 2006), an accretion mode which cannot dominate the BH growth.
The merger-driven scenario, however, proved to be inadequate in accounting for the relatively high accretion rate AGNs observed at low redshifts in undisturbed, late-type, star-forming galaxies with low mass () BHs (e.g. Kauffmann et al., 2003). Indeed alternative mechanisms, not included in our simple models, have been suggested to trigger the mass accretion in these objects. For instance, it has been proposed that a significant contribution to the faint AGN mass accretion could come from the material liberated by the tidal disruption of stars by the central BHs (Milosavljevic et al., 2006), or by the mass of the stars captured by the BH disks and eventually dissolved (Miralda-Escudé & Kollmeier, 2005). Other studies have considered the stochastic accretion of molecular clouds in quiescent systems (see e.g. Hopkins & Hernquist, 2006; Croton et al., 2006). Moreover, it was suggested that also disk instability could trigger mass accretion, contributing to increase even more the number density of faint AGNs (see e.g. Croton et al., 2006; Bower et al., 2006). Finally, a better treatment of mergers between haloes with low mass ratio may also contribute to solve these problems (see e.g. Malbon et al., 2006; Croton et al., 2006).
Whether including these alternative trigger mechanisms in our simple merger-driven scenario can help in reconciling model predictions with observations at is a question that deserves further investigation.
Acknowledgements
FM thanks the Institute of Astronomy, University of Cambridge, for the kind hospitality. This work has been partially supported by ASI and INAF. We would also like to thank the anonymous referee for very useful comments.
References
- Beckmann et al. (2006) Beckmann V., Soldi S., Shrader C. R., Gehrels N., Produit N., 2006, preprint, astro-ph/0606687, [B06]
- Bond et al. (1991) Bond J. R., Cole S., Efstathiou G., Kaiser N., 1991, ApJ, 379, 440
- Bondi & Hoyle (1944) Bondi H., Hoyle F., 1944, MNRAS, 104, 273
- Bower et al. (2006) Bower R. G., et al., 2006, MNRAS, pp 659–+
- Brown et al. (2006) Brown M. J. I., et al., 2006, ApJ, 638, 88
- Canalizo & Stockton (2001) Canalizo G., Stockton A., 2001, ApJ, 555, 719
- Capetti & Balmaverde (2006) Capetti A., Balmaverde B., 2006, A&A, 453, 27
- Cattaneo (2001) Cattaneo A., 2001, MNRAS, 324, 128
- Cattaneo et al. (2005) Cattaneo A., Blaizot J., Devriendt J., Guiderdoni B., 2005, MNRAS, 364, 407
- Cattaneo et al. (2006) Cattaneo A., Dekel A., Devriendt J., Guiderdoni B., Blaizot J., 2006, MNRAS, 370, 1651
- Cattaneo et al. (1999) Cattaneo A., Haehnelt M. G., Rees M. J., 1999, MNRAS, 308, 77
- Cavaliere & Vittorini (2000) Cavaliere A., Vittorini V., 2000, ApJ, 543, 599
- Cavaliere & Vittorini (2002) Cavaliere A., Vittorini V., 2002, ApJ, 570, 114
- Ciotti & Ostriker (2001) Ciotti L., Ostriker J. P., 2001, ApJ, 551, 131
- Cox (2004) Cox T. J., 2004, Ph.D. Thesis
- Croom et al. (2005) Croom S. M., et al., 2005, MNRAS, 356, 415
- Croton et al. (2006) Croton D. J., et al., 2006, MNRAS, 365, 11
- Di Matteo et al. (2005) Di Matteo T., Springel V., Hernquist L., 2005, Nat, 433, 604
- Efstathiou & Rees (1988) Efstathiou G., Rees M. J., 1988, MNRAS, 230, 5P
- Elvis et al. (1994) Elvis M., Wilkes B. J., McDowell J. C., Green R. F., Bechtold J., Willner S. P., Oey M. S., Polomski E., Cutri R., 1994, ApJS, 95, 1
- Enoki et al. (2003) Enoki M., Nagashima M., Gouda N., 2003, PASJ, 55, 133
- Ferrarese (2002) Ferrarese L., 2002, ApJ, 578, 90
- Ferrarese & Merritt (2000) Ferrarese L., Merritt D., 2000, ApJ, 539, L9
- Ferrarese et al. (2001) Ferrarese L., Pogge R. W., Peterson B. M., Merritt D., Wandel A., Joseph C. L., 2001, ApJ, 555, L79
- Gebhardt et al. (2000) Gebhardt K., et al., 2000, ApJ, 539, L13
- Grazian et al. (2000) Grazian A., Cristiani S., D’Odorico V., Omizzolo A., Pizzella A., 2000, AJ, 119, 2540
- Greene & Ho (2006) Greene J. E., Ho L. C., 2006, ApJ, 641, L21
- Grogin et al. (2005) Grogin N. A., et al., 2005, ApJ, 627, L97
- Haehnelt & Rees (1993) Haehnelt M. G., Rees M. J., 1993, MNRAS, 263, 168
- Haiman & Loeb (1998) Haiman Z., Loeb A., 1998, ApJ, 503, 505
- Haiman & Menou (2000) Haiman Z., Menou K., 2000, ApJ, 531, 42
- Hasinger et al. (2005) Hasinger G., Miyaji T., Schmidt M., 2005, A&A, 441, 417
- Hatziminaoglou et al. (2003) Hatziminaoglou E., Mathez G., Solanes J.-M., Manrique A., Salvador-Solé E., 2003, MNRAS, 343, 692
- Hatziminaoglou et al. (2001) Hatziminaoglou E., Siemiginowska A., Elvis M., 2001, ApJ, 547, 90
- Hopkins & Hernquist (2006) Hopkins P. F., Hernquist L., 2006, ApJS, 166, 1
- Hopkins et al. (2006) Hopkins P. F., Hernquist L., Cox T. J., Robertson B., Di Matteo T., Springel V., 2006, ApJ, 639, 700
- Hopkins et al. (2005) Hopkins P. F., Hernquist L., Martini P., Cox T. J., Robertson B., Di Matteo T., Springel V., 2005, ApJ, 625, L71
- Hopkins et al. (2006) Hopkins P. F., Richards G. T., Hernquist L., 2006, preprint, astro-ph/0605678, [H06]
- Kang et al. (2006) Kang X., Jing Y. P., Silk J., 2006, ApJ, 648, 820
- Kauffmann & Haehnelt (2000) Kauffmann G., Haehnelt M., 2000, MNRAS, 311, 576
- Kauffmann et al. (2003) Kauffmann G., Heckman T. M., Tremonti C., Brinchmann J., Charlot S., White S. D. M., Ridgway S. E., Brinkmann J., Fukugita M., Hall P. B., Ivezić Ž., Richards G. T., Schneider D. P., 2003, MNRAS, 346, 1055
- Koehler et al. (1997) Koehler T., Groote D., Reimers D., Wisotzki L., 1997, A&A, 325, 502
- La Franca et al. (2005) La Franca F., et al., 2005, ApJ, 635, 864
- Lacey & Cole (1993) Lacey C., Cole S., 1993, MNRAS, 262, 627
- Magorrian et al. (1998) Magorrian J., et al., 1998, AJ, 115, 2285
- Malbon et al. (2006) Malbon R. K., Baugh C. M., Frenk C. S., Lacey C. G., 2006, preprint, astro-ph/0607424
- Marconi et al. (2004) Marconi A., Risaliti G., Gilli R., Hunt L. K., Maiolino R., Salvati M., 2004, MNRAS, 351, 169
- Martini & Weinberg (2001) Martini P., Weinberg D. H., 2001, ApJ, 547, 12
- Marulli et al. (2006) Marulli F., Crociani D., Volonteri M., Branchini E., Moscardini L., 2006, MNRAS, 368, 1269, [M06]
- Matute et al. (2006) Matute I., La Franca F., Pozzi F., Gruppioni C., Lari C., Zamorani G., 2006, A&A, 451, 443
- Milosavljevic et al. (2006) Milosavljevic M., Merritt D., Ho L. C., 2006, preprint, astro-ph/0602289
- Miralda-Escudé & Kollmeier (2005) Miralda-Escudé J., Kollmeier J. A., 2005, ApJ, 619, 30
- Miyaji et al. (2001) Miyaji T., Hasinger G., Schmidt M., 2001, A&A, 369, 49
- Nagar et al. (2005) Nagar N. M., Falcke H., Wilson A. S., 2005, A&A, 435, 521
- Percival & Miller (1999) Percival W., Miller L., 1999, MNRAS, 309, 823
- Porciani & Norberg (2006) Porciani C., Norberg P., 2006, MNRAS, 371, 1824, [PN06]
- Richards et al. (2005) Richards G. T., et al., 2005, MNRAS, 360, 839
- Richards et al. (2006) Richards G. T., et al., 2006, AJ, 131, 2766
- Sanders & Mirabel (1996) Sanders D. B., Mirabel I. F., 1996, ARA&A, 34, 749
- Sazonov et al. (2005) Sazonov S. Y., Ostriker J. P., Ciotti L., Sunyaev R. A., 2005, MNRAS, 358, 168
- Sazonov & Revnivtsev (2004) Sazonov S. Y., Revnivtsev M. G., 2004, A&A, 423, 469
- Sheth et al. (2001) Sheth R. K., Mo H. J., Tormen G., 2001, MNRAS, 323, 1
- Sheth & Tormen (1999) Sheth R. K., Tormen G., 1999, MNRAS, 308, 119
- Shinozaki et al. (2006) Shinozaki K., Miyaji T., Ishisaki Y., Ueda Y., Ogasaka Y., 2006, AJ, 131, 2843, [S06]
- Siana et al. (2006) Siana B., et al., 2006, preprint, astro-ph/0604373
- Springel et al. (2005) Springel V., Di Matteo T., Hernquist L., 2005, MNRAS, 361, 776
- Springel et al. (2005) Springel V., et al., 2005, Nat, 435, 629
- Taffoni et al. (2003) Taffoni G., Mayer L., Colpi M., Governato F., 2003, MNRAS, 341, 434
- Tremaine et al. (2002) Tremaine S., et al., 2002, ApJ, 574, 740
- Ueda et al. (2003) Ueda Y., Akiyama M., Ohta K., Miyaji T., 2003, ApJ, 598, 886
- Volonteri et al. (2003) Volonteri M., Haardt F., Madau P., 2003, ApJ, 582, 559
- Volonteri et al. (2005) Volonteri M., Madau P., Quataert E., Rees M. J., 2005, ApJ, 620, 69
- Volonteri & Rees (2005) Volonteri M., Rees M. J., 2005, ApJ, 633, 624
- Volonteri & Rees (2006) Volonteri M., Rees M. J., 2006, preprint, astro-ph/0607093
- Volonteri et al. (2006) Volonteri M., Salvaterra R., Haardt F., 2006, preprint, astro-ph/0606675
- Woo & Urry (2002) Woo J.-H., Urry C. M., 2002, ApJ, 579, 530
- Wyithe & Loeb (2002) Wyithe J. S. B., Loeb A., 2002, ApJ, 581, 886
- Wyithe & Loeb (2003) Wyithe J. S. B., Loeb A., 2003, ApJ, 595, 614
- Wyithe & Loeb (2005) Wyithe J. S. B., Loeb A., 2005, ApJ, 621, 95