Observing CMB polarisation through ice
Abstract
Ice crystal clouds in the upper troposphere can generate polarisation signals at the K level. This signal can seriously affect very sensitive ground based searches for E- and B-mode of Cosmic Microwave Background polarisation. In this paper we estimate this effect within the CℓOVER experiment observing bands (97, 150 and 220 GHz) for the selected observing site (Llano de Chajnantor, Atacama desert, Chile). The results show that the polarisation signal from the clouds can be of the order of or even bigger than the CMB expected polarisation. Climatological data suggest that this signal is fairly constant over the whole year in Antarctica. On the other hand the stronger seasonal variability in Atacama allows for a 50% of clean observations during the dry season.
keywords:
Cosmic microwave background, cosmology: observations, techniques: polarimetric, atmospheric effects1 Introduction
CℓOVER (CℓObserVER) is a collaboration between the Cardiff Astronomy Instrumentation Group, Oxford Astrophysics, Manchester Astrophysics and the Cavendish Astrophysics Group in Cambridge, on an experiment to measure the Cosmic Microwave Background (CMB) polarisation (Maffei et al., 2004).
Polarisation of the CMB is caused by Thomson scattering of CMB photons at the last scattering surface (Hu &White, 1997). The signal can be decomposed into a curl and a curl-free component, known as B- and E-mode. The B-mode signal, which is at best one order of magnitude weaker than the E-mode, is generated by primordial tensor perturbations and therefore its detection would provide valuable information about the history of the early universe.
The main ambitious objective of CℓOVER is the measurement of the B-mode; in order to achieve this result the experiment will deploy large format imaging arrays, operating at 97, 150 and 220 GHz with 30% bandwidth and a beamwidth of approximately 8 arcmin; the instrument is designed with an unprecedented level of systematic control and will be deployed in the Atacama desert (Chile) at an altitude of 5080 m. Alternative sites are the Antarctic stations of Dome C and South Pole.
In spite of a site choice with favorable atmospheric conditions we expect the signal of the atmospheric fluctuations to be well above the intrinsic instrumental noise.
Since the CℓOVER receiver modulates signal polarisation, the main concern about atmospheric effects is about a potentially polarised signal from the atmosphere. Water vapor is the major absorbing component at mm wavelengths and its spatial distribution is highly variable with time.
These variations could also introduce some polarisation noise; in situ measurements of the turbulence suggest that this polarised contribution to system noise is expected to be gaussian and negligible during most of the observing time, even in Atacama which should be the worst of the three sites, both because of the stronger day-night thermal cycle and the height of the mean boundary layer that can be from 200 to 2000 meters (Giovannelli et al., 2001), with respect to 230 m in South Pole and 30 m in Dome C (Agabi et al., 2006) during winter.
In addition to the variable contribution by water vapor, the strong oxygen features at 120 GHz and around 60 GHz dominate the brightness temperature of the atmosphere in CℓOVER’s spectral region. The presence of the Earth’s magnetic field causes a Zeeman splitting of the energy levels of the oxygen, thus resulting in a polarised emission depending on the relative alignment between the line of sight and the magnetic field. This effect is well known for atmospheric measurements (see von Engeln et al. (1998), and references cited therein). Keating et al. (1998) discussed its impact on CMB measurements. Hanany & Rosenkranz (2003) estimated that the circularly-polarised component is not negligible if the intrinsic leakage between linear and circular polarisation in the instrument will be of the order of one per cent.
However, the polarised intensity due to oxygen is not expected to vary with time but is be fixed for a particular azimuth and elevation direction. Hence any scanning strategy will modulate any residual atmospheric signal in a very predictable way. Also, the estimates are for the DC level of the signal. Oxygen is well mixed in the atmosphere at altitudes up to approximately 80 km, hence fluctuations in the oxygen signal on the angular scales to which CℓOVER is sensitive will be very small. It should therefore be possible to separate this signal from the CMB polarisation well down below the sensitivity required.
Upper tropospheric ice clouds (like cirrus clouds) represent another source of polarised radiation. These clouds are at high altitudes and contribute to the energy budget of the atmosphere (greenhouse effect) since they absorb thermal IR radiation from the ground and, as they are cold, emit little infrared radiation. This warms up the Earth-atmosphere system. On the other hand, ice clouds reflect incoming solar short wave radiation and hence cool the Earth-atmosphere system.
At mm and sub-mm wavelengths the interaction between ice clouds and radiation is mainly due to scattering. Absorption is negligible, and so is the thermal emission. The scattering by ice clouds will introduce a polarisation signal. Teichmann et al. (2006) have shown that this polarisation signal arises even assuming spherical ice particles, due to the asymmetry of the radiation field in the atmosphere. However, real cloud ice particles are not spherical (Wallace, & Hobbs, 1977), and this increases the polarisation signal. Moreover, there is a growing evidence of horizontal alignment of cloud ice particles due to a combination of aerodynamic and gravitational forces (Prigent et al., 2005), which further increases the polarisation signal. The actual magnitude of the cloud polarisation signal will depend strongly on the particle size and shape, and on the line of sight direction.
Experimentally, ice crystal depolarisation is a well-known problem for high frequencies satellite telecommunications (2050 GHz) based on signal polarisation diversity encoding (Martellucci et al., 2002). Measurements carried out with experimental telecommunication payloads (ITALSAT and OLYMPUS) showed that even at relatively low frequencies (with respect to CℓOVER bands) the depolarising effect of ice crystals is not negligible (Trione, 2003).
For CMB measurements, the impact of the cloud scattering is twofold. Firstly, the CMB signal is depolarised, similarly to a telecommunication signal. Secondly, the cloud also scatters back upwelling thermal radiation from the earth surface into the line of sight of the instrument. For telecommunication links this second effect is negligible, due to the large intensity of the telecommunication signal. But for CMB measurements the radiation scattered back by the atmosphere will often be more intense than the CMB signal. The backscattered signal will be partially polarised, and its polarisation characteristics will depend on many factors, as will be explained in the following sections.
| Site name | Latitude (∘) | Longitude (∘) | Height (m) |
|---|---|---|---|
| Atacama | 23 S | 67 W | 5080 |
| Dome C | 75 S | 123 E | 3280 |
| South Pole | 90 S | - | 2900 |
2 Ice in the upper troposphere
for the three sites
Although ice clouds play an important role in the atmosphere energy budget, up to now they are poorly measured and modeled.
Satellites provide global measurements of integrated ice mass (Ice Water Path - IWP) with frequent revisit time on a long term basis. Sensors detect both reflected sunlight (in the UV and visible, Buriez et al. (1997)) and thermal emission. While the last method is limited to semitransparent clouds the first one only works if the earth surface albedo is not too high (which, unfortunately, is exactly the case for Atacama desert and Antarctica).
The MODIS instrument carried by the Terra and Aqua EOS-NASA satellites is equipped with a cirrus clouds detection band at 1.38 m; the method, first suggested by Gao et al. (1993) for airborne measurements, suffers the same drawback since it assumes that upwelling radiation reflected by the earth surface is strongly absorbed by water vapor in the lower troposphere and therefore the method is not effective when water vapor column density is very low (i.e. 4 kg/m2 corresponding to 4 mm precipitable water vapor, PWV).
The next generation satellite or air-borne instrument will characterize ice clouds by measuring from above the radiation brightness temperature depression with imaging radiometers in the mm and sub-mm range, as proposed by Buehler et al. (2005a) and Evans et al. (2002) and will include also polarisation measurements (Hayton et al., 2003). In situ and aircraft-borne experiments provide the most accurate information on ice clouds. Dual polarisation radars (30-90 GHz), polarisation diversity lidars and airplanes equipped with cameras are used to characterize ice density, crystal shapes, orientation and size distribution.
As mentioned above, there is evidence that ice needles and plates (especially those with large size and aspect ratio) have a preferred orientation. As crystals drift downwards, they become oriented in a maximum drag condition: aerodynamic forces tend to cause their long axis (or axes) to fall horizontally (i.e. the shortest axis is perpendicular to the ground; see Evans et al. (1998) and references therein for both models and some experimental results). Such a good orientation is testified also by the relatively frequent presence of optical effects, such as sun haloes, which happens only if the crystal are aligned within few degrees. More recently, Noel & Sassen (2005) derived this result from polarised lidar backscatter measurements. Noel & Chepfer (2004) analysed polarised visible light measurements from the POLDER satellite, and found that 50% of high clouds show a glint signature implying at least a fraction of the ice platelets to be horizontally aligned (within a very narrow angle). Davis et al. (2005) showed that cloud ice crystals generate a polarisation signal in the limb measurements at 122 GHz (carried out by the Microwave Limb Sounder (MLS) on the Aura satellite). They also concluded that the effective particle shape can be approximated by a horizontally oriented oblate spheroid with an aspect ratio of 1.3. This rather moderate value of the effective asphericity is due to the fact that, while there are individual particles with large aspect ratios, there is also an averaging effect over the different sizes, shapes and orientations of the individual ice particles.
The purpose of this paper is to estimate the influence of cloud ice particles on the CℓOVER measurements at the selected and at the two backup sites (Table 1). For this purpose assumptions are made on the range of cloud ice amount to be expected for the different sites, as well as on the ice particles size, shape, and orientation.
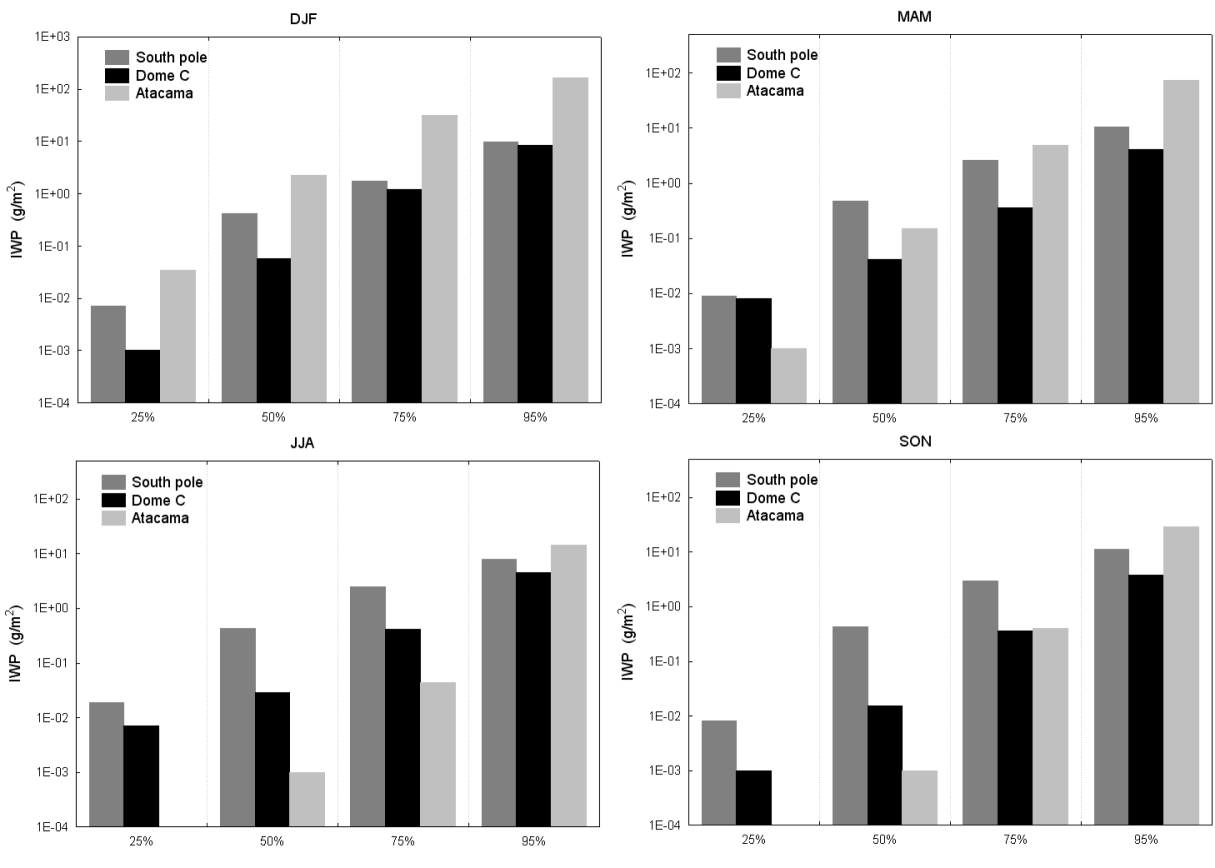
We used the general circulation model of the European Centre for Medium Range Weather Forecasting (ECMWF, see Uppala et al. (2005)) to estimate the statistics of cloud ice mass. Figure 1 shows the statistics in the form of percentiles. It shows for example that Atacama, though generally a very dry place, can have ice clouds exceeding an Ice Water Path (i.e. ice column density, IWP hereafter) of 100 g/m2 for about 10% of the time from December to May. These statistics were derived from a three years long (2000 to 2002) data set obtained with a gridded version of the ECMWF model data with a grid resolution of by . A longer data set is still under analysis, however we believe that the period considered is quite significant since it was not affected by climatic extremes (such as El Ni o events in South America).
As expected, Atacama shows a much stronger seasonal variability than Antarctica, in the driest season IWP is often (25% of time) 0.0001 g/m2. Since this is the selected site for CℓOVER experiment, we evaluated the polarised signal from ice crystals using a standard atmospheric profile for these latitudes, re-scaled in accordance with locally measured water vapor values (1 mm PWV, i.e. 1 kg/m2).
The impact on CMB polarisation measurements will be discussed for a wide range of IWP values from 0.0001 g/m2 to 100 g/m2.
3 Scattering model
There are no direct data available for particle size, shape and orientation. A realistic size distribution based on literature was adopted. Ice crystals were assumed to be hexagonal columns, for IWP 1 g/m2 (Ivanova et al., 2001) and compact polycrystals for IWP 1 g/m2 (Donovan, 2003). All particles were horizontally aligned with random azimuthal orientation. The equal-volume-ellipsoid aspect ratio of the particles is assumed to be 1.3.
The radiative transfer (RT) model used for this study is able to handle also even more realistic cases, but for this first assessment it was decided to keep the assumptions as simple as possible for clarity.
The RT model used was the Atmospheric Radiative Transfer Simulator (ARTS). The basics of the model are described by Buehler et al. (2005a). Here we used version ARTS-1-1-1095, which can simulate the scattering of radiation by cloud particles (Eriksson et al., 2005). ARTS offers two different scattering algorithms: a Monte Carlo algorithm and an iterative discrete ordinate algorithm (DOIT). In this work we used the DOIT algorithm, which is described in detail by Emde et al. (2004).
The clear-sky part of ARTS has been compared against a range of other microwave radiative transfer models (Melsheimer, 2005) and against co-located AMSU data and radiosonde profiles (Buehler et al., 2004). The scattering part of ARTS has been compared against several other scattering models (Emde, 2005; Hoepfner & Emde, 2005), against co-located AMSU data and mesoscale weather prediction model fields (Sreerekha et al., 2005).
ARTS can handle all four Stokes components. However, the azimuthally symmetric geometry in this case implies that only I and Q Stokes components are non-zero. The component I represents the total intensity (sum of horizontally and vertically polarised intensities), the component Q represents the linear polarisation difference.
| Frequency | Zenith angle | Zenith angle | Zenith angle | |||
| (GHz) | 5∘ | 25∘ | 45∘ | |||
| Qtotal | QCMB | Qtotal | QCMB | Qtotal | QCMB | |
| 97 | 7.3 | 3.1 | 96 | 48 | 330 | 190 |
| 150 | 18 | 8.5 | 240 | 125 | 790 | 370 |
| 220 | 40 | 20 | 520 | 260 | 1700 | 850 |
4 Results
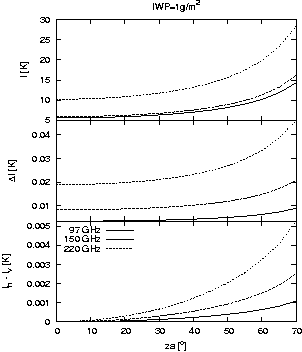
Figure 2 shows the ARTS simulation results. The sensor was assumed to be at an altitude of 5080 m. The cloud was assumed to be located at an altitude of 9000-11000 m. Each of the plots includes three curves corresponding to the central frequencies of the CℓOVER bands. The assumed IWP value is IWP = 1 g/m2. The different rows show the simulated radiance (top row), the radiance difference (i.e. difference between the radiance from the cloud and the clear sky, middle row) and the polarisation difference (Stokes component Q, bottom row). All signals are shown as a function of the instrument angle relative to the zenith direction. The polarisation signal is zero at the zenith, and increases with zenith angle.
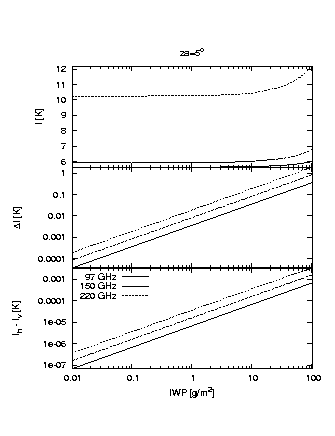
Both the radiance difference and the polarisation signal increase with the IWP. This is shown more clearly in Figure 3, where the simulated radiance, the radiance difference and the polarisation difference are plotted as a function of IWP for a zenith angle of 5∘. The figure covers values of IWP ranging from 0.01 to 100 g/m2. Note that the radiative transfer is in the linear regime at these frequencies for reasonable IWP values. (Note the logarithmic x-scale of the plots).
5 Effect on observed CMB polarisation
The results of the calculations using ARTS show the expected polarisation signal induced by the ice clouds. The signal represents the difference between a cloudy and clear sky. Cloud parameters are derived from climatological data.
This signal is divided into two components:
-
1.
upwelling radiation, emitted by ground and lower atmosphere, that is back-scattered and polarised by the ice crystal clouds;
-
2.
CMB radiation that is forward-scattered by the ice with a variation in its polarisation (ARTS model assumes that CMB radiation is unpolarised).
In order to disentangle the two components, we run the ARTS model alternately imposing Tground and TCMB equal to 0 ∘K. Table 2 shows the polarisation signal per unit IWP, which is applicable in the linear regime (at least up to 100 g/m2).
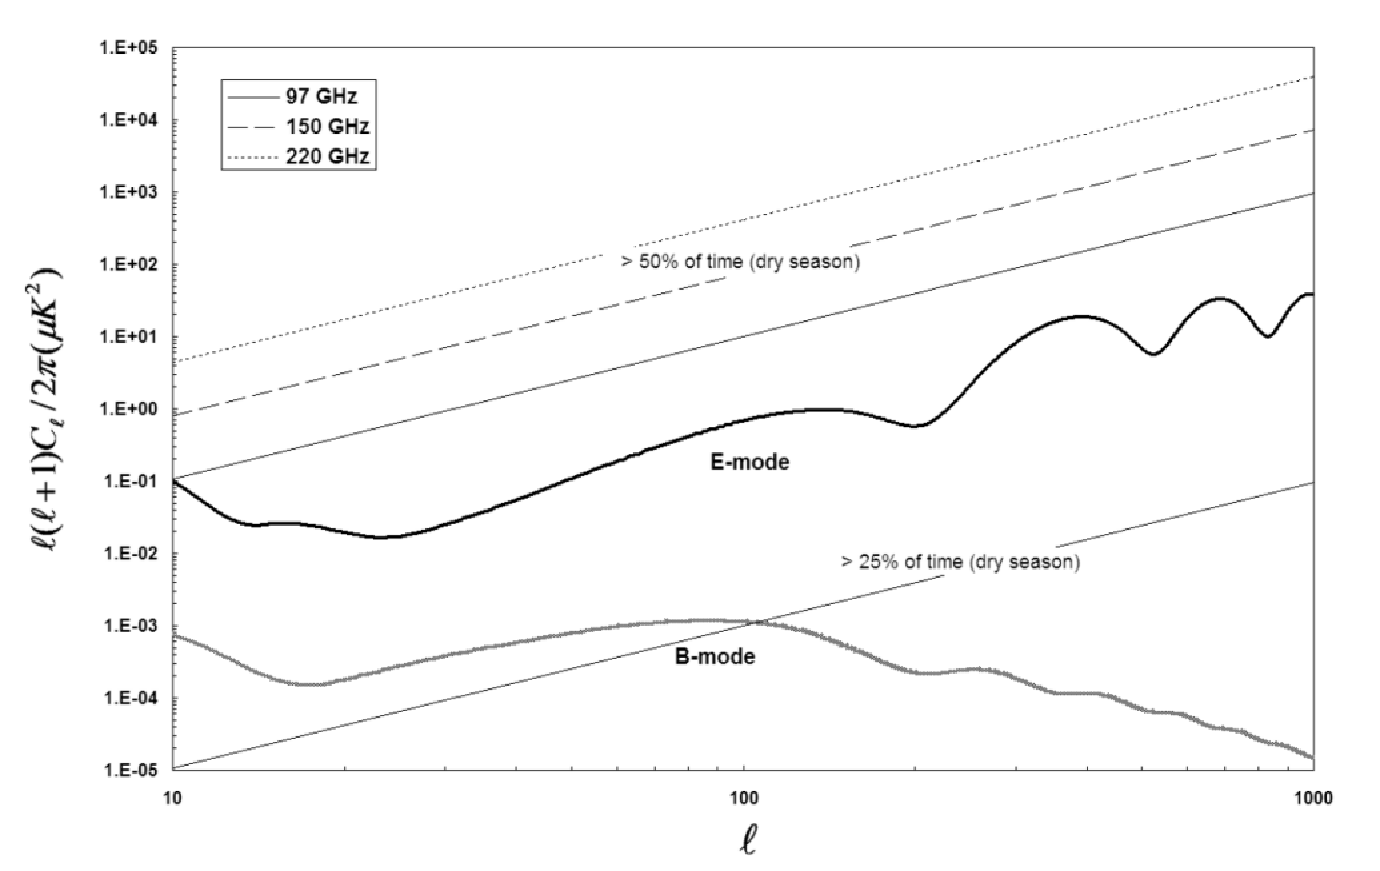
In order to compare the ice crystal induced polarization with the expected cosmological signal, we generated the angular power spectrum of the CMB polarisation (both E-mode and B-mode) in an ACDM (Adiabatic Cold Dark Matter) cosmology scenario with tensor to scalar ratio r = 0.01 (using CMBFAST code, see Seljak & Zaldarriaga (1996)).
Figure 4 reports the expected CMB polarisation signal power spectrum in terms of the spherical harmonic coefficient . The range is limited to spatial scales which are relevant for CℓOVER experiment: between 10∘ and 10 arcmin ( ranging from 20 to 1000).
The polarisation signal on CMB radiation due to ice crystals is plotted for each CℓOVER frequency, assuming an observing zenith angle of 5∘ and IWP values corresponding to an upper limit for respectively 50% and 25% of observing time during dry season.
In the figure we arbitrarily assumed a flat power spectrum for the observed signal from ice crystal clouds; it has to be underlined that this model is really inadequate and a more realistic representation should take into account the cirrus cloud morphology and spatial distribution which unfortunately are very poorly known. Qualitatively, a decrease at the high is expected, since the clouds are supposed to be quite homogeneous at these angular scales, but, in any case, the signal could still be orders of magnitude stronger that the expected B-mode component during a significant fraction of the observing time.
6 Conclusions
The polarisation signal on CMB radiation due to ice crystal clouds cannot be neglected by a ground based experiment looking for mapping E- and B-mode patterns even for low ice water column density values (0.001 g/m2). The effect is particularly strong for the high frequencies commonly used for CMB measurements (150 GHz and above).
Possible mitigation strategies include:
-
1.
constant elevation fast instrument scanning: at the moment CℓOVER is designed to internally modulate the CMB polarisation signal and therefore an absolute measurement of this parameter (i.e. for each pixel) would be possible. A differential approach, based on rapidly measurement of signal differences between contiguous pixels would cancel the constant bias due to ice crystals clouds. However, the measurement would still be affected by the cloud spatial distribution and inhomogeneities;
-
2.
Ice Water Path could be measured by processing Earth Observing (EO) satellite data. In principle geo-stationary satellites near real-time monitoring capabilities (one measurement every 15-30 minutes). However, as discussed above (para. 2), very low tropospheric water vapor content (both in Atacama and in Antarctica) seriously undermine this measurement. Future EO mission dedicated to ice cloud measurements will be helpful for solving this problem;
-
3.
IWP in situ measurements can be carried out in order to assess the quality of measured polarisation, and to characterize, during clean nights, a set of reference pixels to be used for ice detection. Among the possible options, the use of a polarised lidar, though difficult to deploy and operate, would provide us with a full characterization of ice crystals (shape, size distribution and orientation) allowing an accurate modelling of radiative effects in the microwaves.
In this difficult observational context, a preliminary comparison between the sites can be attempted. The presence of the sun at high elevation angles penalizes Atacama with respect to Antarctica sites; however, due to the high sensitivities required for CMB polarisation measurements, it is in any case difficult to carry out measurements with the sun above the horizon (strong signal in the instrument sidelobes). On the other hand climatological data on ice cloud occurrence and density suggest that Atacama observing conditions during dry seasons are significantly better than Antarctica (with frequent occurrences of IWP 0.0001 g/m2)
Acknowledgments
Thanks to the ARTS radiative transfer community, many of whom have indirectly contributed by implementing features to the ARTS model.
References
- Agabi et al. (2006) Agabi, A., Aristidi E., Azouit M., Fossat E., Martin F., Sadibekova T.,Vernin J.,Ziad A., 2006, PASP, 118, 840,344-348
- Buehler et al. (2004) Buehler, S. A., Kuvatov M., John V. O., Leiterer U. and Dier H., 2004, J. Geophys. Res., 109, D13103, doi:10.1029/2004JD004605
- Buehler et al. (2005a) Buehler, S. A., Eriksson P., Kuhn T., von Engeln A. and Verdes C., 2005a, J. Quant. Spectrosc. Radiat. Transfer, 91(1), 65-93, 2005, doi:10.1016/j.jqsrt.2004.05.051. The ARTS model is publicly available at the website http://www.sat.uni-bremen.de/arts/
- Buriez et al. (1997) Buriez J. C., Vanbauce C., Parol F., Goloub P., Herman M., Bonnel B., Fouquart Y., Couvert P., Seze G., 1997 Int. J. Remote Sensing, 18, 13, 2785-2813
- Davis et al. (2005) Davis C. P., Wu D. L., Emde C., Jiang J. H., Cofield R. E. and Harwood R. S., 2005, Geophys. Res. Lett., 32, L14806, doi:10.1029/2005GL022681
- Donovan (2003) Donovan D.P., 2003, J. Geophys. Res., 108, NO. D18, 4573
- Emde (2005) Emde, C., 2005, PhD Thesis, University of Bremen, ISBN 3-8325-0885-4
- Emde et al. (2004) Emde, C., Buehler S. A., Davis C., Eriksson P., Sreerekha T. R. and Teichmann C., 2004, J. Geophys. Res.,109(D24), D24207, , doi:10.1029/2004JD005140
- von Engeln et al. (1998) von Engeln, A., Buehler S. A., Langen J., Wehr T. and Kuenzi K., 1998, J. Geophys. Res., 103(D24), 31735-31748
- Eriksson et al. (2005) Eriksson, P., Buehler S. A., Emde C., Sreerekha T. R., Melsheimer C. and Lemke O., 2005, ARTS-1-1 User Guide, University of Bremen, Bremen, Germany 308 pages, regularly updated versions available at www.sat.uni-bremen.de/arts/
- Evans et al. (1998) Evans, K. F., Walter S. J., Heymsfield A. J. and Deeter M. N., 1998, J. Appl. Meteorol., 37, 184
- Evans et al. (2002) Evans, K. F., Walter S. J., Heymsfield A. J. and McFarquhar G. M., 2002, J. Geophys. Res., 107, 10
- Gao et al. (1993) Gao B. C., Goetz A. F. H., Wiscombe W.J., 1993, Geophys. Res. Lett., 20, 4, 301-304
- Giovannelli et al. (2001) Giovanelli R., Darling J., Sarazin M., Yu J., Harvey P., Henderson C., Hoffman W., Keller L., Barry D., Cordes J., Eikenberry S., Gull G., Harrington J., Smith J. D., Stacey G. and Swain M., 2001, PASP, 113, 785, 789-802
- Hayton et al. (2003) Hayton D.J., Ade P., Lee C., Evans F., 2003, Proceedings of SPIE, 5235, 586
- Hanany & Rosenkranz (2003) Hanany S. and Rosenkranz P., 2003 New Astron. Reviews, 47, 1159-65
- Hoepfner & Emde (2005) Hoepfner M. and Emde C., 2005, J. Quant. Spectrosc. Radiat. Transfer, 91(3), 275-285, doi:10.1016/j.jqsrt.2004.05.066
- Hu &White (1997) Hu W. and White M., 1997 New Astron. 2, 323, (http://astro.berkeley.edu/mwhite/polar/)
- Ivanova et al. (2001) Ivanova D.C., Mitchell D.L., Patrick Arnott W. and Poellot M., 2001, Atmos. Res. 59-60, 89-113
- Keating et al. (1998) Keating, B., Timbie P., Polnarev A., Steinberger J., 1998, ApJ, 495, 580-596
- Maffei et al. (2004) Maffei B., Ade P., Calderon C., Challinor A., De Bernardis P., Dunlop L., Gear W., Giraud-Heraud Y., Goldie D., Grainge K., Isaak K., Johnson B., Jones M., Lasenby A., Mauskopf P., Melhuish S., Orlando A., Piccirillo L., Pisano G., Taylor A. C., Withington S. and Yassin G., 2004, EAS publication series, 14, 251, (Proc. Dome C Astronomy/Astrophysics meeting, Toulouse, France)
- Martellucci et al. (2002) Martellucci A, Poiares Baptista J.P.V. and Blarzino G., 2002, 1st International workshop, COST action 280, Propagation impairment mitigation for millimetre wave radio systems, technical note PM3037
- Melsheimer (2005) Melsheimer C., Verdes C., Buehler S. A., Emde C., Eriksson P., Feist D. G., Ichizawa S., John V. O., Kasai Y., Kopp G., Koulev N., Kuhn T., Lemke O., Ochiai S., Schreier F., Sreerekha T. R., Suzuki M., Takahashi C., Tsujimaru S. and Urban J., 2005 Radio Sci., 40, RS1007, doi:10.1029/2004RS003110.
- Noel & Chepfer (2004) Noel V., Chepfer H., 2004, J. Atmos. Sci., 61, 16, 2073
- Noel & Sassen (2005) Noel V., Sassen K., 2005, J. Appl. Meteorol., 44, 653
- Prigent et al. (2005) Prigent C., Defer E., Pardo J.R., Pearl C., William B., Rossow W.B. and Pinty J.P., 2005, Geophys. Res. Lett., 32, L04810, doi:10.1029/2004GL022225
- Seljak & Zaldarriaga (1996) Seljak, U. and Zaldarriaga M., 1996, ApJ, 469, 437
- Sreerekha et al. (2005) Sreerekha T. R., Buehler S. A., English S. J., O’Keeffe U., Doherty A. and Emde C., 2005, Q. J. Roy. Meteorol. Soc., submitted
- Teichmann et al. (2006) Teichmann C., Buehler S. A. and Emde C., 2006, J. Quant. Spectrosc. Radiat. Transfer, 101, 179
- Trione (2003) Trione G., 2003, PhD thesis, Politecnico di Milano
- Uppala et al. (2005) Uppala, S. M., Kallberg P.W., Simmons A.J., Andrae U., da Costa Bechtold V., Fiorino M., Gibson J.K, Haseler J., Hernandez A., Kelly G.A., Li X., Onogi K., Saarinen S., Sokka N., Allan R.P., Andersson E., Arpe K., Balmaseda M.A., Beljaars A.C.M., van de Berg L., Bidlot J., Bormann N., Caires S., Chevallier F., Dethof A., Dragosavac M., Fisher M., Fuentes M., Hagemann S., Holm E., Hoskins B.J., Isaksen L., Janssen P.A.E.M., Jenne R., McNally A.P., Mahfouf J.-F., Morcrette J.J., Rayner N.A, Saunders R.W., Simon P., Sterl A., Trenberth K.E., Untch A., Vasiljevic D., Viterbo P. and Woollen J., 2005, Q. J. Royal Meteorological Society, 131, 2961-3012
- Wallace, & Hobbs (1977) Wallace, J. M., and Hobbs P. V., 1977, Atmospheric Science, Academic Press, , ISBN 0-12-732950-1