Constructing the Subaru Advanced Data and Analysis Service on VO
Abstract
We present our activity on making the Subaru Data Archive accessible through the Japanese Virtual Observatory (JVO) system. There are a lot of demand to use the archived Subaru data from various fields of astronomers. To be used by those who are not familiar with the way to reduce the Subaru data, the data reduction should be made before providing for them, or at least it should be easily done without precise knowledge about instrument’s characteristic and environment where data are taken. For those purposes, data quality assessment system NAQATA is developed, which is presented in this meeting by Nakata et al. (2006), and the science-ready image data are provided for some of the SuprimeCam data at SMOKA data service which is presented by Enoki et al (2006). JVO portal will provide the way to access the reduce data, and also provides the way to reduce from raw data with very few efforts through the user-friendly web browser I/F. To provide such a CPU-intensive service, we have developed a GRID computing system. The architecture of this Subaru Data and Analysis system are discussed.
National Astronomical Observatory of Japan, 2-21-1 Osawa, Mitaka Tokyo, 181-8588 Japan
University of Tokyo, 5-1-5 Kashiwa-no-Ha, Kashiwa Chiba, 277-8582 Japan
Ochanomizu Univerisity, 2-1-1 Otsuka Bunkyo-ku, Tokyo, 112-8610 Japan
Fujitsu Ltd., 4-1-1 Kamikodanaka Nakahara-ku, Kawasaki, 211-8588
Systems Engineering Consultants Co. Ltd., 22-4 Sakuraoka-cho Shibuya-ku, Tokyo, 150-0031
1. Introduction
Thanks to the progress of telescope technology and the detection technique of recent years, it is expected that we will meet with a situation where a large scale of high-quality data is continuously generated by such as Subaru Telescope, Sloan Digital Sky Survey an so on. The way of traditional analysis, however, appears to be insufficient for using the large amount of data effectively and efficiently and getting the maximum scientific results. Although many people recognize the importance of research that uses the multi-wavelength data, such research actually needs considerable effort. One reason is that, for each data set, one needs to learn how to reduce and analyze the data, and even needs to know where the analysis tools are available. To overcome such situation and maximize the scientific return from a big project like Subaru and ALMA, it is important to construct an environment where user can access to the science-ready data with very few effort. National Astronomical Observatory of Japan (NAOJ) started its VO project (Japanese Virtual Observatory – JVO) in 2002. The objectives of the JVO project are to provide a seamless access to the distributed data service in the VO, and to provide user-friendly analysis environment. This paper describes our recent progress on the second objective.
2. Current Status of the Subaru Data Archive
Subaru111http://subarutelescope.org/, is an optical-infrared 8.2 m telescope operated by National Astronomical Observatory of Japan (NAOJ) at Mt. Mauna Kea Hawai. Subaru has seven open use instruments: CIAO, COMICS, FOCUS, IRCS, SuprimeCam, HDS and MOIRCS. CISCO is no longer available for open-use. Using these instruments, observation can be made for wavelengths from optical (300 nm) to infrared (20 m) with spectrum resolution up to (HDS).

The total amount of public data for each instrument is shown in Figure 1. As of October 2006, 8 TB of data is archived in the public area. More than 70% of the data are from the SuprimeCam, which is a mosaic of ten 2048 4096 CCDs and covers a 34’ x 27’ field of view with a pixel scale of 0.20”. More than 90% of all the data requests are for the SuprimeCam, so our current priority issue is how to improve the usability of the SuprimeCam data.
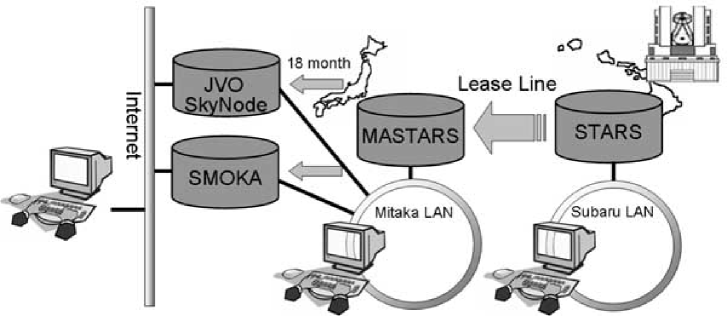
Figure 2 shows the flow of data taken by the Subaru. The data are registered in the Subaru Telescope Archive System (STARTS) as soon as the data are acquired by the instruments, so an observer retrieves his data from STARS during and/or after the observation. The data of STARS is mirrored to the Mitaka Advanced STARS (MASTARS), so the observer can retrieve the data also from the MASTARS. STARTS and MASTARS are not public data archive. To use the system, you need to get an account on the Subaru computing system for STARS or an account on the Mitaka computing system for MASTARS. The data that passed 18 months of a proprietary period becomes publicly available through the SMOKA222http://smoka.nao.ac.jp/, and JVO333http://jvo.nao.ac.jp/ system. The SMOKA system provides various query modes for the Subaru archive, and it is described in Enoki et al. (2006). The JVO system provides a VO standard access interface to the Subaru archive. Currently only the data of SuprimeCam is available from the JVO.
The amount of data, especially of SuprimeCam, is very large, so it is important to provide a way to analyze the data without moving the data to a remote users’ machine. One of the ways to do so is to login to the Subaru or Mitaka computing system and analyze the data on the machine. It is, however, not practical to use the visualization tool from a remote machine, especially when accessing through a slow network. Another solution is to provide a web service, through which one can access to the data analysis software and visualize the data in a compact graphical format such as GIF, JPEG and PNG. Recently a lot of open source framework are available for making such a service, and it has been realized that interactivity of the web based service can be improved by using Ajax technique as demonstrated by the google map service.
Another important point is to provide the data in a form that detector and environment dependencies are removed. Those dependencies are usually not known by an archive user, so it should be properly reduced by a data provider. The quality of the data reduction is improved as the experience is accumulated and the reduction software is also evolves continuously, so it is adequate to reduce the data on demand with the most developed algorithm. It is also important to provide the way to reduce the data with older version software for assuring data reproducibility to enable later same analysis. By providing the data in such a manner, a data provider can control the quality of data by putting a tag representing a version of reduction software in the FITS header. The reduction process is hidden from a user, and the user does not need to take care about most of part of data reduction. So, we have decided to provide such a service on the Japanese Virtual Observatory (JVO) web portal.
3. Grid Computing System
The data reduction processes are concentrated on the JVO servers, so computing resources need to be integrated in a scalable manner to the JVO. We have developed a Web service based grid computing system. This system is composed of four services: Monitoring and Discovering Service (MDS), Data Analysis Service (DAS), Data Search Service (DSS) and Storage Service (SRS). Figure 3 shows an example of SuprimeCam response (flat frame) calculation system, which is showing how each service interacts each other.
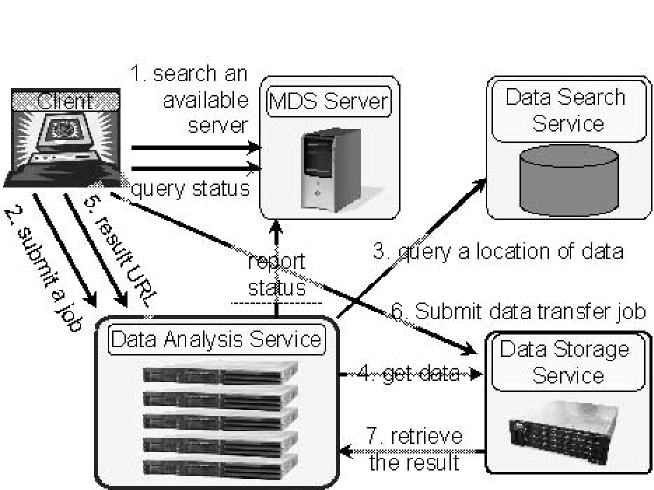
The MDS manages the status of each DAS, and schedules the job submission requested by a GRID client. Each DAS server periodically report its status, such as load average, number of running job and job status, and the status is stored on an MDS database. A GRID client queries to the MDS to ask which server is free for a job submission. The MDS returns a service endpoint URL that is appropriate for the job submission. The client submit the job, and wait it to finish. While waiting, the client periodically polling to the MDS for querying the job status. The DAS sends a query to the DSS to get Subaru RAW data, the DSS returns the URLs for the data, the DAS retrieves the data and starts analysis. When a job status is changed to “finish”, the client queries the DAS for an URL to retrieve the result. The URL is passed to the SRS, the result is stored on the storage of the SRS, and the metadata of the result is registered on the DSS.
The interactions between each service and client are made by exchanged a SOAP message. The interface of each service is defined in the Web Service Description Language (WSDL). Several examples of the defined interfaces are described in Java interface as follows:
MDS Interface
   void reportStatus(String hostId, double load, int njob)
   ServiceInfo resolveService(String serviceId)
   void reportJobStatus(String hostId, int jobId, String status)
   String getJobStatus(String hostId, int jobId)
   ...

DAS Interface
   int submitJob(String command, String argv)
   String getResultURL(int jobId)
   String query(int jobId)
   String finalize(int jobId)
   ...

SRS Interface
   int copyAsync(String src, String dest)
   void copy(String src, String dest)
   void finalize(int jobId)
   ...

DSS Interface
   VOData performQuery(Select select)
   ...
The reportStatus interface is used by a DAS server to report its
load average and the number of submitted jobs.
The resolveService interface is used by a GRID client to decide
which server to submit a job.
The returned ServiceInfo contains an endpoint URL.
The submitJob interface is used to submit a job to the DAS
server, which returns a job ID and it is used for polling the job status.
The getResultURL interface returns an access URL for retrieving
the result.
The copyAsync and copy interface are used to transfer data
between two servers or just to copy the data inside the same server.
The former interface is used for data transfer that is expected to take
long time.
The performQuery interface is used for querying the data by
Astronomical Data Query Language
(ADQL444http://www.ivoa.net/twiki/bin/view/IVOA/IvoaVOQL),
and return the result in
VOTable555http://www.ivoa.net/twiki/bin/view/IVOA/IvoaVOTable
format.
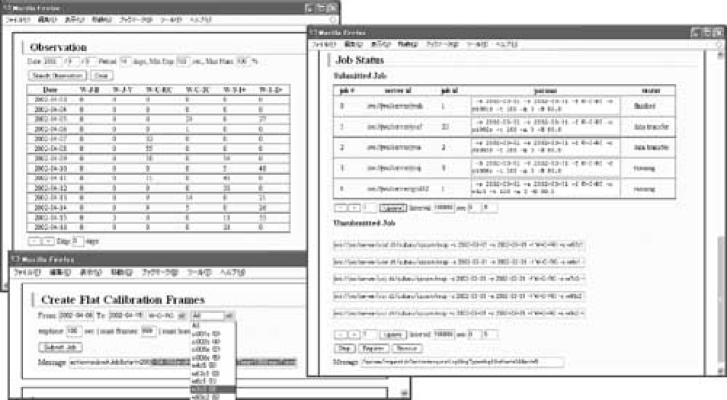
A web form based GUI for calculating a response frame of SuprimeCam CCD is made for easy job submission as shown in Figure 4.
The Observation section of the GUI is used for browsing the number of exposures for each filter on each day. The observation period for calculating a response frame is determined here. Usually select a period of successive SuprimeCam observations, which typically lasts one week. At the section of Create Flat Calibration Frames, one can select a filter and/or a chip for which a flat calibration frame is calculated. After submitting the jobs, the job status can be viewed at the section of Job Status. The status changes from “running” to “data transfer” and then to “finished” if an error does not happen.
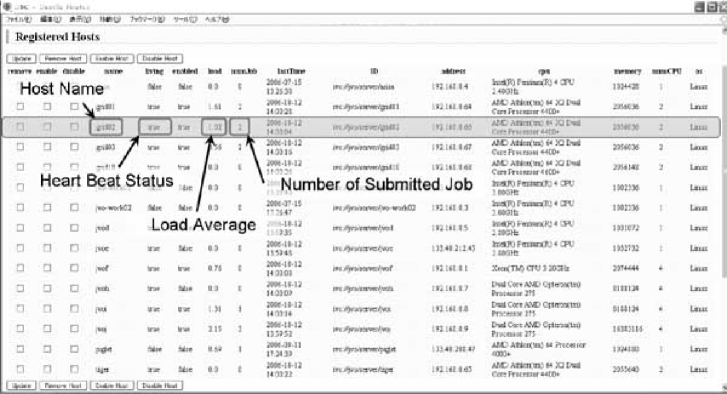
The MDS server manages a database that contains static information (host name, IP address, CPU type, memory size) and status (load average, number of submitted jobs, living and enabled flags) of each DAS server, which can been seen on the MDS web page as shown in Figure 5. The living flag stays “true” while the MDS are receiving a hear beat message from the DAS server. When a successive five minutes of disconnection happens, the flag changes to “false”, and the server is recognized as “unavailable”. The “enabled” flag is used to prohibit the job submission to the server. When the flag is “false”, a job is not submitted to the server.
4. Japanese Virtual Observatory
The Japanese Virtual Observatory (JVO666http://jvo.nao.ac.jp/portal) is a VO portal service, which federates the distributed VO services and provides data analysis environment through a web browser. JVO is especially going to provide analysis environment utilizing the Subaru data. The Subaru data currently available on the JVO are: Subaru Deep Field catalog (SDS, SXDS), SuprimeCam chip image, and SuprimeCam mosaic image. We are preparing to provide reduced data of the other Subaru instruments. We are also going to implement the data analysis interface for: reduction of raw data with user specified parameters, image manipulation, spectrum fitting, catalog creation from a image, and so on. These data analysis will be executed on the server side, so any plugin tools are required to be installed on the user’s machine.
We are going to integrate the GRID computing system described above to the JVO portal so that enough amount of computing resource is provided to a user. An overview of the JVO system is shown in Figure 7.
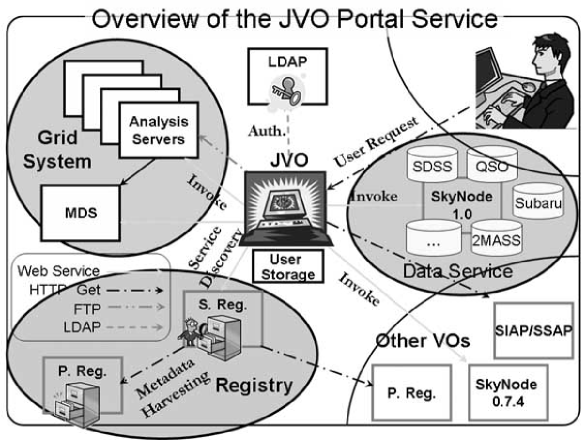
The details of the JVO system were described in elsewhere (Shirasaki et al. 2006, Shirasaki et al. 2006b, Tanaka et al. 2006, Ohishi et al. 2006).
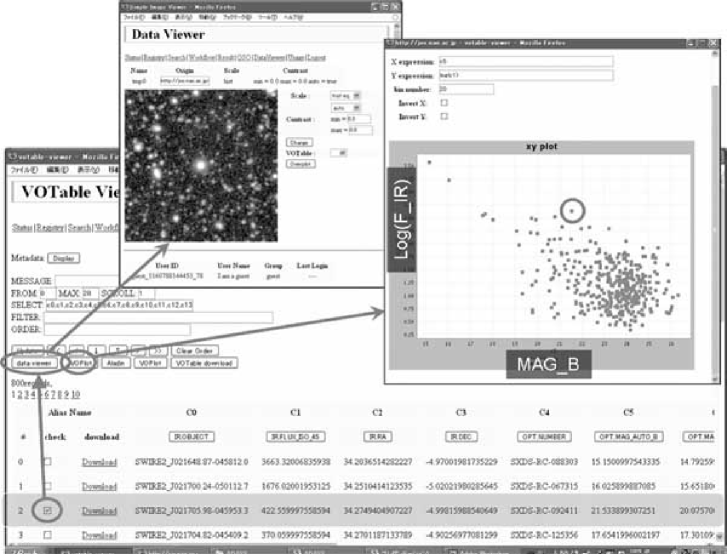
Figure 7 shows the result of cross match query between the catalogs of Subaru SuprimeCam (optical) and Spitzer (infrared). The JVO provides several visualization tools such as JVO Data Viewer, JVOPlot, VOPlot777http://vo.iucaa.ernet.in/~voi/voplot.htm by VO India and Aladin888http://aladin.u-strasbg.fr/ by CDS. The VOPlot and Aladin are Java applets. The JVO Data Viewer and JVOPlot are server side web applications, so the data itself are not transfered to the local machine; they are converted to compact-sized graphics and transfered to the user’s web browser. It is especially convenient to view the large data set.
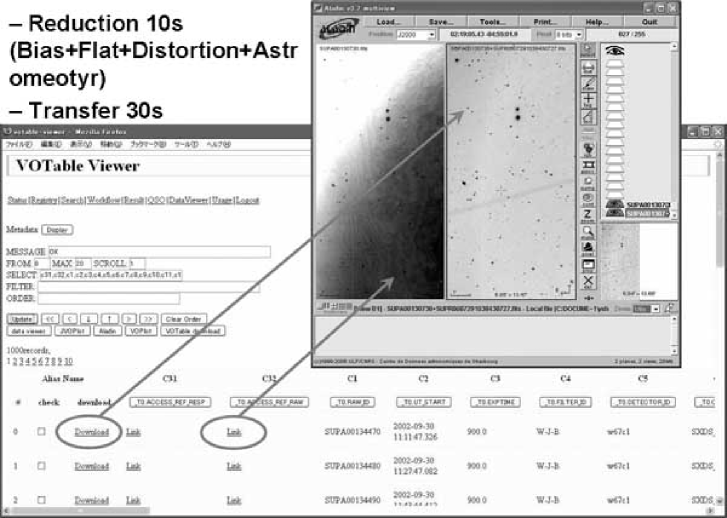
Figure 8 shows the result of query for reduced SuprimeCam data. The service returns a link to the reduced data, the link invokes the on-the-fly data reduction web application, and then a FITS file the reduced image is returned. The search result includes also the links to the raw and response frames. The reduction procedure consists of bias subtraction, flat fielding, distortion correction, and astrometric calibration. The flat frames are calculated in advance by the response calculation service described above, and registered on the database. The typical time to execute the reduction is about 10 sec. Once the reduced data are generated, it is stored on a cash area to avoid repetitions of the same reduction on the same data.
5. Summary
The construction of the Subaru advanced data and analysis service has
just started this year (2006).
Currently the data of SuprimeCam is a primary target of the development,
but data of other instruments will be available from the JVO.
The grid computing system are constructed to obtain enough computing
resource to analyze all the SuprimeCam data in reasonably short time.
The JVO portal service is available for everyone at
http://jvo.nao.ac.jp/portal, where currently only the limited
functionality is publicly available.
To use all the JVO functionality, user registration will be required.
Acknowledgments.
This work was supported by the JSPS Core-to-Core Program, Grant-in-aid for Information Science (15017289 and 18049074) and Young Scientists (B) (17700085) carried out by the Ministry of Education, Culture, Sports, Science and Technology of Japan.
References
Shirasaki, Y. et al., 2006, Advanced Software and Control for Astronomy. Edited by Lewis, Hilton; Bridger, Alan. Proceedings of the SPIE, 6274, p42
Tanaka, M. et al., 2006, in ASP Conf. Ser., Vol. 351, ADASS XV, ed. C. Gabriel, C. Arviset, D. Ponz, & S. Enrique (San Francisco: ASP), 460
Shirasaki, Y. et al., 2006b, in ASP Conf. Ser., Vol. 351, ADASS XV, ed. C. Gabriel, C. Arviset, D. Ponz, & S. Enrique (San Francisco: ASP), 456
Ohishi, M. et al., 2006, in ASP Conf. Ser., Vol. 351, ADASS XV, ed. C. Gabriel, C. Arviset, D. Ponz, & S. Enrique (San Francisco: ASP), 375
Nakata, F. & Enoki, M. 2006, this volume, [P2.16]
Enoki, M. & Nakata, F. 2006, this volume, [P3.05]