The Brightest Stars in M32: Comparing Predictions from Spectra with the Resolved Stellar Content 11affiliation: Based on observations obtained at the Gemini Observatory, which is operated by the Association of Universities for Research in Astronomy, Inc., under a co-operative agreement with the NSF on behalf of the Gemini partnership: the National Science Foundation (United States), the Particle Physics and Astronomy Research Council (United Kingdom), the National Research Council of Canada (Canada), CONICYT (Chile), the Australian Research Council (Australia), CNPq (Brazil), and CONICET (Argentina). 22affiliation: This publication makes use of data products from the Two Micron All Sky Survey, which is a joint project of the University of Massachusetts and the Infrared Processing and Analysis Center/California Institute of Technology, funded by the National Aeronautics and Space Administration and the National Science Foundation.
Abstract
Broad- and narrow-band images covering the m wavelength interval are used to investigate the properties of the brightest AGB stars in the Local Group galaxy M32. Data obtained with the NIRI imager on the Gemini North telescope indicate that the brightest AGB stars near the center of M32 have peak M brightnesses and colors that are similar to those of luminous AGB stars in the Galactic disk. Data obtained with the CFHTIR imager on the Canada-France-Hawaii Telescope indicate that the density of bright AGB stars per unit visible and near-infrared surface brightness is constant out to projected major axis distances of 1 kpc, suggesting that the AGB stars and their progenitors are smoothly mixed throughout the main body of the galaxy. In addition, the color distribution of bright AGB stars throughout much of the galaxy is consistent with that of a single population of AGB stars, the majority of which are long period variables, having a common metallicity and age. Thus, these data do not support spectroscopic studies that find an age gradient in M32. The AGB contributes of the integrated light in the region surveyed. This is consistent with previous estimates made from the integrated near-infrared spectrum, and is suggestive of an age Gyr. The stellar content of M32 is compared with that of the M31 bulge at a projected minor axis distance of 1.4 kpc. While the peak band brightnesses of AGB stars in the two systems agree to within a few tenths of a magnitude, M32 contains more bright AGB stars per unit integrated brightness than the outer bulge of M31. This is suggestive of a difference in mean age, and it is concluded that the star forming histories of M32 and the bulge of M31 have differed over a significant fraction of their lifetimes, which is consistent with spectroscopic studies of these systems. The well-mixed AGB content of M32 is consistent with the galaxy having been tidally stirred, presumably by interactions with M31.
1 INTRODUCTION
The Local Group galaxy M32 is the nearest system with structural characteristics that are reminiscent of classical elliptical galaxies (e.g. Kormendy 1985; Graham 2002). These similarities notwithstanding, the evolution of M32 has almost certainly been influenced by – if not dominated by – the gravitational field of M31. A number of studies have suggested that the compact nature of M32 is the consequence of tidal pruning (e. g. Faber 1973; Burkert 1994; Bekki et al. 2001), and the orbit of M32 is such that there have likely been interactions with M31 and some of its companions (Cepa & Beckman 1988).
Graham (2002) and Choi, Guhathakurta, & Johnston (2002) find evidence of a residual disk around M32, suggesting that the present-day galaxy may be the remnant of what was once a larger disk-dominated galaxy; if this interpretation is correct then the majority of stars that belonged to the original disk may have been donated to M31. In fact, there are signatures of interactions between M31 and at least some of its companions. While M31 likely contains a metal-poor halo with properties that are similar to the Milky-Way halo (Chapman et al. 2006), the extraplanar environment is dominated by tidal streams (e.g. Ferguson et al. 2002; Zucker et al. 2004). The orbit of the dominant stream may come close to the center of M31, where the stream can be disrupted and the stars dispersed into the inner halo (Ibata et al. 2004). Tidal stirring may explain the uniform metallicity distribution seen throughout the disk and extraplanar regions of M31 (Bellazzini et al. 2003).
Ferguson et al. (2005) investigated deep CMDs of tidal substructures in the outer regions of M31, and these data reveal two common characteristics. First, the red giant branch (RGB) sequences in the substructures have similar colors, which are suggestive of [Fe/H] between –0.4 and –0.7. Second, the substructures contain a population of blue main sequence stars, with a MSTO that is indicative of an age Gyr. The age and metallicities of the structures in the outer regions of M31 are thus reminiscent of those inferred for M32 (see below), although the mean velocity and velocity dispersion of stars in the dominant stream are difficult to reconcile with the stream originating in M32 (Ibata et al. 2004).
Other components of M31 and M32 may also have been affected by interactions between these galaxies. Beasley et al. (2005) find that a subset of M31 globular clusters have ages and chemical properties that are suggestive of forming as part of M32. Moreover, the orbital properties of M32 are consistent with a link to an HI cloud near M31 (Cepa & Beckman 1988), raising the possibility that at least some of the ISM has been stripped from this galaxy. Finally, warping in the HI disk of M31 can also be explained as the result of interactions with M32 (Byrd 1978).
While the evolutionary status of M32 in the context of more massive spheroidal systems is not clear, it is still recognized as an important laboratory for stellar population studies. Because of its high central surface brightness it is possible to obtain high quality spectra that span a wide range of wavelengths and can serve as the basis for detailed analysis of the integrated light. M32 is also close enough that it can be resolved into stars, and there is an absence of interstellar dust, so that differential extinction is not an issue when investigating the resolved stellar content. Thus, M32 is one of only a handful of galaxies where there is a possibility of comparing predictions from the spectroscopic analysis of integrated light with the resolved stellar content.
Most studies of the integrated spectrum of M32 have found signatures of an intermediate age population (O’Connell 1980; Rose 1985; Davidge 1990; Bica, Alloin, & Schmidt 1990; del Burgo et al. 2001; Worthey 2004; Rose et al. 2005). The integrated visible and near-infrared colors of M32 show little or no variation with radius (e.g. Peletier 1993). While it was initially thought that the far-UV color profile of M32 may differ from that of other spheroids (O’Connell et al. 1992; Ohl et al. 1998), this result was likely a consequence of contamination from the outer disk of M31, and de Paz et al. (2005) conclude that the radial UV properties of M32 are similar to those of classical ellipticals. There are modest radial trends in the strengths of some absorption lines (Davidge, de Robertis, & Yee 1990; Davidge 1991; Hardy et al. 1994; Fisher, Franx, & Illingworth 1995; Worthey 2004; Rose et al. 2005). As discussed by Davidge (1991), Worthey (2004), and Rose et al. (2005), the modest gradients in the spectroscopic and photometric data may not mean that the stellar content of M32 is uniformly mixed; rather, the radial properties of M32 can be explained as the result of gradients in both age and metallicity, in the sense of an older mean age and lower mean metallicity towards increasing radii.
A spectroscopically and photometrically distinct nucleus might be expected in M32 given the presence of a supermassive black hole (Tonry 1987; Dressler & Richstone 1988). However, there is only modest – if any – nuclear line emission (e.g. Rose et al. 2005), and the spectral-energy distribution (SED) of the nucleus does not differ markedly from that of its surroundings. WFPC2 images show no evidence for central sub-structures due to dust or a disk, and there is no evidence for a central blue core (e.g. Lauer et al. 1998). van der Marel et al. (1998) and Ho, Terashima, & Ulvestad (2003) note that the low level of nuclear emission is surpising given the high central stellar density. The absence of emission might be related to the low HI and molecular gas content, as measured by Sage, Welch, & Mitchell (1998) and Welch & Sage (2000).
The bright resolved stellar content of M32 has been the subject of a number of studies. Davidge et al. (2000) and Davidge & Rigaut (2004) discuss the properties of asymptotic giant branch (AGB) stars between 2 and 13 arcsec of the nucleus. Davidge et al. (2000) find (1) no obvious trend in the peak brightness or color of bright AGB stars between 2 and 13 arcsec of the nucleus, and (2) that the number of bright AGB stars scales with band surface brightness, suggesting that the brightest AGB stars belong to a population that is uniformly mixed with the main body of stars. The fraction of AGB stars that are long period variable (LPVs) does not change with radius near the nucleus (Davidge & Rigaut 2004).
The properties of RGB and AGB stars outside of the central regions of M32 have been investigated at visible/red (Freedman 1989; Davidge & Jones 1992, & Grillmair et al. 1996) and near-infrared (Freedman 1992; Elston & Silva 1992; Davidge 2000) wavelengths. Grillmair et al (1996) sampled stars as faint as the horizontal branch, and did not find evidence for an extended AGB; rather, they argue that their data are consistent with a moderately old stellar population. However, Freedman (1989), Elston & Silva (1992), and Davidge (2000) find bright AGB stars at near-infrared wavelengths, although it is not clear if such stars come from an intermediate-age or an old metal-rich population (e.g. Davidge 2001). The seeming discrepancy between the AGB contents found by Grillmair et al. (1996) and the near-infrared studies can be understood if the photometric properties of the brightest cool stars at wavelengths shortward of m are affected by line blanketing and circumstellar extinction; in this case, a better measure of the luminosity of AGB stars is obtained in the infrared.
The deepest photometric study of M32 to date was conducted by Worthey et al. (2004), who used WFPC2 images to search for the main sequence turn-off (MSTO) in the outer regions of the galaxy. The MSTO was not detected, and it was concluded that the youngest population in this part of the galaxy has an age of 1 Gyr or older. The detection of RR Lyrae stars in the outer regions of M32 by Alonso-Garcia, Mateo, & Worthey (2004) indicate that an old stellar population is present.
The bright stellar content in the outer regions of M32 is similar to that in the outer regions of other nearby, but more massive, elliptical galaxies. The metallicity distribution functions of the outer regions of M32 and NGC 5128 are similar (Harris & Harris 2000), and the brightest AGB stars in these – and other – galaxies have comparable peak MK (Davidge 2002). After normalizing to a common surface brightness, the band LF of AGB stars in the outer regions of M32 matches the LFs of the outer regions of Maffei 1 and NGC 5128 (Davidge 2002). Clearly, it is of interest to compare the bright stellar content of M32 with the bulge of M31. Davidge (2001) compared AGB stars in the outer regions of M32 and the inner bulge of M31. While differences in stellar content were found, the central regions of many bulges harbour star clusters that may not be representative of the main body of the bulge.
Existing studies of the resolved stellar content of M32 have typically been restricted to relatively small areas, and this can frustrate efforts to identify a sample of AGB stars that is large enough to permit the peak AGB brightness to be measured, especially in low density regions at large radii. Moreover, data that cover only small areas are of limited use for assessing if there are radial changes in stellar content. Contamination from stars in the outer disk of M31 is an additional source of potential grief. An especially insidious aspect of this contamination is that the mean metallicity of stars in the outer disk of M31 is [M/H] (Bellazzini et al. 2003), which is not greatly different from that of the main body of stars in M32. As a result, the photometric properties of stars in M32 and the outer disk of M31 overlap, complicating efforts to identify stars in the portion of M32 that is closest to M31.
In the current study, two datasets are used to investigate the photometric properties of the brightest stars in M32. In one dataset, images obtained with the NIRI imager on Gemini North are combined with the near-diffraction limited band images used by Davidge et al. (2000) to investigate the most highly evolved AGB stars near the center of M32. Data longward of m are of interest for such an investigation as they can be used to identify AGB stars that are embedded in thick circumstellar envelopes. These stars are expected to have massive progenitors, and hence probe the young end of the ‘intermediate age’ range.
The other dataset consists of broad- and narrow-band images obtained with the CFHTIR on the Canada-France-Hawaii Telescope (CFHT), and is used to probe the bright stellar content of M32 over a range of radii. In addition to sampling the brightest AGB stars at a wavelength where line blanketing is not a major issue, broad-band near-infrared colours can also be used to isolate C stars (e.g. Davidge 2003; 2005, Demers, Dallaire, & Battinelli 2002), which might be present if the outer regions of M32 contain an intermediate-age population. Finally, images of the bulge of M31, obtained during the same observing run with the same instrument, are also used to make a direct comparison with the stellar content of M32.
The paper is structured as follows. The observations and the procedures used to reduce the data are discussed in §2. The color-magnitude diagrams (CMDs) and luminosity functions (LFs) obtained from the NIRI and CFHTIR data are presented and discussed in §§3 and 4, while the stellar content of M32 and the bulge of M31 are compared in §5. A discussion and summary of the results follows in §6.
2 OBSERVATIONS & REDUCTIONS
2.1 NIRI Data
Deep images of M32 were recorded with NIRI (Hodapp et al. 2003) on Gemini North during the nights of August 16 and September 18, 2003 as part of program GN-2003B-Q-43. The f/14 camera was used for these observations, and a 512512 subarray was read out; therefore, each exposure covers 25.6 arcsec on a side with 0.05 arcsec pixel-1 sampling. Hundreds of short (0.076 and 0.151 s) exposures were co-added to produce an image with an integration time of 30.2 s at each dither position. A sky field was observed immediately after each M32 dither position was completed, and the sky and M32 observations have the same exposure times. The dither sequence was repeated to build up signal, and the total on-source integration time is 1557.4 s.
The sky frames that bracket the observations of each M32 dither position were averaged and subtracted from those M32 observations. The sky-subtracted data were then divided by a flat field frame, which was constructed by normalizing the mean of all sky images. Flat-fielding is often ignored when reducing imaging data recorded in the thermal infrared because the background noise usually far exceeds flat field variations. However, this step was judged to be necessary for these data because the background noise is comparable to the flat field variations. The flat-fielded data were spatially aligned and then summed. A final image was produced by cropping the summed image to the area that is common to all dither positions. The image quality in the final image is 0.35 arcsec FWHM.
2.2 CFHTIR Data
Near-infrared images of M32 were recorded on the night of November 22, 2002 with the CFHTIR camera, which was mounted at the Cassegrain focus of the 3.6 meter CFHT. The detector in CFHTIR is a HgCdTe array. With a pixel scale of 0.211 arcsec pixel-1, then a arcmin2 field is covered with each exposure.
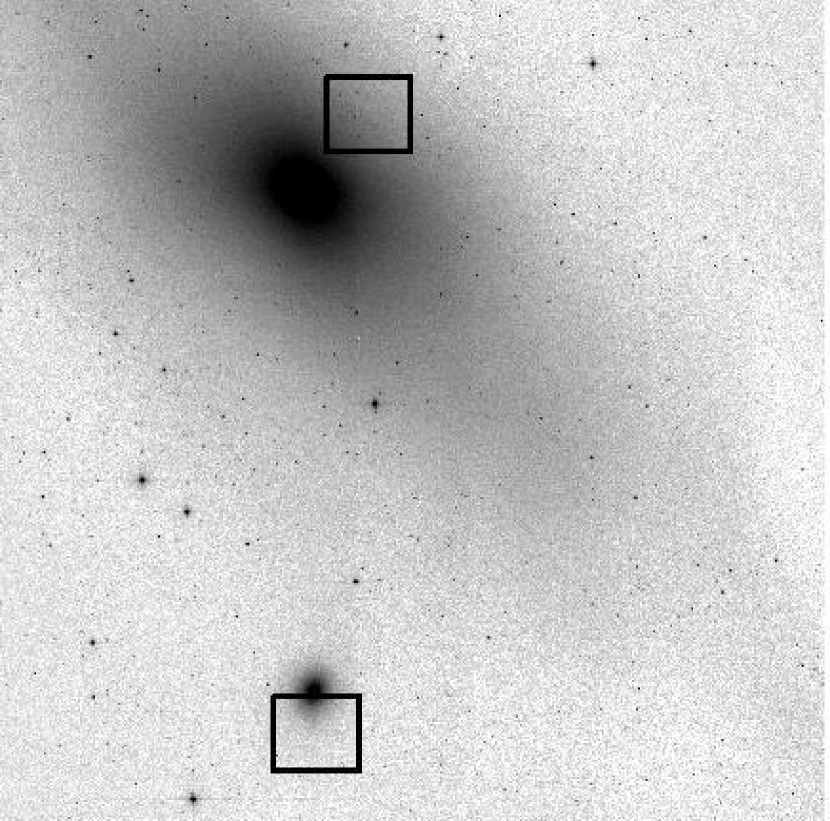
A field in the southern half of M32, centered at 00:42:42.3 Right Ascension and 40:50:00 Declination (J2000), was observed. The southern portion of M32 was selected for this study to minimze contamination from stars in the disk of M31, which complicate efforts to study the northern half of the galaxy. A field located near the minor axis of M31, and centered at 00:42:30.0 Right Ascension and 41:19:25 Declination (J2000), was also observed to allow the properties of AGB stars in the outer bulge of M31 to be compared with those in M32. The locations of both CFHTIR fields are marked in Figure 1; the south east corner of the CFHTIR M31 field samples a portion of the bulge that is close to the F174 field discussed by Stephens et al. (2003).
The CFHTIR fields were observed through and broad-band filters, as well as CO and continuum narrow-band filters. The CO filter samples the bandhead, with m and m, while the continuum filter has m and m. For the observations taken through the broad-band filters, three 30 s exposures were recorded at four dither positions; hence, the total exposure time is 360 s filter-1. A longer exposure time was employed when observing through the narrow-band filters; six 30 s exposures were recorded per dither position through the continuum filter, and nine 30 s exposures were recorded per position through the CO filter.
The data were processed using a pipeline for near-infrared imaging that included (1) dark subtraction, (2) the division by dome flats, (3) the subtraction of calibration frames that removed thermal emission signatures and interference fringes, and (4) the subtraction of the DC sky level. The resulting images for each fieldfilter combination were spatially registered and then median combined. Final images were produced by trimming the stacked images to the area common to all exposures. Stars in the final images have FWHM arcsec, with modest filter-to-filter scatter.
3 LUMINOUS AGB STARS NEAR THE CENTER OF M32
The analysis of integrated spectra at visible wavelengths suggests that the youngest and most metal-rich stars in M32 are more centrally concentrated than older metal-poor stars (e.g. Worthey 2004; Rose et al. 2005). The radial changes in stellar content predicted from the spectra are such that measureable changes in the properties of resolved stars might be expected near the center of M32. For example, Worthey (2004) finds that the mean age is Gyr and [M/H] near the nucleus, whereas at 44 arcsec ( parsecs) the mean age is Gyr with [M/H] . Rose et al. (2005) finds a mean age Gyr near the nucleus, and Gyr at 30 arcsec ( parsecs) radius. Age gradients of the size inferred from the spectra could change the peak AGB brightness and/or the density of bright AGB stars over angular scales of a few tens of arcsec.
Efforts to study the youngest AGB stars in M32 may be complicated by circumstellar envelopes around these objects. This is a concern because the youngest, most metal-rich AGB stars will have the most massive progenitors, and these objects will likely experience the greatest rates of mass loss during their final stages of evolution. These objects are then more likely to be located in circumstellar cocoons than older, more metal-poor AGB stars. Because of the wavelength dependence of dust extinction, and the possible heating of dust by the central star, objects in such circumstellar shells may only stand out clearly against the main body of stars at wavelengths longward of m. Given that stars of this nature may be difficult to detect in the near-infrared, it was decided to investigate the brightnesses of AGB stars near the center of M32 in , which is a wavelength regime where sources with characteristic temperatures of a few hundred K will be brightest.
3.1 Identifying Unblended Stars and the CMD
The angular resolution of the data is 0.35 arcsec FWHM. This is poorer than in previous studies of the center of M32 where individual AGB stars have been resolved, and crowding may affect the ability to measure the brightnesses and colors of even the brightest stars. Following the procedure described by Davidge, Jensen, & Olsen (2006), a sample of objects that is likely not significantly affected by blending was identified by investigating the effects of degrading the angular resolution on measured brightness. This requires an infrared image that has a higher angular resolution than the data, and the Hokupa’a (Graves et al. 1998) QUIRC band image, which has FWHM arcsec and was used by Davidge et al. (2000) to study the AGB content near the center of M32, was employed for this purpose.
The Hokupa’a band image was rotated and re-sampled to match the orientation and pixel sampling of the NIRI image. The result was convolved with a gaussian so that the angular resolution matched that of the image. The brightnesses of sources in both the original and smoothed images were measured using the PSF-fitting program ALLSTAR (Stetson & Harris 1988). The difference in brightness between the smoothed and unsmoothed images, DK, is a measure of the impact of blending on a particular star; stars where smoothing affects the measured brightness will have D, whereas sources that are not greatly affected by blending at the coarser angular resolution will have D. This is a conservative method for identifying blended objects in , as the contrast between the brightest stars and the main body of fainter stars is greater in than in .
Given the high stellar density near the center of M32, it is not surprising that many of the objects have D, indicating that their photometric properties will likely be affected by blending at the angular resolution of the data. An inspection of the images shows that stars with D tend to be in environments where stars of comparable brightness are not present within a few tenths of an arcsec; consequently, D was adopted as the threshold to distinguish between blended and unblended stars.
The CMDs of sources with D are shown in Figure 2. The data have been divided into three distance intervals, corresponding to projected distances pc (2 – 4 arcsec), pc (4 – 7.4 arcsec), and pc ( arcsec), as sample completeness varies with distance from the center of the galaxy. The angular intervals used to construct these CMDs are those that were adopted by Davidge et al. (2000). The projected distances assume a distance modulus of 24.5, which is based on an RGB-tip brightness of (Freedman 1989; Davidge & Jones 1992) and M for this feature (e.g. Lee, Freedman, & Madore 1993). This distance modulus is consistent with that derived from an eclipsing binary in M31 (Ribas et al. 2005), which has the merit of being a primary distance indicator.
Many of the brightest stars near the center of M32 are photometric variables (Davidge & Rigaut 2004), and so the mixing of data recorded at different epochs smears color measurements. As the and data were not recorded at the same epoch then the range of colors seen in the CMDs is expected to be larger than the actual spread in intrinsic colors. This may explain, at least in part, why the AGB sequence in the CFHTIR data, which utilize measurements made at the same epoch and are discussed in §4, is better defined than that in Figure 2.
The number of stars in the pc interval is modest, as the fraction of stars in this interval with D is much higher than at larger radii. Moreover, the vast majority of stars that are more than 28.5 pc from the nucleus have , whereas at smaller radii there are stars as bright as . Despite the procedure used to cull stars that are susceptible to blends, such a trend is suspiciously like that expected if the brightest stars at small radii are blends. Therefore, simulations were conducted to determine if residual blending has an impact on the photometry.
Davidge (2001) co-added sub-fields with comparatively low stellar densities to simulate an environment with higher stellar density and assess the effect of blending near the center of M31; a comparison between the brightnesses of stars in the original and co-added datasets then provided a measure of the impact of crowding. This same procedure is employed here to determine if the brightest stars in the pc interval are blends. We are not able to assess the impact of crowding at even smaller radii, as the NIRI dataset can not be divided into enough independent sub-fields to replicate the high central stellar density in M32.
Three arcsec2 portions of the field near the edge of the image were extracted and co-added. The band surface brightness measurements made by Kent (1987) indicate that the stellar density in the co-added frame is the same as that 20 pc ( arcsec) from the nucleus. The brightnesses of individual stars were then measured in the co-added image. The same sub-fields were extracted from the Hokupa’a band image and co-added. The result was smoothed to match the angular resolution of the data, and DK was then computed for the various sources using the procedure described in §3.1.
The CMD of stars in the unstacked sub-fields is shown in the left hand panel of Figure 3. The CMD of sources with D, which are those that the analysis in §3.1 suggests are likely not affected by blending, in the stacked images is shown in the middle panel of Figure 3. As might be expected given the small number of sources in the pc CMD in Figure 2, the number of objects identified as being unblended is modest, as many of the sources in the co-added field have been rejected as being susceptible to blending. Furthermore, it is evident that the photometric properties of individual objects with D are affected by blending, as the color of the brightest source is 0.8 mag different from its counterpart in the unstacked data. This is not unexpected, as even modest levels of crowding will introduce uncertainties into photometric measurements. Still, the photometry of stars with D is not systematically skewed by crowding. To demonstrate this, the brightnesses and colors of sources in the unstacked data were matched with their counterparts in the summed data, and the mean difference between the two sets of brightness and color measurements were computed. For stars with D we find that magnitude, where the difference is in the sense stacked – unstacked, while . That these differences do not differ significantly from zero indicates that the photometric measurements are not systematically skewed.
The CMD of the co-added field without the rejection of stars with D is shown in the right hand panel of Figure 3. The effects of blending are clearly apparent when the CMD in the right hand panel is compared with those in the left hand and middle panels, as the number of objects with in the right hand panel is much larger than in the left hand panel. The brightnesses and colors of stars with D are also systematically skewed by crowding. For those stars with D we find that and , indicating that the mean brightness and color are affected by crowding.
In summary, the simulation discussed above suggests that the rejection of stars that are susceptible to blending using the DK statistic produces a sample of objects with photometric properties that are not skewed by crowding. The brightest stars with arcsec in Figure 2 are likely not unresolved blends of fainter stars. Thus, the brightest AGB stars near the center of M32 have .
3.2 Comparisons with the Galactic Disk and Bulge
The CMDs of stars with projected distances between 15.4 and 50 pc from the nucleus of M32 are shown in Figure 4. Also shown are data for (1) luminous M giants in the Galactic bulge from Frogel & Whitford (1987), (2) LPVs near the Galactic Center from Wood, Habing, and McGregor (1998), and (3) luminous Galactic disk AGB stars that were studied by Le Bertre (1992; 1993). The Le Bertre (1992; 1993) samples contain stars with redder colors and higher ML brightnesses than in the Frogel & Whitford (1987) sample, although the two datasets appear to form a more-or-less continuous sequence on the CMD. While many of the stars in the Wood et al. (1998) sample also fall along the sequence defined by the Frogel & Whitford (1987) M giants, there is a spray of objects that depart from this trend, and have colors comparable to those of the disk AGB stars.
The stars in the three comparison datasets were selected at different wavelengths; the majority of stars in the Frogel & Whitford sample are M giants selected from visible wavelength spectra (e.g. Blanco 1986), while the majority of the Le Bertre and Wood et al. samples were identified in the infrared. The majority of the stars discussed by Frogel & Whitford (1987) have . While the colors of the objects with the reddest colors in the Le Bertre (1992; 1993) samples are not published, the fact that they are not listed in the USNO-A2.0 Catalogue (Monet et al. 1998) suggests that . Similar sources in Baade’s Window would have after taking into account foreground extinction, and so may have been missed in the photographic surveys discussed by Blanco (1986).
The brightest AGB stars near the center of M32 fall along the sequences defined by Galactic bulge M giants and Galactic disk AGB stars in Figure 4. The Galactic disk and Galactic bulge sequences overlap when M, and so some of the fainter stars near the center of M32 may be AGB stars like those in the Galactic bulge. Still, when M, the M giants in the Frogel & Whitford sample tend to have bluer colors than the stars in M32, whereas many of the luminous Galactic disk AGB stars have colors that overlap with those of the brightest stars in M32. The peak M of AGB stars in M32 is M, and this is in reasonable agreement with the peak brightness in the Galactic disk sample in Figure 4, although there are three stars with M in the Le Bertre (1993) sample of oxygen-rich OH/IR stars that are not shown in Figure 4.
The Galactic disk AGB stars studied by Le Bertre (1992) are C stars, and the infrared SEDs of these objects are consistent with effective temperatures K, with the majority having effective temperatures K (Le Bertre 1997). That the brightest AGB stars in M32 have colors like Milky-Way C stars is potentially of interest, as Davidge (1990) found that of the integrated light from M32 near m comes from AGB stars, and that of the AGB light may come from C stars. Still, the colors of stars on the upper AGB in M32 are consistent with these objects having SEDs indicative of M giants, rather than C stars (Davidge et al. 2000). The possible existence of C stars in M32 is addressed further in §4.
4 THE STELLAR CONTENT IN THE CFHTIR FIELD
4.1 Photometric Measurements
The brightnesses of stars in the CFHTIR data were measured with the PSF-fitting program ALLSTAR (Stetson & Harris 1988), using co-ordinates and PSFs obtained from tasks in DAOPHOT (Stetson 1987). The photometric calibration was defined using standard stars from Hawarden et al. (2001), which were observed during the course of the three night observing run. The photometric calibration was checked against objects in the 2MASS point source catalogue (Cutri et al. 2003). These comparisons were restricted to stars with , which is the brightness range where the uncertainties in the 2MASS band measurements tend to be below mag. Moreover, to avoid the crowded main body of M32, these comparisons were further restricted to stars in the southern half of the CFHTIR field. The differences in brightness, in the sense 2MASS – CFHTIR, are , , and , where the quoted uncertainties are the standard errors of the mean. The photometric calibration of the CFHTIR data is thus consistent with the 2MASS measurements.
Completeness fractions and the random uncertainties in the photometric measurements were estimated by running artificial star experiments. The artificial stars were assigned colors that track the dominant red plume in the CMDs. There is a pronounced gradient in stellar density across the image, and so completeness and the random errors in the data vary with distance from the center of the galaxy. The completeness curves for stars that fall within projected major axis distances of 0.2 – 0.4 kpc and 0.8 – 1.0 kpc, which are the inner and outer radial intervals considered for the photometric analysis, are compared in the upper panel of Figure 5. Following the procedure used to construct LFs in §4.2, artificial stars were considered to be recovered only if they were detected in both and .
The completeness curves in Figure 5 show only modest differences due to stellar density. The completeness curve for the 0.8 – 1.0 kpc interval falls systematically above that for the 0.2 – 0.4 kpc interval, as expected given the difference in stellar density. Still, the brightnesses at which the completeness fraction is 50% differ by only a few tenths of a magnitude.
Crowding has an impact on the random uncertainties in the photometric measurements and the incidence of blending, in which star images merge and appear as a single object. While almost all stars in the CFHTIR data are likely blends, in the majority of cases a very bright star is blended with a very faint one, so that the impact on the photometric properties of the brighter star is minor. Only when two or more relativly bright stars merge together is the effect of blending significant in the present study.
The artificial star data can be used to investigate the effects of blending, and the statistic of interest is the difference between the actual and recovered stellar brightnesses, . The distribution of values at , which is near the brightness of the RGB-tip in M32 (Davidge 2000), for the 0.2 – 0.4 kpc and 0.8 – 1.0 kpc intervals are compared in the lower panel of Figure 5. While the two distributions both peak near , the distributions have very different widths. The distribution for the 0.2 – 0.4 kpc interval is much broader than that at larger radii, with a tail extending out to . While the distribution for the 0.8 – 1.0 kpc interval contains some stars with large , they represent a much smaller fraction of the total population than at smaller radii. The absence of stars with magnitude indicates that blending between stars of comparable brightness is likely not a major consideration at in the portion of the CFHTIR data that samples the outer regions of M32. However, blending at this brightness is significant in the 0.2 – 0.4 kpc interval. Consequently, the analysis of the CFHTIR data is restricted to stars with , which is well above the RGB-tip. The dispersion in at this brightness in the 0.2 – 0.4 kpc interval is roughly one-third that at , indicating that the effects of crowding are much reduced.
4.2 The Photometric Properties of AGB Stars in the Outer Regions of M32
The , , and CMDs of stars that are located between 0.2 – 0.4 kpc (52 – 104 arcsec), 0.4 – 0.6 kpc (104 – 156 arcsec), 0.6 – 0.8 kpc (156 – 208 arcsec), and 0.8 – 1.0 kpc (208 – 260 arcsec) from the center of M32, where the boundaries are projected distances along the major axis assuming an ellipticity of 0.15 (Kent 1987) and a distance modulus of 24.5, are shown in Figures 6, 7, and 8. The properties of stars within 0.2 kpc of the nucleus are not considered, as crowding becomes much more of an issue in that portion of the galaxy at the angular resolution of the CFHTIR data. Following conventional practice, the CO index is a color measurement found by subtracting the magnitudes recorded through the CO and continuum filters. The various radial intervals into which the data have been sorted subtend comparably sized areas on the CFHTIR image, and so any differences in the number of objects on the CMDs are driven by changes in stellar density on the sky, rather than differences in angular coverage.
The RGB-tip occurs near in M32 (Davidge 2000), and so the bright end of the red plume that dominates the CMDs in Figures 6 – 8 is made up of AGB stars. There is also a smattering of stars with in the two outer annuli. These objects have and CO , and we suspect that they are red supergiants in M31. These objects may be outlying members of stellar association A147, which lies to the south of M32, although the CFHTIR field does not overlap with the boundaries marked for A147 in the Hodge (1981) atlas.
The fraction of stars in each annulus that are interlopers from M31 increases towards larger distances from the center of M32. However, using surface brightness measurements made from the 2MASS Nearby Galaxy Catalogue (Jarrett et al. 2003) band image of M31, it is found that nowhere in the CFHTIR field do stars belonging to M31 dominate. In the 0.8 – 1.0 kpc interval, where the fractional contamination from M31 is largest, surface brightness measurements of M32 and the surrounding areas indicate that the expected ratio of M32 to M31 stars is at least 3:1. This ratio climbs quickly towards smaller galacocentric distances. In the 0.6 – 0.8 kpc interval the ratio of M32 to M31 stars is at least 5:1, while in the 0.4 – 0.6 kpc interval it is at least 9:1. There is a modest gradient in the density of M31 stars across the CFHTIR field, and this introduces a potential source of uncertainty in the amount of contamination from M31. However, the change in surface brightness between the northern and southern edges of the CFHTIR field is only mag arcsec-2, and this does not have a major impact on the estimated level of contamination. In future studies it would be of interest to place tighter constraints on the number of stars that belong to M31 by observing a control field that is well separated from M32. Kinematic measurements may also provide a means of identifying objects that do not belong to M32.
While the AGB sequences in Figures 6 and 7 are relatively narrow, there is a population of objects to the right of the upper AGB. Carbon stars form a spray of objects redward of the M giant sequence on the and CMDs of moderately metal-poor systems with intermediate-age populations (e.g. Davidge 2003; 2005). Indeed, the majority of stars with in the LMC are C stars (e.g. Hughes & Wood 1990). Freedman (1992) found very red objects in the outer regions of M32, which she suggested may be C stars. Davidge (2000) noted that similar objects were not present in his data, although the modest field coverage meant that rare stars may have gone undetected. The current data cover a much larger field of view, and so can be used to re-visit the issue of very red stars in M32.
The portions of the CMDs with and M, where the latter is the faint cut-off defined by Davidge (2005) for investigating C stars in the dE companions of M31, are indicated in Figure 7. The number of stars in the C star region increases towards smaller radii, suggesting that these objects belong to M32, rather than M31. The objects in the C star region of the CMDs have CO indices that are consistent with them being evolved, late-type stars. This is demonstrated in Figure 9, which shows the two-color diagram (TCD) of objects with M. The reddest stars have CO indices that stay roughly constant when , with . The mean CO index of the very red stars also does not change with radius.
In §3, we discussed a population of luminous red stars near the center of M32. The colors of these objects are redder than those of optically selected M giants in the Galactic bulge, suggesting that they are embedded in dusty circumstellar envelopes. Are similar stars seen in the portion of M32 that was imaged with the CFHTIR? If these stars are present then they will appear as very red objects in the and CMDs, with band brightnesses that are well below the AGB-tip defined by bluer stars.
As it turns out, the reddest stars in the CMDs are probably not the counterparts of the stars with very red colors seen near the center of M32. The stars with studied by Le Bertre (1992; 1993), which have colors and brightnesses that are similar to the most evolved M giants in the Galactic bulge, typically have , whereas the stars with typically have , with the reddest object having ; these results hold for both the C stars studied by Le Bertre (1992) and the oxygen-rich stars studied by Le Bertre (1993). The majority of red stars in the CFHTIR data in Figure 9 have , and so would be expected to have . The failure to detect stars with in the CFHTIR data does not mean that such very red stars are absent; rather, objects with very red colors are difficult to detect because they are faint, especially in , and so there is a bias against detection. A wide-field survey of the outer regions of M32 in will provide a means of determining if a population of very red stars like those detected near the center of M32 is present throughout the main body of the galaxy.
4.3 A Search for Radial Trends
4.3.1 Isochrones and Predicted AGB Properties
The near-infrared photometric properties of AGB stars depend on age and metallicity, and these dependences are examined in Figure 10, where selected near-infrared isochrones from Girardi et al. (2002) are compared. These isochrones were constructed from the models described by Marigo & Girardi (2001), and include a semi-analytical treatment of the thermally pulsing AGB. The models do not include circumstellar extinction, and so heavily obscured stars, such as those found near the center of M32 (§3), are not considered.
A comparison with the CMD of the 0.2 – 0.4 kpc interval in the right hand panel of Figure 10 indicates that the 1 Gyr model roughly matches the AGB-tip brightness in this portion of M32. Nevertheless, the agreement between the observations and models is far from perfect, as there is a magnitude offset in . This is not a metallicity effect, as models with higher metallicity have colors that are only a few hundredths of a magnitude redder than the solar metallicity sequence. It is also worth noting that while the scatter in the colors of stars in the kpc interval appears to suggest that there may be a spread in age and/or metallicity, it is demonstrated below that this scatter is mainly due to observational errors.
An important caveat when estimating age from the AGB-tip is that many of the brightest AGB stars in M32 are LPVs (Davidge & Rigaut 2004), and this blurs the age sensitivity of this feature. The models predict that the AGB-tip brightness in will change by magnitude per 0.3 dex change in age between 1 and 8 Gyr. If the brightest AGB stars have magnitude photometric variations in (e.g. Davidge & Rigaut 2004), then the actual AGB-tip may occur as faint as , and thus correspond to an age Gyr.
4.3.2 The Colors of AGB Stars
The comparisons in the middle panel of Figure 10 indicate that while the brightness of the AGB-tip is only mildly sensitive to metallicity, the color changes by magnitudes when dex. The mean , , and CO colors of stars with between 16.5 and 17.5 in each distance interval, computed by applying an iterative rejection routine to suppress outliers, are listed in Table 1. The estimated uncertainties in the mean values are over an order of magnitude smaller than what is expected if metallicity changes by 0.3 dex; hence, these data should be sensitive to modest radial metallicity variations in the AGB population. It is also worth noting that the colors in Table 1 are considerably redder than the integrated colors that have been measured for M32, which fall between and 0.9 (Frogel et al. 1978; Peletier et al. 1993). This is not surprising, as the color listed in Table 1 is that of the brightest AGB stars, which will be redder than the integrated colors of the galaxy.
There is no evidence for systematic radial trends in the mean broad-band colors in Table 1. The entries in the second column of Table 1 constitute a simple control measurement, as the color has only a modest sensitivity to age and metallicity when compared with colors that span a broader wavelength interval. It is thus reassuring that is constant with radius. also shows no evidence for radial trends, suggesting that if there is a metallicity gradient then it must be modest among AGB stars in the outer regions of M32. For comparison, in the and kpc intervals differ at the level, whereas in the and intervals is smaller than the mean of the outer two intervals. However, based on the individual entries in Table 1, there is no evidence for a systematic gradient in the CO index.
An examination of the color distributions provides additional insights into radial trends in stellar content. In Figure 11 the color distributions of stars with between 16.5 and 17 in the 0.2 – 0.4 kpc and 0.8 – 1.0 kpc intervals, normalized to the number of stars in each interval, are compared. Also shown is the distribution defined by all stars in this brightness range in the full 0.2 – 1.0 kpc interval. The range of stellar brightnesses used to construct these distributions is a compromise between the needs (1) to have a reasonable number of stars per distance interval, (2) to keep the random errors in the photometry modest in size, and (3) to include AGB stars that span a range of ages; in regard to the last point, the brightness interval used here includes stars with ages Gyr (e.g. Figure 10).
The dotted line in each panel shows the distribution expected for a simple stellar system that is broadened only by random photometric errors, as predicted from the artificial star experiments. The effects of crowding are much less pronounced at this brightness than at (§4.1), and the random errors in the photometry are only slightly larger in the 0.2 – 0.4 kpc interval than in the 0.8 – 1.0 kpc interval. This being said, the distributions in both radial intervals are significantly wider than expected if random errors in the photometry were the only source of scatter, indicating that there is a real dispersion in the colors of the brightest AGB stars.
A comparison with the Girardi et al. (2002) isochrones indicates that the widths of the color distributions in Figure 11 are consistent with a dex spread in metallicity. However, other factors may contribute to broadening the color distributions. A large fraction () of the AGB population near the center of M32 are LPVs (Davidge & Rigaut 2004), and the color variations that occur throughout the light cycles of these objects can reproduce the observed dispersion along the axis. To demonstrate this point, we consider the colors of LPVs in the Sgr I field that were studied by Glass et al. (1995), and are based on observations made at a single epoch. In accordance with the range in intrinsic brightnesses used to construct the color curves in Figure 11, only those datapoints in the Sgr I dataset that have MK between –7.5 and –8.0 are considered.
The LPVs in the Sgr I sample have a broad range of intrinsic colors, due in part to differences in line of sight reddening, metallicity, and/or age. As the goal of the current exercise is to investigate the color variations due to stellar variability, these star-to-star differences in mean color should be removed. This was done by computing a mean color for those LPVs with three or more measurements with MK between –7.5 and –8.0, and then calculating the difference between the individual measurements and the mean color, . The standard deviation of all values is magnitude, and this was adopted as the dispersion in due to variability.
Knowing the color variation inherent to LPVs as they cycle through their photometric phases, then a model color distribution can be constructed. This model must also include the effects of observational errors and the presence of non-LPVs. The non-variable population was simply modeled as a gaussian with a width comparable to that expected from photometric errors. To account for observational errors in the LPV model, a gaussian with a standard deviation was convolved with the photometric error distribution predicted by the artificial star experiments. The LPV and non-LPV components were then added together with various LPV fractions.
The simulated color distributions are compared with the measured distributions in Figure 12. Davidge & Rigaut (2004) found that 80% of the bright AGB stars near the center of M32 are LPVs. While an 80% LPV model provides a reasonable match to the distribution of stars in the 0.2 – 0.4 kpc interval, it overestimates the width of the 0.8 – 1.0 kpc distribution. A better match to the 0.8 – 1.0 kpc distribution is obtained if roughly 50% of the stars are LPVs. Radial differences in the LPV content notwithstanding, the comparisons in Figure 12 indicate that the widths of the color distributions in Figure 11 may be dominated by stellar variability, rather than the presence of stars spanning a range of ages and/or metallicities. The stars on the upper AGB of M32 may then have only a very modest (i.e. dex) dispersion in metallicity.
The dispersion in the CO indices is dominated by random errors. This is demonstrated in Figure 13, where the distribution of CO indices in the 0.2 – 0.4 and 0.8 – 1.0 kpc intervals are compared. The CO distributions in both intervals are consistent with a peak CO index near 0.3, and a tail of objects with higher than average CO indices. It is evident that the distributions in Figure 13 are dominated by the large random errors in the photometric measurements, and the annulus-to-annulus differences in mean CO index in Table 1 are likely not significant.
4.3.3 The Relative Numbers of AGB Stars
The number density of bright AGB stars per unit integrated mass in composite stellar systems is an age diagnostic. In the present study surface brightness is used as a proxy for projected mass density. The LFs obtained from the CMDs of each distance interval, scaled to the number counts expected for a system with M, based on the surface photometry from Kent (1987), and M, based on the 2MASS Extended Source Catalog (Jarrett et al. 2003), are compared in Figures 14 and 15. The 2MASS surface brightness profiles of M32 become progressively noisier when arcsec, and so the comparisons in Figure 15 do not include the two most distant annuli in the CFHTIR data.
The integrated light measurements in the and filters are dominated by stars at different evolutionary stages. The integrated band light is dominated by stars on the sub-giant branch and near the MSTO, rather than the very bright AGB stars that we have resolved in M32. On the other hand, the integrated band light is dominated by highly evolved stars (e.g. Davidge 1990), and so the number of bright AGB stars would be expected to scale well with band brightness.
The comparisons in Figures 14 and 15 indicate that the number density of bright AGB stars in M32 stays remarkably constant out to galactocentric distances of at least 1.0 kpc. This agreement extends into the central regions of M32, as the LF for stars with projectected distances parsecs from the center of M32 agrees with the LF obtained from data with kpc after correcting for differences in the integrated brightness. The comparisons in Figure 14 also indicate that the apparent decline in peak AGB brightness when kpc from the nucleus is not significant, as the average number of stars brighter than M in the 0.6 – 0.8 kpc and 0.8 – 1.0 kpc intervals agrees with that expected from the counts in the 0.2 – 1.0 kpc interval. Thus, there is no evidence that the peak band AGB-tip brightness drops with radius in M32; rather, the number counts along the upper AGB are consistent with no gradient in mean age.
We close this section by noting that Choi et al. (2002) found that the light profile of M32 deviates from an R1/4 law at 150 arcsec, which corresponds to a projected distance kpc. This change in the light profile is accompanied by a change in the isophotal ellipticity. The CFHTIR data show no evidence for a change in the number density or photometric properties of the brightest AGB stars at this distance. The physical processes responsible for this structural change have evidently not affected the bright AGB content.
5 COMPARISONS WITH STARS IN THE BULGE OF M31
5.1 Motivation, Field Selection, and Photometric Measurements
Davidge (2001) found that while the AGB sequences in M32 and the inner bulge of M31 have similar peak band brightnesses, the number density of bright AGB stars in these systems differ, in the sense that M32 is deficient in stars below the AGB-tip when compared with the inner bulge of M31 after scaling to account for differences in the integrated brightnesses of the areas studied. An important caveat is that this comparison relies on data that sample very different environments, with the M31 observations sampling the innermost regions of the bulge, and the M32 observations sampling a field that is over 2 arcmin from the center of the galaxy. This difference in environment is potentially significant, as the central regions of many bulges harbour photometrically distinct nuclei (e.g. Carollo et al. 2002), and so the AGB content of the inner bulge of M31 may not be representative of the entire bulge. Thus, it is of interest to compare the stellar contents of M32 and the bulge of M31 using data that probe regions with similar surface brightness, and so a field in the outer bulge of M31 was observed with CFHTIR during the November 2002 observing run.
Crowding has had a significant impact on previous efforts to study the stellar content of the M31 bulge (e.g. discussion in Stephens et al. 2003), and the location of the M31 CFHTIR field was selected to be a compromise between the needs to sample (1) the bulge at a point where crowding should not be a factor among the brightest stars during good ground-based seeing conditions, and (2) an area that is dominated by bulge stars. The ‘small bulge’ decomposition model of Kent (1989) indicates that the surface brightness of the bulge in the center of the CFHTIR field is 19 mag arcsec-2 in the band, while that of the disk is 20.4 mag arcsec-2; in other words, stars in the bulge outnumber those in the disk by in the CFHTIR pointing. Hence, the majority of stars in the CFHTIR dataset belong to the bulge of M31.
The photometric analysis of the M31 CFHTIR data followed the procedures described in §4.1, including the use of artificial star experiments to assess random errors in the photometry and estimate completeness. The artificial star experiments indicate that 50% completeness occurs when . This is brighter than in the M32 data (§4.1), and is a consequence of the relatively high stellar density throughout most (but not all – see below) of the M31 CFHTIR field.
5.2 Comparisons with M32
The M31 CFHTIR field was divided into three radial intervals, corresponding to projected distances along the minor axis of 0.5 – 0.8 kpc (130 – 208 arcsec), 0.8 – 1.1 kpc (208 – 286 arcsec), and 1.1 – 1.4 kpc (286 – 364 arcsec). The , , and CMDs of sources in these intervals are shown in Figures 16, 17, and 18. The artificial star experiments predict that some of the brightest stars in the 0.5 – 0.8 kpc CMDs may be blends. To avoid potential problems due to blending and focus on a region that has an integrated band surface brightness that is comparable to that in the kpc interval in M32, only the data in the 1.1 – 1.4 kpc interval is considered further. The brightest AGB stars in this portion of the M31 CFHTIR field have , which is within a few tenths of a magnitude of the peak AGB brightness near the center of M31 (Davidge 2001) and in M32.
The and CO color distributions of stars with between 16.5 and 17 in the 1.1 – 1.4 kpc interval are shown in Figure 19. The mean color of stars in the M31 field is comparable to what is seen in M32. Moreover, as was the case in the kpc interval in M32, the distribution can be matched by a model that combines random photometric errors estimated from artificial star experiments with a population of AGB stars in which 80% are LPVs.
The CO index in the lower panel of Figure 19 shows the tail of high-CO index stars that was also seen in the M32 CO distribution. In fact, the CO distributions of the two galaxies are very similar. This is demonstrated in the lower panel of Figure 19, where the dotted line is the CO distribution of stars in M32 in the 0.2 – 0.4 kpc interval, but shifted along the horizontal axis so that the peak matches the peak of the M31 distribution. The shift applied to these data is within the estimated uncertainties in the photometric calibration; therefore, the need to shift the two distributions is likely not due to a real difference in the mean CO indices of the two systems, but is a consequence of uncertainties in the calibration.
The LF of stars in the 1.1 – 1.4 kpc distance interval in M31 is compared in Figure 20 with the LF of stars in the 0.2 – 0.4 kpc interval in M32. The LFs have been normalized so that the star counts correspond to M (top panel) and M (lower panel). The normalizations were done using surface brightness measurements from Kent (1987) and Jarrett et al. (2003). The LFs are offset by a significant amount along the vertical axes, with the difference growing towards brighter magnitudes. These comparisons indicate that the outer regions of M32 have a higher density of bright AGB stars per integrated brightness than the outer bulge of M31. Such a difference would occur if M32 and the outer bulge of M31 have different mean ages, and this possibility is discussed further in §6.
6 DISCUSSION & SUMMARY
Broad- and narrow-band images spanning the m wavelength interval have been used to probe the bright AGB content of M32. Data recorded in with NIRI on Gemini North are used to conduct the first study of individual stars in M32 at wavelengths longward of m. The data cover projected distances out to parsecs from the galaxy center, and provide a means of identifying the most evolved AGB stars, which may be difficult to detect at visible and near-infrared wavelengths if they are embedded in dusty circumstellar envelopes. Images recorded through and narrow-band filters of a field immediately south of the M32 nucleus with the CFHTIR sample roughly 25% of the galaxy at projected major axis distances between 0.2 and 1.0 kpc. These data are used to investigate the radial properties of the bright stellar content in M32.
A prime motivation for the study of the resolved stellar content of nearby galaxies is that direct comparisons can be made with predictions from the analysis of integrated light spectra. The three main results of this paper that relate to this motivation are as follows. First, there are luminous AGB stars near the center of M32 with m photometric properties that are similar to those of the most luminous AGB stars in the disk of the Milky-Way; these objects are likely intermediate-age AGB stars. Second, the bright AGB content of M32 in the band is well mixed throughout the main body of the galaxy. This result, which confirms earlier findings that were based on data covering much smaller areas, is contrary to what would be expected if there were a radial age gradient throughout the main body of the galaxy. Third, while the AGB sequences in M32 and the outer bulge of M31 have similar band peak brightnesses, and possibly even similar LPV fractions, the number of bright AGB stars per unit integrated light is higher in M32 than in the outer bulge of M31; this is indicative of a difference in stellar content. These results are discussed in the remainder of this section.
6.1 An Intermediate Age Component in M32
The integrated light spectrum of M32 at visible wavelengths contains signatures of an intermediate age population (e.g. Worthey 2004; Rose et al. 2005 and references therein), and the properties of the brightest resolved stars in M32 verify that such a component is present. Spectra taken at visible wavelengths provide important leverage for measuring age because stars near the MSTO contribute significantly to the integrated light at these wavelengths. One of the pieces of information that can be obtained from the analysis of integrated light spectra at near-infrared wavelengths is the contribution that AGB stars make to the total system light, which is a function of age. Models generated by Maraston (1998) indicate that the AGB contribution in the band peaks near an age of 1 Gyr, where it can produce 80% of the total light. The predicted AGB contribution drops to 50% for an age of 3 Gyr, and 10% for an age 6 Gyr. Davidge (1990) modeled the integrated spectrum of the center of M32 in the m interval and found that of the integrated band light comes from AGB stars. This result, which is evidence for an intermediate age population, can be checked directly using the number counts of AGB stars measured from the CFHTIR data.
The total light from AGB stars was found by integrating the band LF above the RGB-tip and comparing the result with the integrated band light in the area surveyed, which was computed from 2MASS data (Jarrett et al. 2003). Assuming that (1) the RGB-tip occurs at (Davidge 2000), and (2) the AGB can be modeled as a power law, based on the LF entries between and 17.0, which is the brightness at which incompleteness sets in at smaller radii (§4), then we find that the AGB accounts for of the total band light. This agrees with the AGB contribution computed by Davidge (1990), and is indicative of a relatively young photometrically-weighted age for M32. The solar metallicity models generated by Maraston (1998) predict that this AGB contribution is indicative of ages in the range log(t. When combined with the additional constraint that there are no MSTO stars with ages Gyr (Worthey et al. 2004), then a tighter age range log(t (i.e. Gyr) results.
Stars near the AGB-tip are potentially important age probes, as they stand out with respect to the fainter, but more numerous, body of stars in a galaxy. The AGB-tip can be studied in areas where fainter age diagnostics, such as the morphology of the horizontal branch or the brightness of the MSTO, can not be detected. Complicating factors when using the AGB-tip brightness as an age estimator are that (1) the brightest AGB stars are relatively rare, and so a large area must be sampled to obtain a representative census – this is likely the cause of the apparent drop in AGB-tip brightness in the CFHTIR CMDs when kpc (§4), and (2) a large fraction of the brightest AGB stars are LPVs with amplitudes approaching a magnitude in . Both of these factors blur the ability to measure the AGB-tip, and hence deduce ages. Davidge (2000) compared the near-infrared CMDs of the brightest AGB stars in M32 with theoretical isochrones and concluded that these objects have an age of a few Gyr. This is consistent with comparisons that are made with isochrones in §4. If photometric variability is such that the brightest stars at the peak of their light curves appear magnitudes in above the AGB-tip of non-variable sources, then comparisons with isochrones indicate that this may cause ages to be underestimated by a few Gyr.
Mass that is lost from AGB stars may accumulate in circumstellar envelopes, and the extinction that can result from dust in these envelopes may also affect age estimates, as the most luminous AGB stars may be missed in surveys conducted at wavelengths where dust absorption is significant. The amount of material in envelopes is expected to depend on the mass of the progenitor, in the sense that envelope mass will increase with progenitor mass. Circumstellar dust will attenuate visible/near-infrared light from the star, and AGB stars in thick envelopes will thus appear as heavily reddened sources with a dominant thermal emission spectrum at wavelengths longward of m from heated dust grains.
In §3 it was shown that the central regions of M32 contain a population of stars with colors and peak brightnesses that are similar to those of the brightest AGB stars in the disk of the Milky-Way. The photometric properties of the majority of bright AGB stars in M32 differ from those of the brightest AGB stars in the Galactic bulge and the bulge of M31 (Davidge et al. 2006), in that they have higher brightnesses and redder colors. The bright objects detected in M32 are almost certainly intermediate-age AGB stars.
The colors of the bright AGB stars in M32 suggest that they are embedded in dusty shells, and so are subject to heavy circumstellar extinction. Therefore, they will appear in near-infrared CMDs as red objects, likely falling below the AGB-tip defined by lower mass, but less reddened, objects. A population of red objects below the AGB-tip and to the right of the AGB sequence is seen in the CFHTIR CMDs, although it was argued in §4 that these objects are likely not the counterparts of the luminous AGB stars seen near the center of M32, as their colors are too small. It was further noted in §4 that luminous AGB stars like those found near the center of M32 may be too faint to detect with the CFHTIR observations. An imaging survey of the outer regions of M32 in should reveal if objects like those found near the center of M32 are also present at large radii.
C stars are among the most conspicuous signatures of an intermediate-age population. Surveys of C stars in nearby galaxies suggest that the C/M ratio is a function of metallicity (e.g. Battinelli & Demers 2005 and references therein). This trend is reproduced by models that track evolution on the thermally-pulsing AGB (e.g. Mouhcine & Lançon 2003a), and is due to a lower efficiency for C star formation as metallicity grows. The Mouhcine & Lançon (2003a) models predict that C stars will form in a Z=0.02 system, although the C/M ratio will be lower than in a Z=0.008 system with the same age. Therefore, despite a relatively high mean metallicity, C stars might be expected in M32 if the progenitor population has a suitable age and size.
Davidge (1990) found that the best agreement between the modeled and observed near-infrared spectrum of M32 was obtained if of the AGB light comes from C stars, as opposed to an AGB component that consists entirely of M giants. While conspicuous signatures of C stars, such as the Ballick-Ramsey C2 band at m, are not evident in the composite M32 band spectrum obtained by Davidge (1990), these may be difficult to detect if blended with other molecular features, at least at moderately low spectral resolutions. The C star contribution predicted by Davidge (1990) is not greatly different from what is found in intermediate age LMC clusters with mean metallicities that are not too much lower than that inferred for M32 (Maraston 1998).
The evidence for C stars in the resolved stellar content of M32 is more tenuous. In §3 it was argued that while the brightest stars in near the center of M32 have colors that are similar to those of C stars in the disk of the Milky-Way, they have colors suggesting that they are obscured M giants. The nature of these stars could be investigated further with moderate-resolution spectra spanning the m wavelength interval. C stars have a prominent absorption feature due to C2H HCN at m (Ridgeway, Carbon, & Hall 1978) that is seen even in highly reddened C stars (e.g. Le Bertre et al. 2005), although circumstellar emission may cause these features to be veiled (Matsuura et al. 2005). For comparison, the m spectra of moderately metal-poor M giants are almost featureless (Matsuura et al. 2005). While well known spectral signatures that can be used to distinguish between C and M stars are present at shorter wavelengths, it may prove difficult to obtain spectra of the objects near the center of M32 at wavelengths shortward of m because the targets are fainter at these wavelengths, and are more susceptible to blending with unreddened stars.
6.2 Is There An Age Gradient in M32?
Based on the strengths of absorption features in the integrated visible light spectrum of M32, Worthey (2004) and Rose et al. (2005) conclude that mean age and metallicity vary with radius, in the sense that older, more metal-poor populations occur at larger radii. In the current paper, three properties of AGB stars – their peak brightness, their relative numbers per unit integrated brightness, and the histogram distribution of their broad-band colors – are considered together to assess if age changes with radius in M32. The data used by Davidge et al. (2000), which resolve the brightest stars within a few arcsec of the galaxy center, have been used to bridge the spatial coverage of the spectroscopic and CFHTIR datasets. The results suggest that age does not vary with radius, and that the population traced by the brightest AGB stars are very well mixed throughout the galaxy. Lacking observations of RGB stars, little can be said about a metallicity gradient in M32 based on the present data, save that the brightest AGB stars appear to have the same metallicity at all radii.
The brightest AGB stars in M32 have , and stars of this brightness are seen out to projected distances along the semi-major axis of at least 0.6 kpc. While the peak brightness of the CMDs appear to drop when kpc, this is likely a consequence of small number statistics (§4). The presence of AGB stars with the same peak brightness does not in itself argue against an age gradient, as the number of these objects per unit integrated mass, and hence the mean age, could still change with radius. Rather, when considered on its own, a constant peak brightness near indicates only that an intermediate age population is present throughout M32.
The relative number of AGB stars per unit integrated mass is a robust means of determining if there is a radial age gradient. Consider a hypothetical system that is made up of two populations, one of which is ‘old’, containing an AGB component that is not much brighter than the RGB-tip, and the other ‘young’, containing an extended bright AGB sequence. If the younger population is more centrally concentrated than the older population then mean age grows with increasing distance from the center of the system, and the number density of the brightest AGB stars with respect to the total mass of stars in a given radial interval drops with increasing radius.
While the ratio of AGB stars to total mass is an age diagnostic, in the absence of suitable dynamical measurements then one is forced to use integrated brightness as a proxy for mass, as has been done in Figures 14 and 15. Complications arise because the M/L ratio of an integrated system depends on its mean age, in the sense that the M/L ratio becomes smaller towards progressively younger ages. A change in M/L ratio due to age may compensate to some extent for a drop in the number density of bright AGB stars with respect to fainter objects.
The issue of the age-dependence of the M/L ratio notwithstanding, if there were an age gradient in M32 then the good agreement between the LFs shown in Figure 14 would require that age change radially in such a finely tuned way that the M/L ratio compensates for any differences in the fractional contribution that the brightest AGB stars make to the total light. The uncertainty due to the age dependence of the M/L ratio can be further mitigated by normalizing the LFs to integrated brightnesses in different filters, as the M/L sensitivity to age is wavelength dependent. For example, the models considered by Mouhcine and Lançon (2003b) indicate that the M/L ratio in changes by 0.9 dex when age changes from 1 Gyr to 10 Gyr, while the M/L ratio in changes by only 0.5 dex over the same age range. It is then significant that the number of AGB stars per unit band light, shown in Figure 15, does not change with radius in M32. When considered together, the results in Figures 14 and 15 then indicate that mean age likely does not increase towards larger galactocentric distances in M32, contrary to what was found by Worthey (2004) and Rose et al. (2005).
The color distribution of stars in a given brightness interval is also sensitive to the dispersion in age and metallicity. In Figure 12 it was demonstrated that the spread in the colors of bright AGB stars in M32 can be explained by a combination of photometric errors and the changes in color experienced by LPVs as they cycle through their light curves. That these two effects can largely account for the observed dispersion in color suggests that the brightest AGB stars in M32 likely have only a modest range in age and metallicity. The mean color of bright AGB stars does not change with radius, suggesting that the mean metallicity of the bright AGB component also does not change with radius.
The shape of the distribution may change with radius, in the sense that the number of stars that are LPVs and/or the amplitude range of LPVs may drop with radius; as discussed in §4, the fractional LPV content in the kpc interval may be smaller than that in the kpc interval. A trend of decreasing LPV content with increasing radius is seen in NGC 5128 (Rejkuba et al. 2003). The amplitude and period distributions of LPVs will provide additional insights into the stellar content of the outer regions of M32. While a determination of the period distribution will require multi-epoch observations, the fraction of LPVs and their amplitude distributions could be probed directly with only a single second epoch observation of the CFHTIR field by applying the procedure described by Davidge & Rigaut (2004) to determine the fraction of LPVs as a function of radius.
The CO index, which measures the strength of the first overtone CO (2-0) bandhead, is used in the current paper as an additional probe of the nature of the brightest AGB stars in M32. The brightest AGB stars are found to have uniform CO strengths throughout M32, further reinforcing the notion that these stars come from a population that is well mixed throughout the galaxy. The integrated band light from M32 is dominated by AGB stars (e.g. Davidge 1990 and §6.1), and so the absence of a gradient in the CO indices of the brightest AGB stars is consistent with the flat CO color profile seen in the integrated light of this galaxy (Peletier 1993).
Based on the properties of the brightest AGB stars, we conclude that there is no evidence for a radial age gradient in M32. While the results of this paper challenge the conclusion reached by Worthey (2004) and Rose et al. (2005) that mean age changes with radius in M32, population gradients do occur in this galaxy, as the strengths of absorption features in the integrated spectrum change with radius (e.g. Worthey 2004; Rose et al. 2005). There is also evidence for a mild UV color gradient in M32, that is reminiscent of what is seen in classical ellipticals (e.g. de Paz et al. 2005). We note in passing that since there is no evidence for a gradient in the properties of the brightest AGB stars then the cause of the UV gradient is likely not tied to the brightest AGB stars or their descendants. We emphasize that the CFHTIR data do not place firm limits on the radial variation of mean metallicity, as the RGB is not sampled. It thus remains to be determined if metallicity is the prime driver behind the population gradients in M32.
6.3 Comparing the Stellar Contents of M32 and the Bulge of M31
Bica et al. (1990) compare the stellar contents of M32 and the bulge of M31 using spectra of both galaxies that were obtained with the same instrument and were analysed using the same technique. They find that a range of ages are present in the central regions of M31, and that while the dominant component is old and metal-rich, a very young component is also present. While a component with properties that are similar to the intermediate age population in M32 is present in M31, its contribution to the integrated band light is only one half what it is in M32. The analysis of these spectra thus predict that M32 has a younger mean age than the bulge of M31.
How does this compare with the resolved stellar content? We find that the most luminous AGB stars near the center of M32 have M and colors that are similar to the brightest AGB stars in the disk of the Milky-Way, while the most luminous AGB stars near the center of M31 have M and that are similar to stars in the Galactic bulge (Davidge et al. 2006). This suggests that the center of M32 contains stars that are younger than those near the center of M31. This does not agree with the analysis of the Bica et al. (1990) spectra, which predicts that there is a very young component near the center of M31 but not in M32. Moreover, working in the band, Davidge (2001) found a higher number density of bright AGB stars in the inner bulge of M31 than in the outer regions of M32, which is suggestive of a centrally-concentrated intermediate-age population that is larger in size in M31 than in M32. The seemingly contradictory results that are drawn from the measurements in §3 and the comparison conducted by Davidge (2001) can be reconciled if (1) the center of M32 contains younger stars than in M31 but (2) the overall density of stars that formed during intermediate epochs is smaller in M32 than in the inner bulge of M31. Such a star-forming history is not consistent with the Bica et al. (1990) results.
There are absorption line gradients in the bulge of M31 that are indicative of radial changes in both age and metallicity (e.g. Davidge 1997), and Puzia, Perrett, & Bridges (2005) find that the bulge of M31 has spectroscopic characteristics at large radii that are indicative of an old system, with an age that is comparable to that of the oldest M31 globular clusters. The comparisons in Figure 20 indicate that the outer bulge of M31 is deficient in stars below the AGB-tip when compared with M32. This deficiency occurs when the data are normalized both in and , and so is not a consequence of problems with the surface photometry. The comparisons in Figure 20 are suggestive of a difference in mean age, although M32 and the bulge of M31 may contain stars spanning a similar range of ages. More specifically, while the two systems appear to have different peak brightnesses, the number of bright AGB stars is much lower in the outer bulge of M31 than in M32, and so stochastic effects may cause the peak brightness in M31 to be underestimated. Thus, the outer bulge of M31 may contain a component with an age that is similar to that of the brightest AGB stars in M32.
The comparisons in Figure 20 suggest that M32 and the outer bulge of M31 have had different star forming histories. The two LFs become significantly different near , which corresponds to M. An AGB star in a solar metallicity system with an age Gyr would have such a peak brightness, although there is uncertainty introduced by photometric variability among AGB stars. The uncertainty in the relation between peak AGB brightness and age notwithstanding, it appears that the star forming histories of M32 and the outer bulge of M31 have differed over a significant fraction of their lifetimes.
6.4 Implications for the Evolution of M32
The radial distribution of stars in galaxies provides insight into the past evolution of these systems. A remarkable property of M32 is that the brightest AGB stars are mixed uniformly throughout the galaxy, and this must be explained by any model of its past history. It has been suggested that M32 may have once been a disk system that was disrupted by interactions with M31 (Bekki et al. 2001; Graham 2002). In the context of such a model the bright AGB stars may be the remnant of the last burst of star formation in a now defunct disk around M32, while the older substrate is the remnant bulge. Although involving a more extreme case, simulations that explore the interaction between a supposed progenitor of Cen and the Galaxy support the feasibility of this interpretation, and indicate that tidal interactions can mix stars throughout the smaller system. Simulations indicate that the core of the Cen progenitor can remain intact, while the surrounding disk is largely disrupted, but not before being tidally stirred (e.g. Bekki & Freeman 2003). While such a process may mix a recently formed population uniformly throughout M32, it might also be expected to mix populations that were already in place, and thereby flatten any metallicity gradients that may have been present in the bulge of the M32 progenitor. If such mixing did occur then parameters other than mean age and mean metallicity may be responsible for the absorption line gradients in M32.
If there have been major interactions between M31 and M32 then one might expect to see material stripped from M32 that is being assimilated by M31. Ferguson et al. (2002) discuss reasons why M32 might be the origin of at least some of the material in streams detected around M31, although there are potential kinematic difficulties with M32 being the origin of the giant stream (Ibata et al. 2004). The material stripped from M32 may not be restricted to individual stars, and it is worth noting in this regard that M32 is completely devoid of globular clusters. Beasley et al. (2005) and Puzia et al. (2005) find that some M31 globular clusters have ages that overlap with the youngest populations in M32, and these clusters appear to share a common evolutionary heritage with M32 that is distinct from that of M31. In particular, the chemical mixtures in M32 and the intermediate age M31 clusters are similar, and the integrated light spectra of the clusters lack the strong CN bands that are the hallmark of other M31 clusters and the bulge of M31, but are absent in the integrated spectrum of M32. Comparisons with nearby spiral galaxies suggests that strong CN absorption, which may be due to an overabundance of nitrogen, is a unique characteristic of the M31 globular cluster system (Puzia et al. 2005).
Beasley et al. (2005) argue that the intermediate age M31 clusters are too metal-poor to be associated with M32, and suggest that they may have originated in NGC 205. However, Puzia et al. (2005) find intermediate age clusters that are moderately metal-rich. The C star content of NGC 205 also indicates that it likely did not experience a large burst of star formation during the past few Gyr (Davidge 2005). Given the evidence at hand, it may be premature to reject the possibility that the intermediate age clusters in M31 either formed in M32 or from gas and dust that was stripped from M32.
| Major Axis | |||
|---|---|---|---|
| Distance (kpc) | |||
| 0.2 – 0.4 | |||
| 0.4 – 0.6 | |||
| 0.6 – 0.8 | |||
| 0.8 – 1.0 |
References
- (1)
- (2) Alonso-Garcia, J., Mateo, M., & Worthey, G. 2004, AJ, 127, 868
- (3)
- (4) Battinelli, P., & Demers, S. 2005, A&A, 434, 657
- (5)
- (6) Beasley, M. A. et al. 2005, AJ, 129, 1412
- (7)
- (8) Bekki, K., & freeman, K. C. 2003, MNRAS, 346, L11
- (9)
- (10) Bekki, K., Couch, W. J., Drinkwater, M. J., & Gregg, M. D. 2001, ApJ, 557, L39
- (11)
- (12) Bellazzini, M., Cacciari, C., Federici, L., Fusi Pecci, F., & Rich, M. 2003, A&A, 405, 867
- (13)
- (14) Bica, E., Alloin, D., & Schmidt, A. A. 1990, A&A, 228, 23
- (15)
- (16) Blanco, V. M. 1986, AJ, 91, 290
- (17)
- (18) Burkert, A. 1994, MNRAS, 266, 877
- (19)
- (20) Byrd, G. G. 1978, ApJ, 226, 70
- (21)
- (22) Carollo, C. M., Stiavelli, M., Seigar, M., de Zeeuw, T., & Dejonghe, H. 2002, AJ, 123, 159
- (23)
- (24) Cepa, J., & Beckman, J. E. 1988, A&A, 200, 21
- (25)
- (26) Chapman, S. C., Ibata, R., Lewis, G. F., Ferguson, A. M. N., Irwin, M., McConnachie, A., & Tanvir, N. 2006, astroph/0602604
- (27)
- (28) Choi, P. I., Guhathakurta, P., & Johnston, K. V. 2002, AJ, 124, 310
- (29)
- (30) Cohen, J. G., Frogel, J. A., Persson, S. E., & Elias, J. H. 1981, ApJ, 249, 481
- (31)
- (32) Cutri, R. M. et al. 2003, 2MASS All-Sky Catalog of Point Sources (Pasadena: IPAC)
- (33)
- (34) Davidge, T. J. 1990, AJ, 99, 561
- (35)
- (36) Davidge, T. J. 1991, AJ, 101, 884
- (37)
- (38) Davidge, T. J. 1997, AJ, 113, 985
- (39)
- (40) Davidge, T. J. 2000, PASP 112, 1177
- (41)
- (42) Davidge, T. J. 2001, AJ, 122, 1386
- (43)
- (44) Davidge, T. J. 2002, AJ, 124, 2012
- (45)
- (46) Davidge, T. J. 2003, ApJ, 597, 289
- (47)
- (48) Davidge, T. J. 2005, AJ, 130, 2087
- (49)
- (50) Davidge, T. J., & Jones, J. H. 1992, AJ, 104, 1365
- (51)
- (52) Davidge, T. J., & Rigaut, F. 2004, ApJ, 607, L25
- (53)
- (54) Davidge, T. J., de Robertis, M. M., & Yee, H. C. K. 1990, AJ, 100, 1143
- (55)
- (56) Davidge, T. J., Jensen, J. B., & Olsen, K. A. G. 2006, AJ, 132, 521
- (57)
- (58) Davidge, T. J., Olsen, K. A. G., Blum, R., Stephens, A. W., & Rigaut, F. 2005, AJ, 129, 201
- (59)
- (60) Davidge, T. J., Rigaut, F., Chun, M., Brandner, W., Potter, D., Northcott, M., & Graves, J. E. 2000, ApJ, 545, L89
- (61)
- (62) Demers, S., Dallaire, M., & Battinelli, P. 2002, AJ, 123, 3428
- (63)
- (64) de Paz, A. G. et al. 2005, ApJ, 619, L115
- (65)
- (66) del Burgo, C., Peletier, R. F., Vazdekis, A., Arribas, S., & Mediavilla, E. 2001, MNRAS, 321, 227
- (67)
- (68) Dressler, A., & Richstone, D. O. 1988, ApJ, 324, 701
- (69)
- (70) Elston, R., & Silva, D. R. 1992, AJ, 104, 1360
- (71)
- (72) Faber, S. M. 1973, ApJ, 179, 423
- (73)
- (74) Ferguson, A. M. N., Irwin, M. J., Ibata, R. A., Lewis, G. F., & Tanvir, N. R. 2002, AJ, 124, 1452
- (75)
- (76) Ferguson, A. M. N. et al. 2005, ApJ, 622, L109
- (77)
- (78) Fisher, D., Franx, M., & Illingworth, G. 1995, ApJ, 448, 119
- (79)
- (80) Freedman, W. L. 1989, AJ, 98, 1285
- (81)
- (82) Freedman, W. L. 1992, AJ, 104, 1349
- (83)
- (84) Frogel, J. A., & Whitford, A. E. 1987, ApJ, 320, 199
- (85)
- (86) Frogel, J. A., Persson, S. E., Aaronson, M., & Matthews, K. 1978, ApJ, 220, 75
- (87)
- (88) Girardi, L., Bertelli, G., Bressan, A., Chiosi, C., Groenewegen, M. A. T., Marigo, P., Salasnich, B., & Weiss, A. 2002, A&A, 391, 195
- (89)
- (90) Glass, I. S., Whitelock, P. A., Catchpole, R. M., & Feast, M. W. 1995, MNRAS, 273, 383
- (91)
- (92) Graham, A. W. 2002, ApJ, 568, L13
- (93)
- (94) Graves, J. E., Northcott, M. J., Roddier, F. J., Roddier, C. A., & Close, L. M. 1998, Proc. SPIE, 3353, 34
- (95)
- (96) Grillmair, C. J. et al. 1996, AJ, 112, 1975
- (97)
- (98) Hardy, E., Couture, J., Couture, C., & Joncas, G. 1994, AJ, 107, 195
- (99)
- (100) Harris, G. L. H., & Harris, W. E. 2000, AJ, 120, 2423
- (101)
- (102) Hawarden, T. G., Leggett, S. K., Letawsky, M. B., Ballantyne, D. R., & Casali, M. M. 2001, MNRAS, 325, 563
- (103)
- (104) Ho, L. C., Terashima, Y., & Ulvestad, J. S. 2003, ApJ, 589, 783
- (105)
- (106) Hodapp, K. W. et al. 2003, PASP, 115, 1388
- (107)
- (108) Hodge, P. W. 1981, Atlas of the Andromeda Galaxy, (Seattle: U. of Washington Press)
- (109)
- (110) Hughes, S. M. G., & Wood, P. R. 1990, AJ, 99, 784
- (111)
- (112) Ibata, R., Chapman, S., Ferguson, A. M. N., Irwin, M., Lewis, G., & McConnachie, A. 2004, MNRAS, 351, 117
- (113)
- (114) Jarrett, T. H., Chester, T., Cutri, R., Schneider, S. E., & Huchra, J. P. 2003, AJ, 125, 525
- (115)
- (116) Kent, S. M. 1987, AJ, 94, 306
- (117)
- (118) Kent, S. M. 1989, AJ, 97, 1614
- (119)
- (120) Kormendy, J. 1985, ApJ, 295, 73
- (121)
- (122) Lauer, T. R., Faber, S. M., Ajhar, E. A., Grillmair, C. J., & Scowen, P. A. 1998, AJ, 116, 2263
- (123)
- (124) Le Bertre, T. 1992, A&AS, 94, 377
- (125)
- (126) Le Bertre, T. 1993, A&AS, 97, 729
- (127)
- (128) Le Bertre, T. 1997, A&A, 324, 1059
- (129)
- (130) Le Bertre, T., Tanaka, M., Yamamura, I., Murukami, H., & MacConnell, D. J. 2005, PASP, 117, 199
- (131)
- (132) Lee, M. G., Freedman, W. L., & Madore, B. F. 1993, ApJ, 417, 553
- (133)
- (134) Lloyd Evans, T. 1976, MNRAS, 174, 169
- (135)
- (136) Maraston, C. 1998, MNRAS, 300, 872
- (137)
- (138) Marigo, P., & Girardi, L. 2001, A&A, 377, 132
- (139)
- (140) Matsuura, M. et al. 2005, A&A, 434, 691
- (141)
- (142) Monet, D. et al. 1998, USNO-A2.0 (Flagstaff: US Nav. Obs.)
- (143)
- (144) Mouhcine, M., & Lançon, A. 2003a, MNRAS, 338, 572
- (145)
- (146) Mouhcine, M., & Lançon, A. 2003b, A&A, 402, 425
- (147)
- (148) O’Connell, R. W. 1980, ApJ, 236, 430
- (149)
- (150) O’Connell, R. W. et al. 1992, ApJ, 395, L45
- (151)
- (152) Ohl, R. G. et al. 1998, ApJ, 505, L11
- (153)
- (154) Peletier, R. F. 1993, A&A, 271, 51
- (155)
- (156) Puzia, T. H., Perrett, K. M., & Bridges, T. J. 2005, A&A, 434, 909
- (157)
- (158) Rejkuba, M., Minniti, D., Silva, D. R., & Bedding, T. R. 2003, A&A, 411, 351
- (159)
- (160) Ribas, I., Jordi, C., Vilardell, F., Fitzpatrick, E. L., Hilditch, R. W., & Guinan, E. F. 2005, ApJ, 635, L37
- (161)
- (162) Ridgeway, S. T., Carbon, D. F., & Hall, D. N. B. 1978, ApJ, 225, 138
- (163)
- (164) Rose, J. A. 1985, AJ, 90, 1927
- (165)
- (166) Rose, J. A., Arimoto, N., Caldwell, N., Schiavon, R. P., Vazdekis, A., & Yamada, Y. 2005, AJ, 129, 712
- (167)
- (168) Sage, L. J., Welch, G. A., & Mitchell, G. F. 1998, ApJ, 507, 726
- (169)
- (170) Stephens, A. W. et al. 2003, AJ, 125, 2473
- (171)
- (172) Stetson, P. B. 1987, PASP, 99, 191
- (173)
- (174) Stetson, P. B., & Harris, W. E. 1988, AJ, 96, 909
- (175)
- (176) Tonry, J. L. 1987, ApJ, 322, 632
- (177)
- (178) van der Marel, R. P., Cretton, N., de Zeeuw, P. T., & Rix, H-W 1998, ApJ, 493, 613
- (179)
- (180) van Loon, J. Th., Zijlstra, A. A., & Groenewegen, M. A. T. 1999, A&A, 346, 805
- (181)
- (182) Welch, G. A., & Sage, L. J. 2000, ApJ, 557, 671
- (183)
- (184) Wood, P. R., Habing, H. J., & McGregor, P. J. 1998, A&A, 336, 925
- (185)
- (186) Worthey, G. 2004, AJ, 128, 2826
- (187)
- (188) Worthey, G., Mateo, M., Alonso-Garcia, J., & Espana, A. L. 2004, PASP, 116, 295
- (189)
- (190) Zucker, D. B. et al. 2004, ApJ, 612, L117
- (191)