1–4
Infrared Properties of Nearby Interacting Galaxies: from Spirals to ULIRGs
Abstract
I present a brief review of some of the mid-infrared properties of interacting galaxies as these were revealed using observations from the Infrared Space Observatory and Spitzer Space Telescope over the last decade. The variation of the infrared spectral energy distribution in interacting galaxies can be used as an extinction free tracer not only of the location of the star formation activity but also of the physical mechanism dominating their energy production.222The presentation is also available at http://www.physics.uoc.gr/vassilis/vc_iau235.pdf.
1 Introduction
One of the major steps in the understanding of galaxy evolution was the realization that tails and bridges are the result of galaxy interactions (Toomre & Toomre, 1972). It was also proposed that the morphology of the observed tidal features and the separation between the galaxies could be used to create a “merging sequence” of (11 at first) peculiar NGC galaxies found in the Arp Atlas. Ever since, improvements in numerical modeling of the stellar and gaseous component in galaxies have clearly demonstrated that galaxy interactions cause large scale instabilities in the galactic disks leading to the formation of transient bars which drive the gas into the center of the galaxies (Mihos & Hernquist, 1996). Furthermore, numerous multi-wavelength studies of those systems (see Hibbard & van Gorkom, 1996; Schweizer, 1998, and references therein) have been performed in effort to better understand phenomena such as starburst and AGN activity, as well as mass transfers and morphological transformations associated with interacting galaxies. The focus of some of these studies was in the identification of observational characteristics which could be used as alternatives of assigning an “age” to the event of the interaction (i.e. Schweizer & Seitzer, 1992). However, since it was realized early on that the sites of most intense star formation were typically obscured by dust (i.e. Sanders et al., 1988; Mirabel et al., 1998; Charmandaris et al., 2004), the observed dust emission was used not only as a proxy of star formation rate (see Förster Schreiber et al., 2004), but also the estimated temperature of the various dust components was suggested as a tracer of the age of the last major star forming event (i.e. Charmandaris et al., 2000; Georgakakis et al., 2000; Xilouris et al., 2004). This is of particular interest since there is ample evidence that the galaxy interaction/merge rate increases sharply with redshift and that nearly all of the Utraluminous Infrared Galaxies (ULIRGs), who as we now know contribute substantially towards the energy production in the Universe at z (Elbaz & Cesarsky, 2003), are in fact interacting systems. The launch of the Spitzer Space Telescope introduces major improvements in sensitivity, wavelength coverage, and spatial resolution in mid-infrared imaging and spectroscopy, and opens new avenues in using the dust properties towards better understanding of the properties of interacting galaxies.
2 Results
2.1 ISO
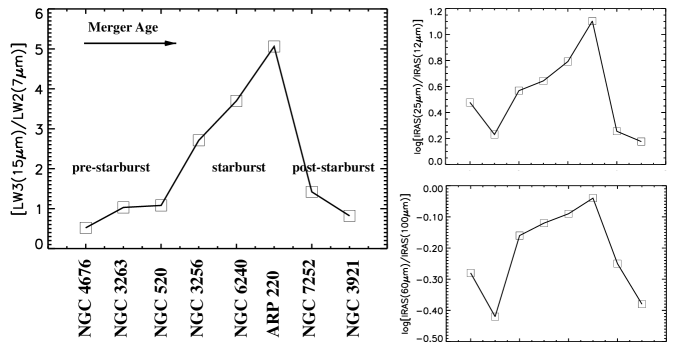
In order to quantify the variation of the global mid-infrared colors of interacting galaxies — beyond the seminal work of Bushouse et al. (1988) which was based on IRAS data — a small sample of well known interacting galaxies, for which the stage of interaction was known a priori, was imaged by ISO. Extensive studies of the ISO/CAM mid-infrared broad band colors indicated that one could use the ratio of the LW3(12-18 ) to LW2(5-8.5 m) flux densities as an indicator of the fraction of the very small grain continuum emission continuum to the PAH feature emission. The ratio is close to unity for quiescent star formation but it increases to values of 3 or more in starburst systems. As we clearly see from Figure 1, this ratio is correlated to the IRAS colors and varies monotonically with the intensity of the star formation activity in those galaxies. This result suggests that even though the bolometric luminosity of interacting luminous infrared galaxies is found at , the study of the mid-infrared part of the spectrum can be used to trace the location of the far-infrared peak.
2.2 Spitzer
The first detailed study of the mid-infrared emission from a sample of 35 interacting galaxies with the large format detector arrays of Spitzer, is presented by (Smith et al., 2006). Some of those results are highlighted in this section, while a number of other major imaging and spectroscopy programs by Spitzer are underway. The (Smith et al., 2006) sample was constructed from the Arp Atlas identifying nearby (11,000 km s-1) binary systems with clear signs of tidal disturbance and a total angular size of less than 3′ where each component was greater than 30′′. A control sample of “normal” isolated nearby galaxies obtained by the SINGS legacy program was used for comparison (Kennicutt et al., 2003; Dale et al., 2005).
As indicated in Figure 2, the spatial resolution and sensitivity of Spitzer enables us to quantify the distribution of the infrared emission. We find that the 3.6m emission from the tidal tails, which can be used as a proxy of their stellar mass, is 7% of the galaxy disks. Furthermore, less than 10% of the 24m emission, which identifies enshrouded regions of massive star formation, is found outside the body of the interacting components.


Analyzing the mid-infrared colors and luminosities of the interacting and control sample, Smith et al. (2006) showed that the star formation rate (SFR) in the interacting galaxy sample was relatively modest, 1 M⊙yr-1, similar to what was found for the isolated “normal” galaxies. There was no apparent variation in the distribution of mid-infrared colors for the various regions suggesting that the normalized SFR in tails and bridges is similar to that found on galaxy disks. No variation was either found as a function of the separation between the two interacting components. It is likely though that this result is simply due to the fact that systems in late stages of interactions/merging were excluded from the interacting sample.
Despite these similarities between the two sample, in order to investigate whether the Arp pairs have more centrally concentrated star formation, Smith et al. (2006) evaluated the 24m nuclear emission in a region of diameter 2 kpc centered on the position of the nucleus of each galaxy and defined the nuclear concentration C24 to be the ratio of the flux in the aperture S2kpc to the total flux Stot from the galaxy. As shown in Figure 3 there is a clear difference in the distribution of 24m nuclear concentrations between the spirals and the Arp systems. The spirals are predominantly diffuse objects with the median value of C24 being around 0.2 (i.e., 20 of the flux coming from the inner 2kpc) and only tiny fraction of the systems having nuclear concentrations, whereas the Arp systems show an almost flat (and slowly declining) distribution of C24. In particular, large numbers of Arp systems (both primary and secondary galaxies) have values of C24 greater than 0.3 and in some cases are totally nuclear dominated. This suggests that even though the Arp systems have similar L24μm/LFIR luminosities they show a much wider distribution of 24m nuclear concentrations, with a large excess (over the spirals) extending up to objects which are essentially point sources.
3 Conclusions
The large sample of galaxies that can now be efficiently studied in the mid-infrared with Spitzer is enabling us to establish for the first time well calibrated extinction free star formation diagnostics in galaxies.
Acknowledgements.
I would like to acknowledge the ISO/CAM extragalactic team at CEA/Saclay and the Spitzer/IRS instrument team at Cornell and Caltech for stimulating discussions over the past decade.References
- Bushouse et al. (1988) Bushouse, H. A., Werner, M. W., & Lamb, S. A. 1988, ApJ, 335, 74
- Charmandaris et al. (2000) Charmandaris, V., Laurent, O., Mirabel, I. F., Gallais, P., & Houck, J. 2000, ESA SP-456: ISO Beyond the Peaks: The 2nd ISO Workshop on Analytical Spectroscopy, 253
- Charmandaris et al. (2004) Charmandaris, V., Le Floc’h, E., & Mirabel, I. F. 2004, ApJ, 600, L15
- Dale et al. (2005) Dale, D. A., et al. 2005, ApJ, 633, 857
- Elbaz & Cesarsky (2003) Elbaz, D., & Cesarsky, C. J. 2003, Science, 300, 270
- Förster Schreiber et al. (2004) Förster Schreiber, N. M., Roussel, H., Sauvage, M., & Charmandaris, V. 2004, A&A, 419, 501
- Georgakakis et al. (2000) Georgakakis, A., Forbes, D. A., & Norris, R. P. 2000, MNRAS, 318, 124
- Hibbard & van Gorkom (1996) Hibbard, J. E., & van Gorkom, J. H. 1996, AJ, 111, 655
- Kennicutt et al. (2003) Kennicutt, R. C., Jr., et al. 2003, PASP, 115, 928
- Mihos & Hernquist (1996) Mihos, J. C., & Hernquist, L. 1996, ApJ, 464, 641
- Mirabel et al. (1998) Mirabel I.F., Vigroux L., Charmandaris V., et al., 1998, A&A, 333, L1
- Sanders et al. (1988) Sanders D.B., Soifer B.T., Elias J.H. et al. 1988, ApJ, 325, 74
- Schweizer (1998) Schweizer, F. 1998, in “Galaxies: Interactions and Induced Star Formation”, Saas-Fee Advanced Course 26, 105
- Schweizer & Seitzer (1992) Schweizer F., Seitzer P., 1992, AJ, 104, 1039
- Smith et al. (2006) Smith, B. J., Struck, C., Hancock, M., Appleton, P. N., Charmandaris, V., & Reach, W. 2006, AJ (in press, also @astro-ph/0610562)
- Toomre & Toomre (1972) Toomre A., Toomre J., 1972, ApJ, 405, 142
- Xilouris et al. (2004) Xilouris, E. M., Georgakakis, A. E., Misiriotis, A., & Charmandaris, V. 2004, MNRAS, 355, 57