Testing MOND with Local Group spiral galaxies
Abstract
The rotation curves and the relative mass distributions of the two nearby Local Group spiral galaxies, M31 and M33, show discrepancies with Modified Newtonian dynamic (MOND) predictions. In M33 the discrepancy lies in the kinematics of the outermost regions. It can be alleviated by adopting tilted ring models compatible with the 21-cm datacube but different from the one that best fits the data. In M31 MOND fails to fit the falling part of the rotation curve at intermediate radii, before the curve flattens out in the outermost regions. Newtonian dynamics in a framework of a stellar disc embedded in a dark halo can explain the complex rotation curve profiles of these two galaxies, while MOND has some difficulties. However, given the present uncertainties in the kinematics of these nearby galaxies, we cannot address the success or failure of MOND theory in a definite way. More sensitive and extended observations around the critical regions, suggested by MOND fits discussed in this paper, may lead to a definite conclusion.
keywords:
galaxies: halos galaxies: individual: M31,M33 galaxies: kinematics and dynamics1 Introduction
According to Newtonian dynamics the mass distribution of the luminous components of spiral galaxies cannot account for the observed profiles of their rotation curves (hereafter RC) especially in the outer regions of galaxies (Rubin, Ford, Thonnard 1980). To account for this discrepancy, which becomes more pronounced for late type galaxies, discs are thought to be embedded in dark halos of non baryonic matter (Persic, Salucci Stel 1996). An alternative explanation for the mass discrepancy has been proposed by Milgrom by means of the modified Newtonian dynamics or MOND (Milgrom 1983). According to this theory the dynamics becomes non-Newtonian below a limiting acceleration value, cm s-2, where the effective gravitational acceleration takes the value , with the acceleration in Newtonian dynamics. Outside the bulk of the mass distribution, MOND predicts a much slower decrease of the (effective) gravitational potential, with respect to the Newtonian case. This is often sufficient to explain the observed non-keplerian behavior of RC (Sanders McGaugh 2002, Lokas 2002).
This success is remarkable in that MOND has only one free parameter, namely . MOND theory of Gravity has been generalized in the framework of a relativistic, Lorentz invariant theory (Bekenstein 2004). It is worth noticing that MOND could account for the acoustic peak structure of Cosmic Microwave Background experiments (Slosar, Melchiorri, Silk 2005, McGaugh 2004). Gravitational lensing data together with X-ray data in galaxy cluster regions give perhaps the most convincing proof for the existence of ”dark matter” (Clowe, Gonzalez Markevitch 2004; Pointecouteau Silk 2005) though on much larger scales than we consider here. On the other side, there are difficulties for the dark matter paradigm as well (e.g. Goerdt et al. 2006) and dark particles have not been detected yet.
It is however important to check MOND validity on galactic scales, that host the empirical phenomenon which stimulated its birth and its theoretical development. MOND is unable to fit some RC of spiral galaxies (e.g. Gentile et al. 2004) but this failure is not decisive to totally rule out this theory of Gravity. In fact MOND mass modeling depends on the exact value of the acceleration threshold , on the galaxy distance and on the detailed distribution of stars and gas. Uncertainties in these quantities weaken the relevance of the comparison between model predictions and data. All the above, in addition to the possible presence of bars, interactions and warps, makes the MOND-dark matter debate still open (Bottema et al. 2002). In this perspective M31 and M33, well studied spirals and primary distance indicators, are excellent benchmarks for MOND. For these galaxies, all the above uncertainties are fairly small: distances are well known (780 and 840 kpc within 10), and their exponential stellar discs and gas surface brightness are precisely measured.
M33 is one of the fewest objects for which it is possible to combine a high quality and high resolution RC from CO J=1-0 line that extends inward to 200 pc with a high quality 21-cm line RC which extends out to 13 disc scalelengths i.e. 19 kpc (Corbelli Salucci 2000, Corbelli 2003). The galaxy has no prominent bar or bulge and the HI and CO velocity fields are very regular and cannot be explained by Newtonian dynamic without including a massive dark matter halo. M31 is a very large nearby galaxy whose extended and spatially resolved RC has been recently studied, in the Newtonian framework, to advocate a dark matter component contributing more than half the mass inside 30 kpc (Widrow, Perrett Suyu 2003, Geehan et al. 2006, Carignan et al. 2006).
In this paper we use recent kinematical data of these two galaxies to test MOND theory. It is important to investigate the uncertainties left in the kinematics or mass distribution in order to claim complete failure or success of this theory. To this purpose we investigate M33 in Section 2, and in Section 3 we check the compatibility of MOND with less probable but still possible deconvolution models for the M33 21-cm datacube. In Section 4 we analyze MOND mass models for M31 using the most recent RC data. Section 5 summarizes our results and addresses future observational strategies.
2 The M33 rotation curve in the MOND framework
Neutral gas in M33 extends well beyond the optical disc. The rotation curve and the average radial distribution of gas can be derived from 21-cm spectral line data using a set of tilted concentric rings that accounts for the possible presence of a warp. This is especially important when testing MOND because the kinematics and the distribution of matter in the outermost regions of galaxies are strongly coupled by the local non-Newtonian gravitational field.
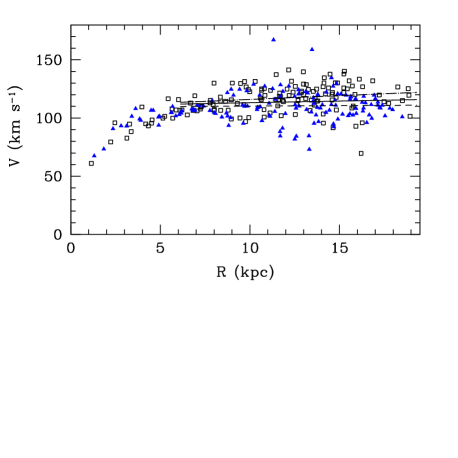
The RC that we use is shown in Figure 1 with 2 errorbars in each bin derived from the dispersion of single spectra velocities after deconvolution. Data have been deconvolved using the tilted ring model which best fits the Arecibo 21-cm data (hereafter deconvolution Model 1, see bottom panels of Figure 1; Corbelli Schneider 1997, Corbelli Salucci 2000). Uncertainties in this model will be investigated in the next Section. The inner RC, over the interval kpc, is from CO J=1-0 data at an angular resolution of 0.75 arcmin (Corbelli 2003). For kpc we use 21-cm interferometric observations of Newton (1980) at 1.53 arcmin angular resolution. The outer RC is from Arecibo 21-cm data at 4.5 arcmin angular resolution (Corbelli Schneider 1997). Corbelli Salucci (2000) and Corbelli (2003) have used these data for modeling the M33 mass distribution when a dark matter halo is in place. Note however that the distance assumed in Corbelli (2003) is 760 kpc and not 840 kpc as erroneously stated in that paper. Here we shall use a distance to M33 of 840 kpc (Freeman et al. 2001). As shown by Corbelli Salucci (2000) the rotation curves of the receding and approaching sides of M33 look very similar for deconvolution Model 1. Their slopes are consistent (within 1 errors) with those relative to the rotation curve of the galaxy as a whole.
The visible mass components in M33 are: stars, distributed in a disc and in a spheroid, and gas, in molecular and in neutral atomic form. In the stellar disc we assume that the mass follows the light distribution in the K-band that is well fitted by an exponential law with scalelength arcmin ( kpc) (Regan Vogel 1994). There are no wiggles or deviations from a pure exponential disc between 3 and 18 arcmin. Beyond 18 arcmin the the near-infrared brightness drops below the sensitivity limit of the quoted observations. However preliminary work in the I-band by Ferguson et al. (2006) shows that the exponential surface brightness holds out to about 40 arcmin. In this Section we extrapolate such exponential stellar light distribution beyond 40 arcmin, to the outermost RC data point. Alternative models are discussed in Section 3. For consistency with other works on MOND we assume an infinitely thin stellar disc. In the innermost region ( arcmin) there is a luminosity excess with respect to the exponential disc extrapolation and a small spheroid is likely to be in place though its luminosity and mass are very uncertain (Regan Vogel 1994; Corbelli 2003). We will take this stellar component into account by parameterizing its contribution to the circular velocity as:
the total mass of the spheroid, , and its typical radius, , are free parameters. Observations suggest values of in the 0.1-1 kpc range and spheroidal masses smaller than 10 of the stellar disc mass (see Corbelli 2003 and references therein). Being M33 a blue galaxy, also in its central region, the only restriction we place on the spheroid here is where is the largest blue spheroidal luminosity ever estimated. The atomic and molecular gas surface densities in M33 are shown by Corbelli (2003). They result from azimuthal averages of the data after deconvolution according to the tilted ring model which best fits the 21-cm datacube. The molecular mass of M33 is less than 10 the HI mass using the CO to H2 conversion factor determined by Wilson (1995) in M33.
The free parameters of the M33 mass model in the MOND framework are: , , and , (where is the blue disc luminosity). We use the critical acceleration value derived from the analysis of a sample of rotation curves cm s-2 (Sanders McGaugh 2002).
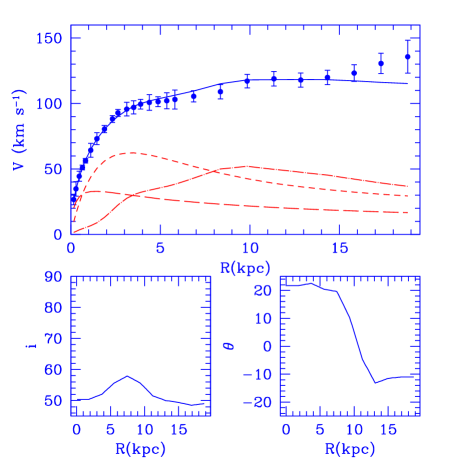
We use the reduced chi-square statistic, , to judge the goodness of a model fit. Figure 1 shows the MOND best-fit model curve: its is higher than the value obtained for dark halo models (Corbelli 2003). The best fitting values of the free parameters are , kpc, and M⊙ (the maximum allowed value). The fit is poor and only marginally acceptable, being 99.9 the probability of finding for random events. The rotational velocities predicted by MOND are higher than observed for kpc and lower than data for kpc. MOND has difficulties to reproduce the M33 RC because of the rising rotational velocities in the outer disc where the HI gas mass density strongly declines. Moreover, the resulting spheroidal mass, about 20 of the total stellar mass, is unrealistic for this blue galaxy, it bounces to the extreme value allowed by our fit and its typical radius is larger than observational estimates. Variations of the stellar disc scalelength within the uncertainties quoted by Regan Vogel (1994) do not affect the above conclusions significantly.
In modeling the gas distribution in the outer disc we have assumed that most of the gas is in neutral form and is traced by the 21-cm line. Absorption measurements of the 21-cm radiation from background sources behind the M33 disc have excluded the possibility that there are relevant HI masses in the outer disc of M33 which are undetected in emission at 21-cm (Corbelli Salpeter 1993a). There is however the possibility that extragalactic UV radiation ionizes the outer disc gas as the HI column density approaches the value of cm-2 (Corbelli Salpeter 1993b). This implies a sharp HI radial fall-off, as that observed along the M33 major axis by Corbelli, Schneider Salpeter (1989). The gas extends beyond 18 kpc but it is undetected via 21-cm radiation because it is fully ionized. The sharpness of the HI edge is a function of the gravity perpendicular to the disc and it is worth noticing that MOND models reproduce the observations as the Newtonian dynamic does in the presence of a dark halo. The presence of an ionized component extending radially further out would rise the gas RC by 1-2 km at the outermost sampled radius. This is however not sufficient to improve the significance of MOND fit to the RC.
3 Can observations and MOND predictions in M33 reach a better agreement?
In this Section we investigate whether MOND models can provide a better fit to the M33 RC when uncertainties in the modeling presented in Section 2 are taken into account.
(a)Distance uncertainties
For M33 we are using a distance of kpc determined from Hubble Space Telescope Cepheid data (Freeman et al. 2001). The uncertainties on this measured value are kpc. To be conservative we take into account other values obtained by different distance indicators. These fall in the range 790-940 kpc (McConnachie et al. 2004; McConnachie et al. 2005 and reference therein; Bonanos et al. 2006; Sarajedini et al. 2006). We model fit the M33 RC by assuming the distance as an additional free parameter. The best fit is obtained for a distance to M33 of 860 kpc, but the improvement in term of the value is negligible (1).
(b)Departures of the stellar mass distribution from a simple exponential law
Preliminary work by Ferguson et al. (2006) shows that the surface brightness of the M33 disc has no departures from a pure exponential law out to about 40 arcmin. Between 40 and 60 arcmin, only RGB star counts are available and their distribution can be fitted by a steeper exponential law than that describing the K and I-band inner surface brightness. If the distribution of RGB stars reflects the stellar mass distribution in the outer disc we have to modify the stellar mass exponential scalelength used in the previous Section at large radii. We shall use a scalelength of 1.4 kpc (Regal Vogel 1993) for kpc and of 0.9 kpc for kpc. For sake of completeness we will consider also models with a larger stellar scalelength, up to 2 kpc, for kpc.
In any case (for both smaller and larger scalelength at large radii) variations of the best fitting parameters and are hardly noticeable. This is because the change in scalelength takes place in a region where the stellar contribution to circular velocity is not prominent and radially declining.
(c)Tilted ring models
The modest inclination of M33 with respect to our line of sight implies that small variations of the inclination angle give non negligible variations of the deprojected rotational velocity. In this Section we check if tilted ring models, with less statistical relevance but still within the 95 confidence level for fitting the 21-cm Arecibo datacube, yield a rotation curve in closer agreement with MOND predictions.
The tilted ring model we use has 11 free rings. The fitting program interpolates between the 11 free rings to find the parameters at each radius (see Corbelli Schneider 1997). Here we vary the parameters of the tilted ring model as follows. We fix the ring parameters to the best fitting values of Model 1 for kpc, and in the interval kpc we vary the inclinations of the 5 free rings by respect to Model 1 values. Each of these models is compatible with the 21-cm datacube and yields a rotation curve over kpc that we fit using MOND prescription.
The use of deconvolution models whose ring inclinations are systematically lower than those of Model 1 for kpc, results in a RC which is flatter than that of Figure 1 and in better agreement with MOND model. We then consider for these 5 free rings the deconvolution model which gives the lowest ,for MOND fit out to kpc, and we vary the position angle and inclination of the two outermost free rings by deg. We choose a combination of position angles and inclinations of the last two rings, compatible with 21-cm data, whose associated RC has the lowest for MOND model fit (). Figure 3 shows the whole M33 rotation curve derived according to the above prescriptions and the relative deconvolution model (hereafter deconvolution Model 2).
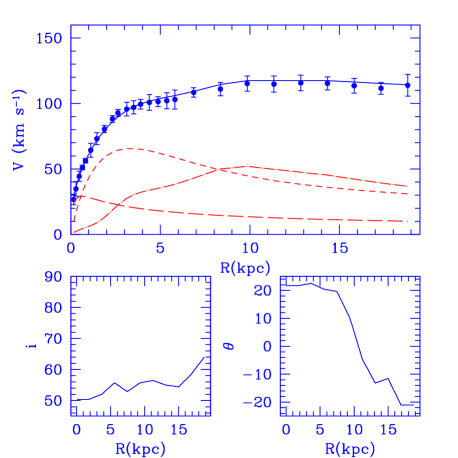
MOND fit improves considerably when outermost orbits are more inclined and at more negative position angles than in Model 1. The velocity fields of the two separate halves of M33 look very similar also for Model 2 and are shown in Figure 3. The linear fit to the data for kpc have consistent slopes (within 1- error). The parameters of the mass model are , kpc and M⊙. The MOND best fit to Model 2 data is good and requires spheroidal parameters closer to values suggested by multiwavelengths observations of M33. Deconvolution Model 2, or similar ones, are therefore acceptable alternatives to Model 1 and give rotation curves compatible with MOND predictions with high statistical significance, similar to dark matter halo models. Only deeper 21-cm maps or H emission searches around and beyond the 18 kpc radius can constrain the deconvolution model further and solve the ambiguity left in M33 by the current data.
4 The M31 rotation curve in the MOND framework
Recent 21-cm observations of M31 along its major axis have shown that the rotation curve of this nearby galaxy stays flat out to 35 kpc (Carignan et al. 2006). Because of the discrepancies between different determinations of the RC in the inner 10 kpc and the relative unimportance of this region for MOND tests, fully into the Newtonian regime, we consider only the radial range and HI rotational velocities given by Table 1 of Carignan et al. (2006). For this radial range (10-35 kpc), there are very few uncertainties on the galaxy inclination and position angle. The warp of M31 is a minor one, due perhaps to the more massive and extended stellar disc. Models of the warp at large radii imply a slightly increasing inclination as a function of radius (Newton Emerson 1977; Briggs 1990). Due to the nearly edge on position of the optical disc, the use of a constant inclination of 77o instead of a higher one at large overestimate the rotational velocities by only 2-3. 21-cm maps suggest higher inclinations at large (Brinks Burton 1984) but analysis of the extended stellar disc by Ibata et al. (2005) suggest instead a somewhat lower values of . The large errorbars in the rotation curve of this region take these uncertainties into account.
We consider a mass model with three components: a gaseous disc, a stellar disc and a central spheroidal or stellar bulge. This last component is very prominent and its mass can be of the same order of the disc mass. Walterbos Kennicutt (1987,1988) derive the bulge and disc optical luminosity profiles. There are very large uncertainties on the bulge scalelength and on its mass because the disc-bulge decomposition is not very robust. The bulge scalelength range is kpc (Geehan et al. 2006) and here we shall consider the two extremes of this range. For the disc scalelength we shall use that K-band photometric data which give a value of 4.5 kpc (Battaner et al. 1986). Similar values are found in the more extended R-band photometric maps (5.1 kpc out to 40 kpc, Ibata et al. 2005). The bulge and disc blue luminosities are and respectively. The observed colors and population models imply stellar mass to light ratios between 2.8 and 6.5 in solar units (Bell de Jong 2001) which we will use to limit our models.
We adopt the neutral gas surface density measured by Sofue Kato (1981). The molecular gas mass is less than 10 of the gas mass (Nieten et al. 2006) and its peak is located at about 11 kpc. Results are insensitive to the inclusion of this components as well as to the central supermassive black hole whose estimated mass is M⊙ (Salow Statler 2004; Bender et al. 2005).
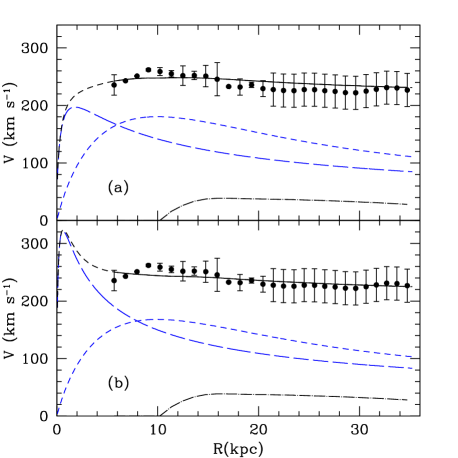
For kpc the minimum is 10.3 with and . For kpc the minimum is 8.1 with and . MOND fits are shown in Figure 4. The evident failure is due to the declining part of the rotation curve of M31 between 10 and 20 kpc. While the classical Newtonian dynamic with a dark matter halo is able to provide a good fit to the data (Widrow et al. 2003; Carignan et al. 2006) by making the stellar disc responsible for the declining part of the curve and the dark halo responsible for the outermost flattening, MOND is unable to reproduce this non monotonic behavior. It is in fact around 10 kpc that and non-Newtonian corrections start to be important and force a falling Newtonian RC into a flat one, inconsistent with the data.
Uncertainties on the M31 distance are much smaller than for M33. Distances resulting from different data sets and methods are always in the range 770-795 kpc. Therefore possible variations with respect to the assumed one (D=780 kpc) are less than 2 and give negligible effects on the MOND fit (Freeman et al. 2001; Joshi et al. 2003; McConnachie et al. 2005 and reference therein; Ribas et al. 2005). Concerning the uncertainties on the disc scalelength we have found no evidence for a scalelength smaller than indicated by K-band photometry. However from measurements of light profiles in other bands, extending at larger radii, we cannot exclude a flattening of the stellar light profile at large radii (Walterbos Kennicutt 1988; Ibata et al. 2005; Irwin et al. 2005). MOND models which take into account a change in the disc scalelength at large radii do not give acceptable fits to M31 RC data.
5 Conclusions
Local Group galaxies benefit from low observational uncertainties in distance determination and in the distribution of baryonic matter. Moreover, they provide RC data to an unbeatable spatial resolution. For this reason we have chosen the two nearest spiral galaxies, M31 and M33, to test MOND. M33, a low luminosity late galaxy, has a very extended HI disc providing a rotation curve out to 13 disc scalelengths. Dark matter dominates over the visible baryonic matter well inside its optical radius according to Newtonian dynamic. However its inclination is not sufficiently high to limit the uncertainties on the rotational velocities of the outer disc. Here the presence of a warp leaves some degree of freedom to the tilted rings deconvolution model. Even though MOND models are marginally compatible with the rotation curve from the best fitting tilted ring model to the 21-cm datacube, data leave some space for a less rising curve, well fitted by MOND models. Since deconvolution models in better agreement with MOND theory predict a more inclined outermost disc, future observations should check whether this is effectively the case by searching for faint emission above the main disc at a specific velocity. Sensitive searches for extended emission should be carried out both at 21-cm and in the H line (since there is the possibility that extragalactic UV radiation ionizes the outermost disc).
In M31 the disagreement between the RC and MOND predictions is statistically significant. MOND models are unable to reproduce the non monotonic behavior of the rotation curve in regions where and non-Newtonian corrections predict a flat RC. However the actual RC is made up of data with small uncertainties in some radial range while in others and beyond 20 kpc uncertainties are large. For this galaxy it would be nice to have more uniform uncertainties by producing a fully sensitive two dimensional map at 21-cm which provides kinematical information on a more extended area and defines the orientation of the possible warp.
We are grateful to the anonymous referee for her/his useful criticism to the original manuscript which have improved the quality of the paper.
References
- (1) Battaner E., Beckman J.E., Mediavilla E., Prieto M., Sanchez Magro C., Munoz Tunon C., Sanchez Saavedra M.L., 1986, AA, 161, 70
- (2) Bekenstein J.D., 2004, Phys Rev. D, 70, 083509
- (3) Bell R.F., de Jong R., 2001, ApJ, 550, 212
- (4) Bender R. et al. 2005, ApJ, 631, 280
- (5) Bonanos A.Z. et al. 2006, ApSS, in press
- (6) Bottema R., Pestana J.L.G., Rothberg B., Sanders R.H., 2002, A&A, 393, 453
- (7) Briggs F.H., 1990, ApJ, 352, 15
- (8) Brinks E., Burton W.B., 1984, A&A, 141, 195
- (9) Carignan C., Chemin L., Huchtmeier W.K., Lockman F., 2006, ApJ, 641, L109
- (10) Clowe D., Gonzalez A., Markevitch M., 2004, ApJ, 604, 596
- (11) Corbelli E., 2003, MNRAS, 342, 199
- (12) Corbelli E., Salpeter E.E., Schneider S.E., 1989, AJ, 97, 390
- (13) Corbelli E., Salpeter E.E., 1993a, ApJ, 419, 94
- (14) Corbelli E., Salpeter E.E., 1993b, ApJ, 419, 104
- (15) Corbelli E., Schneider S.E., 1997, ApJ, 479, 244
- (16) Corbelli E., Salucci P., 2000, MNRAS, 311, 441
- (17) Ferguson A. et al. 2006, in Island Universes - Structure and Evolution of Disk Galaxies”, editor R.S. de Jong (Springer: Dordrecht) astro-ph/0601121
- (18) Freeman W.L. et al. 2001, ApJ, 553, 47
- (19) Geehan J.J., Fardal M.A., Babul A., Guhathakurta P., 2006, MNRAS, 366, 996
- (20) Gentile G., Salucci P., Klein U., Vergani D., Kalberla P., 2004, MNRAS, 351, 903
- (21) Goerdt T., Moore B., Read J.I., Stadel J., Zemp M., 2006, MNRAS, 368, 1073
- (22) Ibata R., Chapman S., Ferguson A.M.N., Lewis G., Irwin M., Tanvir N., 2005, ApJ, 634, 287
- (23) Irwin M.J., Ferguson A.M.N., Ibata R.A., Lewis G.F., Tanvir N.R., 2005, ApJ, 628, L105
- (24) Joshi Y.C., Pandey A.K., Narasimha D., Sagar R., Giraud-H raud Y., 2003, AA, 402, 113
- (25) Lokas E.L., 2002, MNRAS, 333, 697
- (26) McConnachie A.W., Irwin M.J., Ferguson A.M.N., Ibata R.A., Lewis G.F., Tanvir N., 2004a, MNRAS, 350, 243
- (27) McConnachie A.W., Irwin M.J., Ferguson A.M.N., Ibata R.A., Lewis G.F., Tanvir N., 2004b, MNRAS, 356, 979
- (28) McGaugh S.S., 2004, ApJ, 611, 26
- (29) Milgrom M., 1983, ApJ, 270, 365
- (30) Newton K., 1980, MNRAS, 190, 689
- (31) Newton K., Emerson D.T., 1977, MNRAS, 181, 573
- (32) Nieten Ch., Neininger N., Guelin M., Ungerechts H., Lucas R., Berkhuijsen E.M., Beck R., Wielebinski R., 2006, A&A, 453, 459
- (33) Persic M., Salucci P., Stel P., 1996, MNRAS, 281, 27
- (34) Pointecouteau E., Silk J.I., 2005, MNRAS, 364, 654
- (35) Ribas I., Jordi C., Vilardell F., Fitzpatrick E.L., Hilditch R.W., Guinan E.F., 2005, ApJ, 635, L37
- (36) Rubin V.C., Ford W.K.Jr., Thonnard N., 1980, ApJ, 238, 471
- (37) Salow R.M., Statler, T.S., 2004, ApJ, 611, 245
- (38) Sanders R.H., McGaugh S.S., 2002, ARA&A, 40, 263
- (39) Sarajedini A., Baker M.K., Geisler D., Harding P., Schommer R., 2006, AJ, 132, 1361
- (40) Slosar A., Melchiorri A., Silk, J.I., 2005, Phys. rev. D 72, 101301
- (41) Sofue Y., Kato T., 1981, PASJ, 33, 449
- (42) Walterbos R.A.M., Kennicutt R.C., 1987, A&AS, 69, 311
- (43) Walterbos R.A.M., Kennicutt R.C., 1988, A&A, 198, 61
- (44) Widrow L.M., Perrett K.M., Suyu S.H., 2003, ApJ, 588, 311
- (45) Wilson C.D., 1995, ApJ, 448, L97