Photometry of a Galactic field at l = 232o, b = -6o. The old open cluster Auner 1, the Norma-Cygnus spiral arm and the signature of the warped Galactic Thick Disk
Abstract
We perform a detailed photometric study of the stellar populations in a Galactic Field at l = 232o, b = in the Canis Major (CMa) constellation. We present the first photometry of the old open cluster Auner 1 and determine it to be Gyr old and to lie at 8.9 kpc from the Sun. In the background of the cluster, at more than 9 kpc, we detect a young population most probably associated to the Norma Cygnus spiral arm. Furthermore, we detect the signature of an older population and identify its Turn Off and Red Giant Branch. This population is found to have a mean age of 7 Gyrs and a mean metallicity of Z. We reconstruct the geometry of the stellar distribution and argue that this older population - often associated to the Canis Major galaxy- belongs in fact to the warped old thin/thick disk component along this line of sight.
1 Introduction
In recent papers (Carraro et al. 2005a, Moitinho et al. 2006, Vázquez et al. 2006) we have been unveiling a new detailed picture of the structure of the Milky Way’s disk in the Third Galactic Quadrant (3GQ). Our analysis of the young stellar population and molecular clouds, which make up the Galactic Thin Disk, has shown that: (i) the Local Arm, also called the Orion Spur, apparently enters the 3GQ where it is seen between l=220o and l=250o. It seems to remain close to the formal Galactic plane, b=0o, up to 5 kpc from the Sun where it starts to descend abruptly, reaching z kpc below the plane at 9-11 kpc from the Sun; (ii) the Local arm does not appear to be a grand design arm , but an inter-arm structure, a bridge emerging from the Carina-Sagittarius arm in the First Quadrant and possibly reaching the Norma-Cygnus (Outer) arm in the 3GQ; (iii) the Outer arm in the 3GQ is visible from l = 200o to l = 260o. We note that this picture bears some similarity with the one sketched by Moffat et al. (1979), almost 30 years ago; (iv) The presence of the Local and Outer arms below the b=00 plane is an effect of the Warp of the Galactic disk (for further descriptions of the warp see May et al. 1997, Momany et al. 2006, Moitinho et al. 2006, and references therein); (v) the Perseus arm (mostly visible in the second quadrant) is not clearly traced in the 3GQ; (vi) the young stellar and molecular Warp reaches its southern maximum at l = 250o-260o. Evidence for the existence of an old population (4-10 Gyr) in the 3GQ has been reported by Bellazzini et al. (2004), and has been interpreted as a galaxy - the Canis Major (CMa) galaxy - undergoing an in-plane accretion onto the Milky Way. Besides the old population, the CMa galaxy has been considered to also contain a younger (1-2 Gyr) component, based on the presence of a blue sequence (popularized as the Blue Plume (BP)) in Color-Magnitude Diagrams (CMDs). But, as found by Carraro et al. (2005) and confirmed in Moitinho et al. (2006) and Pandey et al. (2006), these blue stars are actually very young (100 Myr) and are seen in many different regions of the second and 3GQ. Noticeably, most of them were found to trace the Norma-Cygnus spiral arm in remarkable agreement with other tracers such as CO molecular clouds and analytical models of spiral structure. As for a possible very old population associated to the CMa galaxy, which would be similar to the ones seen in almost all Local Group dwarf galaxies (Mateo 1998), Momany et al. (2006) have clearly shown that the lack of any extended Blue Horizontal Branch star in its CMD argue against its existence in CMa . Thus, what seems to be left of the CMa galaxy is a relatively metal rich () intermediate age (4-7 Gyr) population (Bellazzini et al. 2004). However, these age and metallicity ranges are suspiciously similar to those of the Galactic old thin or young thick disks (Norris 1999, Bensby et al. 2004).
In this paper, we analyze a field in the constellation of CMa, centered on the open cluster Auner 1. The observations reveal the signature of an intermediate age, relatively metal rich population that, as we will argue, belongs to the warped old thin/young thick disks.
2 Observational material
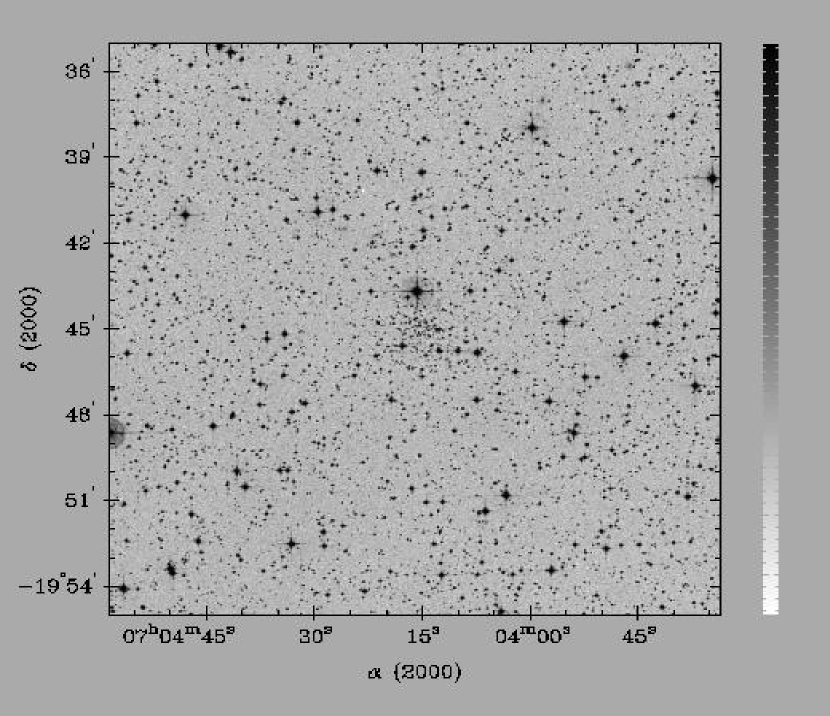
CCD photometry of the field under study has been obtained at CTIO, with the 1.0m telescope operated by the SMARTS consortium111http://www.astro.yale.edu/smarts/. The telescope hosts a new 4k4k CCD camera with a pixel scale of 0′′.289/pixel which allows to cover a field of on the sky. The field was observed on November 30, 2005, together with the Landolt (1992) fields TPhoenix, Rubin 149, PG 0231+006 and SA 95 to calibrate instrumental magnitudes to the standard system. The night was photometric with an average seeing of 1.1 arcsec. Data have been reduced using IRAF222IRAF is distributed by NOAO, which are operated by AURA under cooperative agreement with the NSF. packages CCDRED, DAOPHOT and PHOTCAL following the point spread function (PSF) method (Stetson 1987). An image of the covered area is shown in Fig. 1. A more detailed discussion of the data reduction and calibration is presented in a forthcoming paper (Vázquez et al. 2006).
3 The old open cluster Auner 1
The star cluster Auner 1 () was first detected by Auner et al. (1980)
during a survey of hitherto unknown objects of various nature. No CCD
study has been insofar performed to our knowledge. The cluster is
rather compact and faint, as can be judged by inspecting Fig. 1.
We estimated the cluster radius by performing star counts around the
cluster center using our photometric catalog. We employed the B and I
bands to monitor absorption effects since there seems to be
some differential reddening toward the cluster. Indeed, the
reddening map of the region from Schlegel et al. (1998) shows the
presence of significant nebulosity on the south-east corner of the
field, and indicates a mean reddening for
this line of sight. From Fig. 2 one can notice how the cluster
clearly stands out up to 2.5 arcmin, then a halo is visible in the I
(but not in the B) band profile up to 3.5 arcmin before reaching the
level of the field. We therefore assign to Auner 1 a radius of
3.0 arcmin.
This results to be twice the one listed in the open cluster catalog of
Dias et al. (2001) which was based on visual inspection of the
brightest stars.
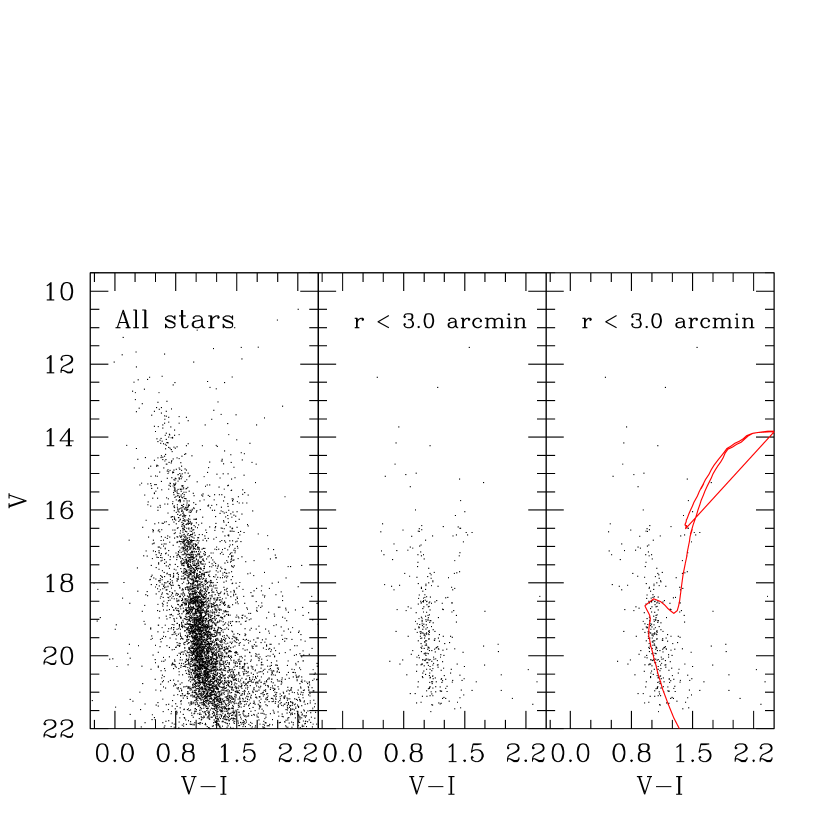
The cluster’s fundamental parameters were derived by applying
the isochrone fitting method using the Padova library of isochrones
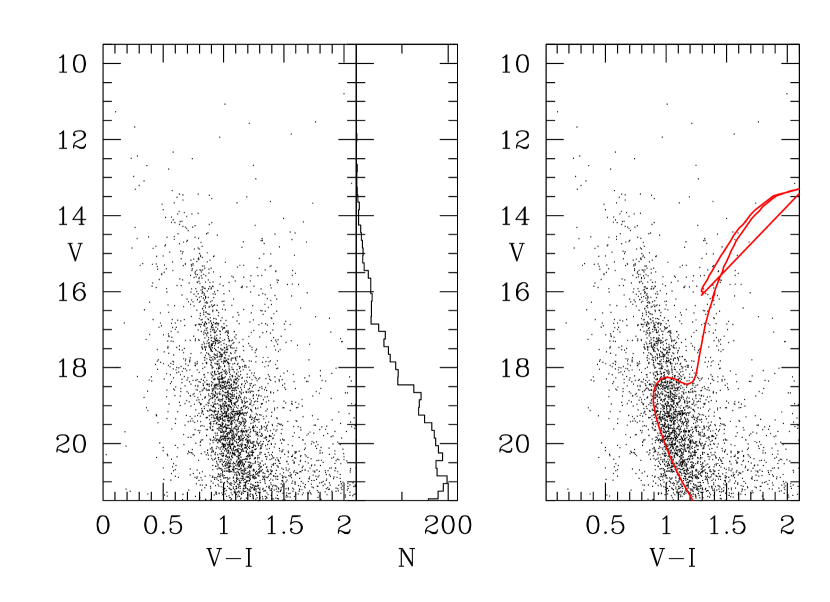
(Girardi et al. 2000), as illustrated in Fig. 3. In the left
panel, we show the CMD of all the stars, whereas in the right panel we
consider the results of the profile analysis and select only those stars
within 3 arcmin from the cluster center. The cluster clearly emerges
in this panel, whilst completely hidden in the left panel by the
fore/background population. The Turn Off Point (TO) is located at V
=19.0, (V-I) = 0.9, there is a readily detectable Red Giant Branch
(RGB), and a possible RGB clump of He-burning stars at V = 16.8. With
a difference in magnitude between the TO and the red clump
of 2.2 mag, Auner 1 would be 3.5
Gyrs old (Carraro & Chiosi 1994).
We performed a detailed isochrone fitting analysis, and show here the
best fit, which is achieved for a 3.25 Gyr Z=0.008
isochrone, shifted by E(B-V)=0.320.05 (E(V-I) = 0.400.05)
and (V-MV) = 15.750.15. This places the cluster at 8.9 kpc
from the Sun. Accordingly, the Galactic Cartesian coordinates in the
right-handed system where the origin is placed in the Sun, the
Galactic center is at (0.0,-8.5,0.0), and X increases toward l =
90o (Lynga 1982) are XG = -7.0, YG = 5.4 and ZG =-0.9 kpc,
assuming RGC,⊙= 8.5
kpc. The Galactocentric distance is then 15.6 kpc.
Interestingly, this cluster falls in an age bin (3 to 4 Gyr, see
Carraro et al. 2005b and Ortolani et al. 2005) where only a few
clusters were known before. Therefore Auner 1 is a
significant object for our understanding of the age
distribution of the oldest open clusters.
4 The stellar populations in the field of Auner 1
The presence of an almost vertical blue sequence in the CMD of
Fig. 3 (left panel), known as the Blue Plume (BP), that has already
been detected in other clusters in this Galactic quadrant (Carraro et
al. 2005; Moitinho et al. 2006) and the location of Auner 1, at kpc from the Sun and kpc below the galactic plane,
stresses the complexity of the stellar populations in this region of
the Galaxy. It is thus mandatory to investigate in more detail the
relation between Auner 1, the BP
population and the various Galactic disk components.
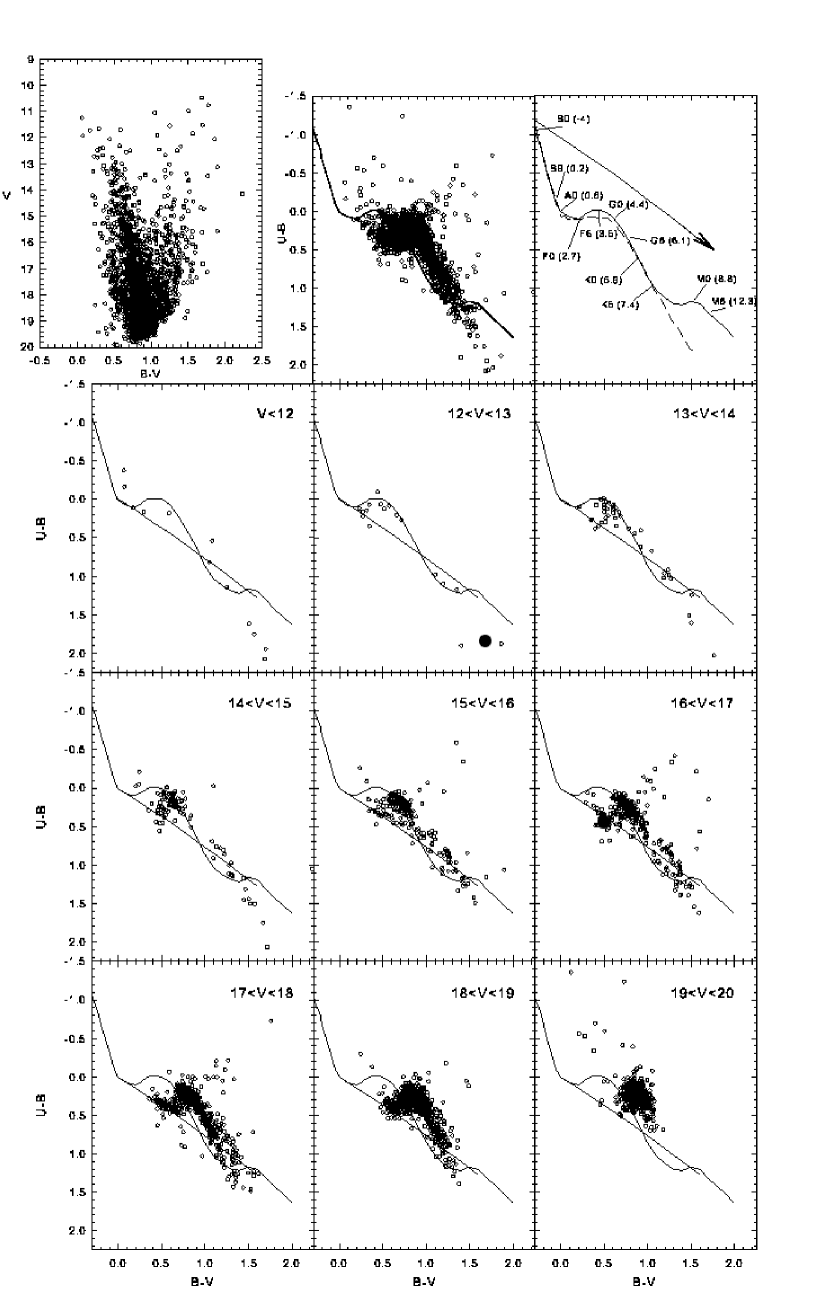
To provide a quantitative description of what is happening in this
zone we show in Fig. 4 a series of Two Color Diagrams (TCDs)
including all the
stars having , and in the entire observed field.
Each TCD corresponds to a different magnitude bin in teh CMD. The upper
middle panel is the TCD of the same stars plotted in the CMD. The
upper right panel is a reference diagram where the solid line
represents the intrinsic locus of un-reddened dwarf stars
(Schmidt-Kaler, 1982); the position of some spectral types and their
absolute magnitudes are also indicated. The arrow indicates the way a
star moves in this diagram when some reddening takes place.
The visual absorption is given by
the standard relation , which was already
found to hold in this region of the Galaxy (Moitinho 2001). The
dashed line represents the locus occupied by giant stars of similar
spectral types. In the analysis, special attention must be
paid to the overlap region of dwarf, giant and sub-giant stars at
.
It is worth mentioning that all the stars plotted in Fig. 4 have
photometric errors mag. in all the filters,
a restrictive condition applied to minimize
distortions in the diagrams.
The solid tilted line in the TCDs indicates the reddening path.
We remind that the procedure we are applying has been adapted from one developed long ago (see Fenkart et al. 1987) and is based on estimating the average reddening and distance of selected groups of stars according to the mean absolute magnitude of each group. An evident advantage of studying the stellar populations in magnitude bins is the simplicity of the morphology of the respective TCDs in contrast with the complex appearance of the global TCD (upper middle panel).
4.1 Results of the method
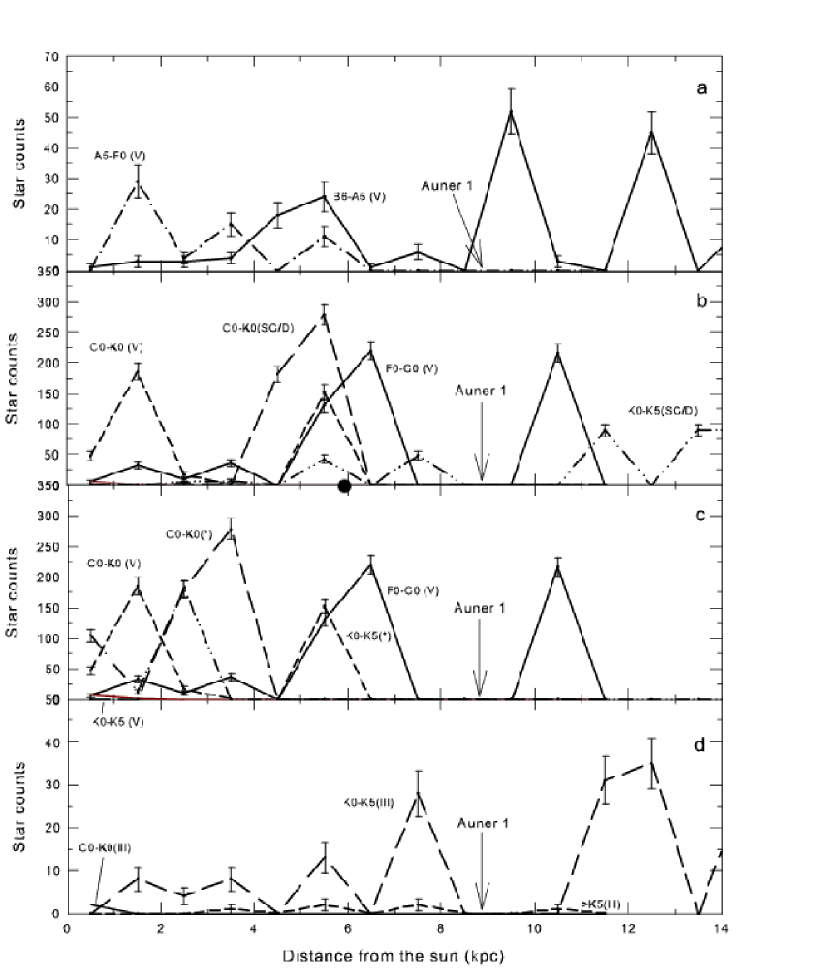
The results of the whole procedure are summarized in Table 1. Spectral types are assigned to the stars according to their position in the TCD. Mean distances and the number of stars in each spectral range are also reported. In this Table, is the number of stars and is the heliocentric distance in kpc. Fig. 5 provides a graphical representation of Table 1 to facilitate its interpretation. This Figure shows the trend of star counts with heliocentric distance for each spectral type range considered in Table 1. Star count error bars have been plotted assuming a poisson noise distribution. Star counts are not volume-normalized, being the sole aim of the Figure to help the reader understand the various entries in Table 1, and the occurence of different spectral type concentrations along the line of sight.
In panel (a), we show the behaviour of dwarf stars of
spectral types from B6 to F0 , in panel (b)
the dwarf stars of spectral types from F0 to K0
together with the probable
K0-K5 Sub Giants (SG) and dwarfs (D). In panel (c) we plot the
same stars as in (b) but considering all the SG and D stars
as dwarfs in deriving their distances and numbers. For this reason
they are indicated with an asterisk. This exercise is done in order to
understand the effects and consequences
of possible spectral type mis-interpretations.
Finally, in panel (d) the giant stars of all spectral
types are shown.
The synoptic view of Fig. 5 and Table 1 allows us to derive the
following considerations:
-
All the stars having spectral type earlier than F0 mostly identify the thin disk. This is an ensemble of early type stars located at different distances along the line of sight. According to star counts, the BP stars (earlier than A5) are not evenly distributed along the line of sight, but they show some concentrations at 5, 9.5 and 12 kpc. Beyond 12-13 kpc the uncentainties in spectral type and distance derivation do not allow us to detect unambigously any structure. These concentrations are compatible with the presence of the Local arm (and 5 kpc clump), and the Norma-Cygnus (the 9.5 and 12 kpc clumps) arm in this particular Galactic direction. The occurence of such concentrations is typical of spiral arms, whose structure is irregular and clumpy;
-
An interesting point has been raised by the referee, whether the BP stars could be in fact Halo A-type subDwarfs (sDBA). There are several reasons that indicate this is not the case. According to Thejll et al. (1997), with a mean 4.5-5.0 the sDBA would be located close to the Sun at less than 1.5 kpc. Also, the statistics of sDB stars is 0.21 stars (Green et al. 1986), much less than the number of BP stars we find in our field. Furthermore, one should explain the clear lack of such a significant population of stars in the northern Galactic hemisphere, since the Halo stars should also be seen there. The same kind of statistical considerations apply to the possibility that the BP stars might be Blue Stragglers. Finally, the BP in the field of Auner 1 is similar to the ones analyzed in our previous works (Carraro et al. 2005a; Moitinho et al. 2006), which we have shown to be excellent spiral tracers. This latter result means that the BP must be young, independently of any photometric analysis.
-
The disk dwarfs (later than F0, panels and ) show increasing concentration from the Sun , and a notorius hole at about 8-10 kpc. This behaviour is independent of a possible mis-classification of dwarf and subgiant stars;
-
Finally, the thick disk giants (panel ) although much less abundant, exhibit the same kind of distribution of disk dwarfs;
-
The star cluster Auner 1, at a distance of 9 kpc, lies where the distribution of thick disk stars shows a minimum.
4.2 The BP, Auner 1 and the Galactic disk components
The above analysis of the TCDs series makes evident that the vertical
blue sequence identified as the BP population is mostly composed of
late B- and early A-type stars from the group of stars found at
5.0 and kpc from the Sun.
In brief, the BP stars compose a narrow
band in the CMD, and are young ( Myr), with
and a distance modulus . As
the highest density of this type of stars happens between 9 and 11 kpc
from the Sun, we find this result entirely coherent with our previous
ones where we identified the BP stars as tracers of the Norma Cygnus
or outer-arm (Carraro et al. 2005, Moitinho et al. 2006, Baume et al.
2006). The other nearer component
at 5 kpc, as stated above,
belong most probably to the Local (Orion) arm.
The nature of the BP
stars has been clearly demonstrated in our diagrams because most of
the reddening happens in the first 6.5 kpc from the Sun (see Table 1)
and because the space behind must contain a small amount of dust.
Therefore, the blue stars we see are simply far
away and for this reason relatively faint.
Signatures of an old thin or thick disk (sub-giant, giant and
old dwarf stars) populations are also seen in the series of TCDs at
the middle latitude of Auner 1 where we should expect to find a low
density of them. Indeed, the TCDs show that red giant
stars follow a pattern of increasing reddening (moving from
the panel to the panel)
;
for this reason no obvious concentration like a Red Clump structure
does appear. However, when looking towards Auner 1 we are also looking
at the external border of the Galaxy where the number of components of
the thick disk, such as giant and sub-giant stars, start decreasing
quickly.
For this reason, the CMDs in Figs. 3 and 4 show at the lower envelope of the giant branch of the thick disk at
kpc below the galactic plane (a reasonable limit for
thick disk components in a warped and flared structure). Below that
magnitude range we continue to see very faint red dwarf stars,
composing the thick disk as well.
It is worth emphazising that this picture does not depend
on the particular photometric error constraints we used. In fact
in Fig. 3 and 6, we relaxed the error constraints plotting all the points
sources showing that the scenario does not change.
5 Discussion and Conclusions
In a flat Galaxy, due to the location of the Sun within the crowded thin disk and to the low spatial density of the thick disk, it is not expected to detect clear signatures of the thick disk in a CMD: i) close to b= there is high contamination from the thin disk. ii) close to b= the number of disk (thin and thick) stars is small. iii) at intermediate longitudes there is less contamination from the thin disk and an increased number of thick disk stars is present, but the large spread in distances (and reddening) will not, in general, produce clear distinctive features in the CMD.
However, the situation is different when looking across a warped disk.
Indeed, when facing the warp, the number of thick disk stars is larger
than when looking at b=, and the number of thin disk stars
will be smaller than when looking along the disk (b=). At the
same time, the thick disk stars that follow the warp will be
concentrated at an approximately common distance (when compared to the
Sun-warp distance). These combined effects will produce a recognizable
sequence of thick disk stars in a CMD (which will also include old
thin disk stars of similar age). Another expected effect is that,
because the thick disk flares, it should still be detected at lower
latitudes where the thin disk is not seen
anymore.
This is the case of the field we have analyzed in this paper, which
includes the open cluster Auner 1. We have shown that the
cluster is 3.25 Gyr old, and lies at 8.9 kpc from the Sun.
In addition to the cluster population, we have detected other
sequences, uniformly extended in our field, indicative of a young and
an old field population. The occurrence of these young and old
populations in the same field in the 3GQ is not confined to Auner 1.
The F-XMM field discussed by Bellazzini et al. (2004, their Fig. 2)
shows the same features, and also a few open clusters, among which
Tombaugh 1 (Carraro & Patat),
which is located at the same longitude and only 1 degree to the
south of Auner 1.
Fig. 3 shows that there is an excess of giant stars, and a hump of blue stars around
V18.5 and (V-I) 0.6, which appears to be the TO of an
evolved population. To emphasize this point, we show in
Fig. 6 the CMD of this region which results from removing the open
cluster Auner 1 (all the stars lying 7 arcmin from the cluster center
without any error constraints). The TO of an older population, with
its RGB and clump, remain and thus are not due to Auner 1. To
make it clearer, we also show in Fig. 6 a luminosity function (middle
panel), which displays a weak but significant jump at V 18.5
marking the TO of the old
population.
Using isochrones to estimate the parameters of this population, we
find that a Z=0.0060.003 ([Fe/H]=-0.50) 71.0 Gyrs isochrone (Fig. 7, right panel)
provides a good description of the V 18.5 TO region.
This fit is achieved by shifting the isochrone by E(B-V) =
0.350.10 and (V-MV) = 15.50.5, thus placing the bulk of
this population at about 7.0
kpc from the Sun, consistent with the findings in Table 1 and
Fig. 5.
Nevertheless, we emphasize that this fit is only indicative of the mean
properties of this population. Indeed the detailed analysis presented
in Table 1 clearly shows that the thick disk population starts to be present
at V = 17.0 reaching a maximum at 18.5. This indicates
that the thick disk stars are evenly distributed at all distances
along this particular line of sight.
Remarkably, this population possesses the typical features (age and
metal content) of the old thin or young thick disk (Norris 1999,
Bensby et al. 2004).
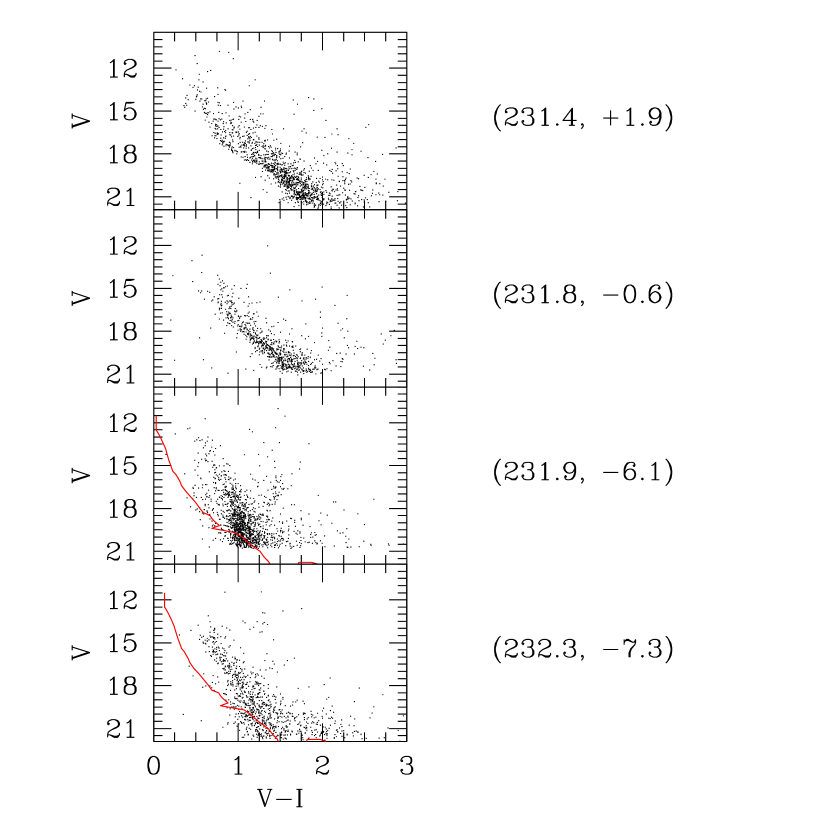
Further evidence for the Galactic nature of this population is given
in Fig. 6 by the CMDs of fields centered on the open cluster NGC 2414
(upper panel, Moitinho 2001) and Haffner 9 (upper-mid panel, Vázquez
et al. 2006) at l 232o (almost the same l as Auner 1 and
Tombaugh 1), but at b = +1o.94 and -0o.6, respectively. These
fields are well within the putative CMa galaxy (Bellazzini et
al. 2004, Fig. 1). However they do not show any presence of the young
BP or of the old TO (we call the attention of the reader to how the
blue hump of stars, seen in the lower panels around V18.5, is
not present in the upper panels). This suggests that the old
population is not ubiquitous toward CMa, like the BP is not (Carraro
et al. 2005), but seems to follow the pattern of the warped Galactic
disk. In fact the CMDs in Fig 6, normalized to the same area, show
that in the case of Tombaugh 1 (lower panel) the BP and old population
are much less abundant than in Auner 1, reflecting the geometry of the
Galactic disk and providing an estimate of the amplitude of the
warp at this longitude.
Moreover, a fit to the old background population in the field of
Tombaugh 1 implies it lies at 9.0 kpc from the Sun, a few
kpc more distant than the bulk of the old population in the field of
Auner 1. Such an increase in distance is expected, due to the warp
which would place increasingly distant stars at increasingly lower
latitudes.
References
- Auner et al. (1980) Auner G., Dengel J., Hartl H., Weinberger R., 1980, PASP 92, 422
- Baume et al. (2006) Baume G., Moitinho A., Vázquez R.A., Solivella G., Carraro G., Villanova S., 2006, MNRAS 367, 1441
- Beers et al. (1992) Beers T.C., Preston G.W., Shectman S.A., 1992 AJ 103, 1987
- Bensby et al. (2004) Bensby T., Feltzing S., Lundstrom I., 2004, A&A 421, 969
- Bellazzini et al. (2004) Bellazzini M., Ibata R.A., Monaco L., Martin N., Irwin M.J., Lewis G.F.,2004, MNRAS 354, 1278
- Carraro & Chiosi (1994) Carraro G. , Chiosi C., 1994, A&A 287, 761
- Carraro & Patat (1995) Carraro G., Patat F., 1995 MNRAS 276, 563
- Carraro et al. (2005) Carraro G., Vázquez R.A., Moitinho A., Baume G., 2005a, ApJ 630, L153
- Carraro et al. (2005) Carraro G., Geisler D., Moitinho A., Baume G., Vazquez R.A., 2005b, A&A 442, 917
- (10) Dias W.S., Alessi B.S., Moitinho A., Lepine J.R.D., 2001, A&A 389, 871
- Fenkart et al. (1987a) Fenkart R., Topaktas L., Boydag S., Kandemir G. 1987 A&AS 67, 245
- Girardi et al. (200) Girardi L., Bressan A., Bertelli G., Chiosi C., 2000, A&AS 141, 371
- Green et al. (1986) Green R.F., Schmidt M., Liebert J., 1986, ApJS 61, 305
- Lynga (1982) Lynga G., 1982, A&A 109, 213
- Mateo (1998) Mateo M., 1998, ARA&A 36, 435
- Moffat at al. (1979) Moffat A.F.J., Jackson P.D., Fitzgerald M.P., 1949, ]aaps 38, 197
- Moitinho (2001) Moitinho A., 2001, A&A 370, 436
- Moitinho et al. (2006) Moitinho A., Vázquez R.A., Carraro G., Baume G., Giorgi E.E., Lyra W. 2006,MNRAS 368, L77
- Momany et al. (2004) Momany Y., Zaggia S.R., Gilmore G., Piotto G., Carraro G., Bedin L., De Angeli F., 2006, A&A in press
- Norris (1999) Norris J.E. 1999, Ap&SS 265, 213
- Ortolani et al. (2005) Ortolani S., Bica E., Barbuy B., Zoccali M. 2005 A&A 429, 607
- Pandey et al. (2006) Pandey A.K., Sharma S., Ogura K., 2006, MNRAS, preprint
- Schlegel et al. (1998) Schlegel D.J., Finkbeiner D.P., Davis M., 1998, ApJ 500, 525
- Schmidt-Kaler (1982) Schmidt-Kaler, Th. 1982, Landolt-Börnstein, Numerical data and Funct ional Relationships in Science and Technology, New Series, Group VI, Vol. 2(b), K. Schaifers and H.H. Voigt Eds., Springer Verlag, Berlin, p.14
- Thejll et al. (1997) Thejll P., Flynn C., Williamson R., Saffer R., 1997, A&A 317, 689
- Vazquez et al. (2006) Vázquez R.A., Carraro G., May J., Moitinho A., Bronfmann L., Baume G., 2006, ApJ submitted
| Dwarf stars of early spectral type | ||||||||||||||||||||
| E(B-V) | 0.2 | 0.1 | 0.25 | 0.3 | 0.45 | 0.50 | 0.6 | 0.65 | ||||||||||||
| N | d | N | d | N | d | N | d | N | d | N | d | N | d | N | d | N | d | total | ||
| B6-A0 | -0.20 | 2 | 1.5 | 1 | 3.8 | 3 | 5.4 | 6 | 7.2 | 4 | 9.0 | 5 | 14.4 | 5 | 2 | 28 | ||||
| A0-A5 | 0.8 | 1 | 0.9 | 1 | 1.9 | 2 | 2.4 | 3 | 3.5 | 17 | 4.6 | 21 | 5.7 | 45 | 9.1 | 45 | 12.0 | 19 | 154 | |
| A5-F0 | 2.1 | 5 | 1.0 | 6 | 1.3 | 14 | 1.9 | 4 | 2.5 | 14 | 3.1 | 15 | 5.0 | 58 | ||||||
| Dwarf stars of late spectral type | ||||||||||||||||||||
| E(B-V) | 0.0 | 0.0 | 0.0 | 0.0 | 0.0 | 0.1 | 0.2 | 0.3 | 0.3 | |||||||||||
| N | d | N | d | N | d | N | d | N | d | N | d | N | d | N | d | N | d | total | ||
| F0-G0 | 3.4 | 1 | 0.4 | 5 | 0.6 | 12 | 1.0 | 19 | 1.6 | 10 | 2.6 | 36 | 3.6 | 125 | 5.0 | 219 | 6.8 | 216 | 10.4 | 643 |
| G0-K0 | 4.9 | 1 | 0.2 | 1 | 0.3 | 11 | 0.5 | 31 | 0.8 | 87 | 1.3 | 91 | 1.7 | 152 | 5.2 | 374 | ||||
| K0-K5 | 6.5 | 2 | 0.2 | 2 | ||||||||||||||||
| Dwarf star of late spectral type or sub-giant star candidates | ||||||||||||||||||||
| E(B-V) | 0.0 | 0.0 | 0.0 | 0.0 | 0.0 | 0.1 | 0.2 | 0.3 | ||||||||||||
| N | d | N | d | N | d | N | d | N | d | N | d | N | d | N | d | N | d | total | ||
| G0-K0 | 3.9 | 181 | 4.0 | 278 | 5.2 | 459 | ||||||||||||||
| K0-K5 | 1.7 | 5 | 2.3 | 7 | 3.6 | 42 | 5.7 | 48 | 7.9 | 89 | 11.0 | 91 | 14.0 | 282 | ||||||
| Giant star | ||||||||||||||||||||
| E(B-V) | 0.2 | 0.1 | 0.15 | 0.2 | 0.25 | 0.25 | 0.3 | |||||||||||||
| N | d | N | d | N | d | N | d | N | d | N | d | N | d | N | d | N | d | total | ||
| G0-K0 | 0.8 | 2 | 0.2 | 2 | ||||||||||||||||
| K0-K5 | 0.3 | 8 | 1.0 | 4 | 2.3 | 8 | 3.5 | 13 | 5.2 | 28 | 7.5 | 35 | 12.0 | 29 | 17.0 | 125 | ||||
| K5 | -0.5 | 1 | 3.4 | 2 | 5.0 | 2 | 7.5 | 1 | 10.9 | 6 | ||||||||||