Probing The Universe With Neutrinos At 20 Minutes And 400 Thousand Years
Abstract
Big Bang Nucleosynthesis (BBN) and the Cosmic Background Radiation (CBR) provide complementary probes of the early evolution of the Universe and of its particle content. Neutrinos play important roles in both cases, influencing the primordial abundances of the nuclides produced by BBN during the first 20 minutes as well as the spectrum of temperature fluctuations imprinted on the CBR when the Universe is some 400 thousand years old. In this talk I review the physical effects of neutrinos at these different epochs in the evolution of the Universe and compare the theoretical predictions with the observational data to explore the consistency of the standard models of cosmology and particle physics and to constrain neutrino physics as well as more general, beyond-the-standard-model physics.
1 Introduction
The Universe is expanding and is filled with radiation. All wavelengths (e.g., of photons as well as the deBroglie wavelengths of freely expanding massive particles) are stretched along with the expansion. As a result, during its earlier evolution the Universe was hot and dense. The combination of high temperature (energy) and density ensures that the collision rate among particles is very high during very early epochs, guaranteeing that all particles, with the possible exception of those with gravitational strength interactions, were in equilibrium at sufficiently early times. As the early Universe expands and cools, interaction rates decline and, depending on the strength of their interactions, different particles fall out of equilibrium at different epochs. For neutrinos (the standard, “active” neutrinos , , ) the departure from equilibrium occurs when the Universe is a few tenths of a second old and the temperature of the CBR photons, pairs, and the neutrinos is a few MeV. It should be noted that departure from equilibrium is not sharp and collisions continue to occur; for MeV, the neutrino interaction rates become slower than the universal expansion rate (as measured by the Hubble parameter ) and the neutrinos effectively decouple from the CBR photons and the pairs present at that time. However, electron neutrinos (and antineutrinos) neutrinos continue to interact with the baryons (nucleons) via the charged-current, weak interactions until the Universe is a few seconds old and the temperature has dropped below an MeV. Once again, this decoupling is not abrupt (the neutrinos do not “freeze-out”) and two body reactions among neutrons, protons, pairs and () continue to influence the ratio of neutrons to protons, albeit not sufficiently rapidly to permit the ratio to track its equilibrium value of n/p = exp, where MeV. As a result, the n/p ratio decreases from at “freeze-out” to when BBN begins at sec ( keV). Since the neutrinos are extremely relativistic during these epochs, they can influence BBN in several ways. The standard cosmology, universal expansion rate is determined through the Friedman equation by the total energy density which, during these early epochs, is dominated by massless particles along with those massive particles which are extremely relativistic: CBR photons, pairs, neutrinos. The early Universe is “radiation” dominated and neutrinos are a significant component of the “radiation”. In addition, through their charged-current weak interactions the electron-type neutrinos help to control the neutron-to-proton ratio, effectively limiting the primordial abundance of 4He. Furthermore, if there is a lepton asymmetry (e.g., more than or, vice-versa), much larger than the universal baryon asymmetry, the weak rates interconverting neutrons and protons would be affected as well.
Although pairs annihilated during the first few seconds, the surviving electrons (equal in number to the protons to ensure charge neutrality) and the CBR photons interact electromagnetically, tying the photons to the electrons (via Compton scattering). Only after the electrons and nuclides (mainly protons and alphas) combine to form neutral atoms (“recombination”) are the CBR photons released from the tyranny of the electrons to become freely propagating. This occurs when the Universe is some 400 thousand years old and the relic photons, redshifted to the currently observed black body radiation at K, bring us a snapshot of the universe at this early epoch. At this relatively late stage in the early evolution of the Universe, the key role of the freely propagating, relativistic neutrinos is in contributing to the total radiation density, determining the universal expansion rate (e.g., the time – temperature relation). It should be noted that if the neutrino masses are sufficiently large the neutrinos will have become nonrelativistic and their free-streaming, at , has the potential to damp density fluctuations in the baryon fluid. This important topic, which is not addressed here, was covered by Scott Dodelson in his talk; the interested reader is directed to his contribution to this volume.
The primordial abundances of the relic nuclei produced during BBN depend on the baryon (nucleon) density and on the early-Universe expansion rate. The amplitudes and angular distribution of the CBR temperature fluctuations also depend on these same parameters (as well as on several others). The universal abundance of baryons may be quantified by comparing the number of baryons (nucleons) to the number of CBR photons,
| (1) |
As the Universe expands the densities of baryons and photons decrease but the numbers of baryons and of CBR photons in a comoving volume are unchanged (post-annihilation) so that measured at present, at BBN, and at recombination should all be the same. This is one of the key cosmological tests. Since the baryon mass density (, where is the present critical mass density) plays a direct role in the growth of perturbations, it is convenient to quantify the baryon abundance using a combination of and , the present value of the Hubble parameter () measured in units of 100 kms-1Mpc-1,
| (2) |
The Hubble parameter, , measures the expansion rate of the Universe. Deviations from the standard model () may be parameterized by an expansion rate parameter . Since in the standard model is determined by the energy density in relativistic particles, deviations from the standard cosmology () may also be quantified by the “equivalent number of neutrinos” . Prior to annihilation, these two parameters are related by
| (3) |
Note that is a convenient way to quantify any deviation from the standard model expansion rate and is not necessarily related to extra (or fewer!) neutrinos.
The question to be addressed here is, “Are the predictions and observations of the baryon density and expansion rate of the Universe at 20 minutes (BBN) and 400 thousand years (CBR) in agreement with each other and with the standard models of cosmology and particle physics?”. If yes, what constraints are there on beyond-the-standard-model models? Given the limited space allocated to this article, only the current status of this quest is summarized here. The reader will find more detail and further references in my recent review article [1].
2 The Universe At 20 Minutes: BBN
Nuclear reactions among neutrons and protons occur at large rates during the early evolution of the Universe but until the Universe has cooled sufficiently ( keV, minutes), they fail to yield significant abundances of complex nuclides because of their competition with photo-destruction reactions involving the enormously more numerous CBR photons (gamma-rays). Once BBN begins the available neutrons are consumed very quickly to build 4He and all further nucleosynthesis among electrically charged nuclides (H, D, T, 3He, 4He) involves reactions which become Coulomb-supressed as the Universe expands and cools. As a result BBN terminates when keV ( min). In the first minutes of its evolution the cosmic nuclear reactor produces (in astrophysically interesting abundances) deuterium, helium-3 (any tritium decays to 3He), helium-4 and, because of the gaps at mass-5 and mass-8, only a trace amount of lithium-7 (produced mainly as berylium-7 which, later in the evolution captures an electron and decays to 7Li).
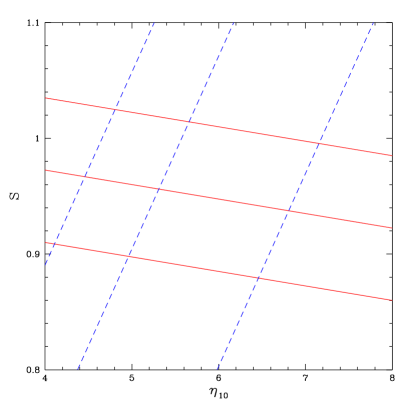
Of the light nuclides produced during BBN, the abundances of D, 3He, and 7Li are determined by the competition between two body production and destruction rates which are dependent on the overall density of baryons. As a result, these nuclides are all potential baryometers. Of these, D is the baryometer of choice since its post-BBN evolution is simple (D is only destroyed, burned to 3He and beyond, when gas is incorporated into stars) and the BBN-predicted abundance is a relatively sensitive function of the the baryon density (D/H ). In contrast, the primordial abundance of 4He is relatively insensitive to the baryon density, depending mainly on the abundance of neutrons when BBN begins. The 4He relic abundance is usually expressed as a “mass fraction” YP , where (since this assumes , YP is not the true helium mass fraction). Since the expansion rate (), in combination with the rate of the charged-current weak interactions, plays an important role in regulating the pre-BBN neutron to proton ratio, YP is sensitive to . As shown by the D and 4He isoabundance curves in Figure 2, deuterium and helium-4 provide complementary probes of the universal baryon density and expansion rate.
While most models of particle physics beyond the standard model adopt (or impose) a lepton asymmetry of the same order of magnitude as the (very small!) baryon asymmetry (), lepton (neutrino) asymmetries orders of magnitude larger are currently not excluded by any experimental data. In analogy with which measures the baryon asymmetry, the lepton (neutrino) asymmetry, , may be quantified by the ratios of the neutral lepton chemical potentials () to the temperature (in energy units) , where
| (4) |
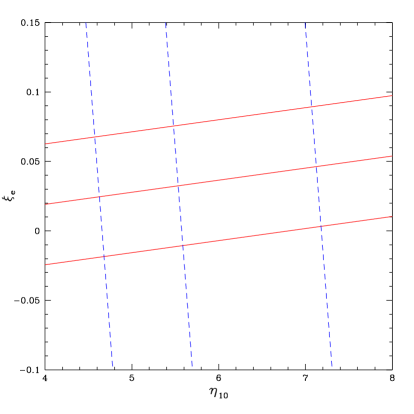
Although any neutrino degeneracy always increases the energy density in the neutrinos, resulting in an effective , the range of of interest to BBN is limited to sufficiently small values that the increase in due to a non-zero is negligible. However, a small asymmetry between electron type neutrinos and antineutrinos (; ), while large compared to the baryon asymmetry, can have a significant impact on BBN by modifying the pre-BBN neutron to proton ratio. The corresponding D and 4He isoabundance curves in the plane are shown in Figure 2.
For restricted but interestingly large ranges of (), (), and , Kneller and Steigman [2] found simple but accurate fits to the BBN-predicted abundances of the light nuclides. For D ((D/H)) and 4He (YP), these are
| (5) |
where
| (6) |
2.1 Observed Relic Abundances
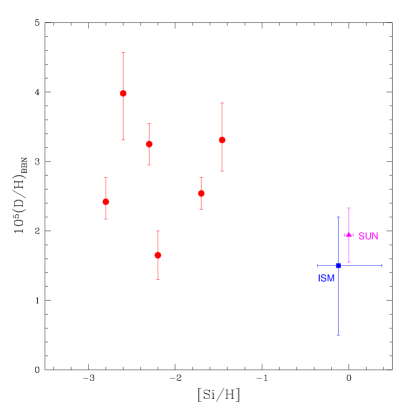
Although there are observations of deuterium in the solar system and the interstellar medium (ISM) of the Galaxy which provide interesting lower bounds to its primordial abundance, it is observations of relic D in a few (too few!), high redshift, low metallicity, QSO absorption line systems (QSOALS) which are of most value in enabling estimates of the primordial abundance. The identical absorption spectra of D and H (modulo the velocity/wavelength shift resulting from the heavier reduced mass of the deuterium atom) is a liability, limiting the number of useful targets in the vast Lyman-alpha forest of QSO absorption spectra (see, e.g., Kirkman et al. [3] for further discussion). Through 2003 there were only five QSOALS with deuterium detections leading to reasonably reliable abundance determinations [3] (and references therein); these, including a very recent sixth determination by O’Meara et al. [4], are shown in Figure 4. Also shown for comparison are the solar system and ISM D abundances. There is clearly excessive dispersion among the low metallicity D abundances which tends to mask the anticipated primordial deuterium plateau, suggesting that systematic errors, whose magnitudes are hard to estimate, may have contaminated the determinations of at least some of the D and/or H column densities. Despite these concerns, the best that can be done with the present data is to identify the relic deuterium abundance with the weighted mean of the high-, low- D/H ratios: , corresponding to (see eq. 5).
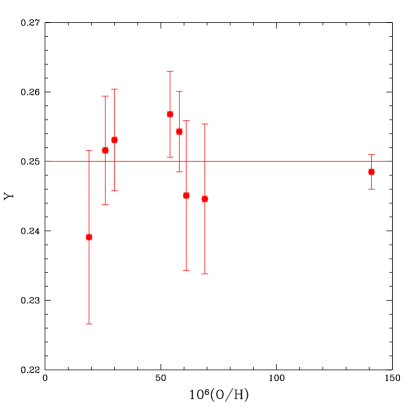
The post-BBN evolution of 4He is also quite simple. As gas cycles through generations of stars, hydrogen is burned to helium-4 (and beyond), increasing the 4He abundance above its primordial value. Therefore the present 4He mass fraction, Y0, has received a significant contribution from post-BBN, stellar nucleosynthesis, and Y YP. However, since the “metals” such as oxygen are produced by short-lived, massive stars and 4He is synthesized (to a greater or lesser extent) by all stars, at very low metallicity the increase in Y should lag that in, e.g., O/H, so that as O/H , Y YP. Therefore, although 4He is observed in the Sun and in Galactic H regions, the key data for inferring its primordial abundance are provided by observations of helium and hydrogen emission (recombination) lines from low-metallicity, extragalactic H regions. The present inventory of such regions studied for their helium content exceeds 80 (see Izotov & Thuan (IT) [5]). Since for such a large data set even modest observational errors for the individual H regions can lead to an inferred primordial abundance whose formal statistical uncertainty is very small, special care must be taken to include hitherto ignored systematic corrections and/or errors. It is the general consensus that the present uncertainty in YP is dominated by the latter, rather than by the former errors. However, attempts to include estimates of them have often been unsystematic or absent. To account for some of these uncertainties, Olive, Steigman, and Walker [6] followed the Fields and Olive [7] analysis to estimate a confidence range of (for Y, this corresponds to ; see eq. 5). The most systematic analysis to date is that of the IT data by Olive & Skillman 2004 (OS) [8]. Using criteria outlined in their earlier paper [8], OS examined the IT data set and decided they could apply their analysis to only 7 of the 82 IT H regions. This tiny data set, combined with its limited range in oxygen abundance, severely limits the statistical significance of the OS conclusions. In Figure 4 are shown the OS-inferred helium abundances from the IT data set and from one, higher metallicity H region observed by Peimbert et al. [9]. From these eight H regions alone there is no evidence that the helium abundance is correlated with the oxygen abundance; the weighted mean is Y, leading to a robust upper bound on the primordial helium abundance of YP (corresponding to ).
2.2 Comparison Between BBN-Predicted And Observed Relic Abundances
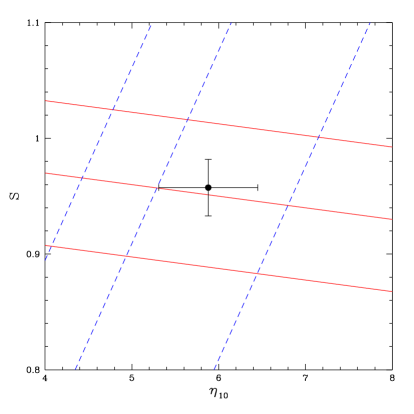
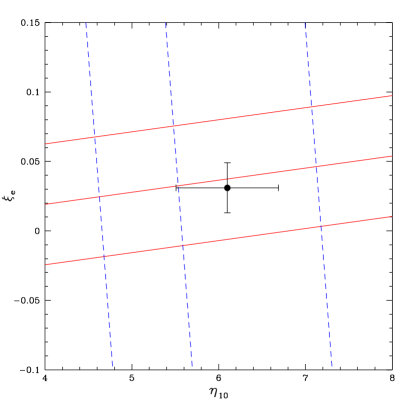
The relic abundances adopted here correspond to and . In the absence of a large lepton asymmetry (), this implies (N) and (). This is consistent with the standard model (, Nν = 3) at (see Figure 6). For the standard expansion rate/particle content (, Nν = 3), the inferred values of and result in and (). At , this is consistent with no lepton asymmetry (; see Figure 6). The confrontation of the BBN predictions with the relic abundance observations of D and 4He reveals internal consistency (at ) of the standard models of particle physics (N, ) and cosmology () and it fixes the baryon abundance to an accuracy of during the first few minutes of the evolution of the Universe. At the same time this comparison sets constraints on possible deviations from these standard models (e.g., N). How do these BBN results compare with what the CBR reveals about the Universe some 400 thousand years later?
3 Confrontation With The CBR
The angular spectrum of CBR temperature fluctuations depends on several key cosmological parameters, including the baryon density and the relativistic energy density (for further discussion and references, see Hu and Dodelson 2002 [10] and Barger et al. 2003 [11]), thereby providing a probe of and Nν some 400 kyr after BBN. However, the CBR temperature fluctuation spectrum is blind to any sufficiently small lepton asymmetry . With Nν allowed to depart from the standard model value, Barger et al. [11] found the first year WMAP data [12] is best fit by = 0.0230 and Nν = 2.75, in excellent agreement with the purely BBN results above. In fact, the CBR is a much better baryometer than it is a chronometer, so that while the range for the baryon density is limited to , the corresponding range for Nν was found to be [11].
Quite recently the WMAP team released (and analyzed) their 3-year data. For Nν = 3, Spergel et al. 2006 [13] find . When Nν is free to vary, V. Simha and the current author, in very preliminary work in progress, find a similar result for the baryon density (not unexpected since in fitting the CBR data the baryon density and the relativistic energy density are largely uncorrelated), , along with a range for Nν which is virtually unchanged from the previous WMAP-based result [11]: . However, this latter result, and those of Spergel et al. 2006 and Seljak, Slosar, and McDonald 2006 [13] are not in very good agreement with each other and until the differences are fully understood, this constraint should be regarded with a very large grain of salt.
4 Summary
Comparison between the BBN predictions and relic abundance observations of deuterium and helium-4 reveals consistency with the standard models of particle physics and cosmology and constrains the value of the baryon abundance during the first few minutes of the evolution of the Universe. This comparison also enables quantitative constraints on possible deviations from these standard models, particularly in the neutrino sector. Some 400 thousand years later, when the CBR photons are set free, the angular spectrum of temperature fluctuations encodes information about several key cosmological parameters, including Nν and the baryon density. The present data reveal consistency (at ) between the values of and Nν inferred from the first few minutes of the evolution of the Universe and from a snapshot of the Universe some 400 kyr later. While there is room for surprises, at present the standard models appear robust.
The author’s research is supported at The Ohio State University by a grant (DE-FG02-91ER40690) from the US Department of Energy.
References
- [1] Steigman G 2006 Int. J. Mod. Phys. E 15 1
- [2] Kneller J P and Steigman G 2004 New J. Phys. 6 117
- [3] Kirkman D, Tytler D, Suzuki N, O’Meara J and Lubin D 2003 ApJS 149, 1
- [4] O’Meara J M, Burles S, Prochaska J X, Prochter G E, Bernstein R A, and Burgess K M 2006 (astro-ph/0608302)
- [5] Izotov I T and Thuan T X 1998 ApJ 500 188; Izotov I T and Thuan T X 2004 ApJ 602 200 (IT)
- [6] Olive K A, Steigman G, and Walker T P 2000 Phys. Rep. 333-334 389
- [7] Fields B D and Olive K A 1998 ApJ 506 177
- [8] Olive K A and Skillman E D 2001 New Astron. 6 119; Olive K A and Skillman E D 2004 ApJ 617 29 (OS)
- [9] Peimbert M, Peimbert A and Ruiz M T 2000 ApJ 541 688; Peimbert A, Peimbert M and Luridiana V 2002 ApJ 565 668
- [10] Hu W and Dodelson S 2002 Ann. Rev. Astron. & Astrophys. 40 171
- [11] Barger V, Kneller J P, Lee H-S, Marfatia D, and Steigman G 2003 Phys. Lett. B 569 123
- [12] Spergel D N et al. 2003 ApJ Suppl. 148 175
- [13] Spergel D N et al. 2006 (astro-ph/0603449); Seljak U, Slosar A and McDonald P 2006 (astro-ph/0604335)