Strong dusty bursts of star formation in galaxies falling into the cluster RXJ0152.7-1357.
Abstract
We have observed the cluster RX J0152.7-1357 (z0.83) at 24m with the Multiband Imaging Photometer for Spitzer (MIPS). We detected twenty-two sources associated with spectroscopically confirmed cluster members, while ten more have photometric redshifts compatible with membership. Two of the 32 likely cluster members contain obvious active nuclei while the others are associated with dusty star formation. The median IR-determined star formation rate among the remaining galaxies is estimated at 22 M⊙ yr-1, significantly higher than in previous estimates from optical data. Most of the MIR-emitting galaxies also have optical emission lines, but a few do not and hence have completely hidden bursts of star formation or AGN activity.
An excess of MIR-emitting galaxies is seen in the cluster in comparison to the field at the same redshift. The MIR cluster members are more associated with previously detected infalling late type galaxies rather than triggered by the ongoing merging of bigger X-ray clumps. Rough estimates also show that ram pressure may not be capable of stripping the gas away from cluster outskirt galaxies but it may disturb the gas enough to trigger the star formation activity. Harassment can also play a role if for example these galaxies belong to poor galaxy groups. Thus, bursts of star formation occur in the cluster environment and could also help consume the galaxy gas content in addition to ram pressure, harassment or galaxy-galaxy strong interactions.
Subject headings:
Galaxies: evolution – Infrared: galaxies – Galaxies: starburst – galaxies: clusters: individual (RXJ0152.7-1357)1. Introduction
Galaxies formed first followed by bigger structures such as galaxy clusters and filaments, as demonstrated both by semi-analytic models of galaxy formation (combining large cosmological N-body simulations with simple, semi-analytic recipes for the baryons, e.g. GALICS, Devriendt & Guiderdoni, 2000, Hatton et al., 2003 ) and also by simulations of structure formation (with gas hydrodynamics, cooling and an empirical law for star formation, e.g. RAMSES, Teyssier, 2002). Thus, clusters grow by accreting field galaxies, entire galaxy groups, or even entire substructures. The morphology and spectral properties of the infalling objects are strongly affected by the dense cluster environment, and these galaxies rapidly evolve from blue disk dominated galaxies into early type galaxies without star formation (E,S0).
Many mechanisms have been invoked to explain these rapid morphological and spectral changes in cluster galaxies, the decrease of the star formation activity of infalling objects, and the lack of star formation in the cluster centers. They include interaction with the cluster potential, ram pressure stripping (Gunn & Gott 1972, Abadi, Moore & Bower 1999), cluster tidal forces (Fujita 1998), violent galaxy encounters (Lavery & Henry, 1994) or rapid galaxy encounters such as galaxy harassment (Moore et al. 1996). However, it is not known whether the infalling objects experience a burst of star formation before this process is finally quenched.
Butcher & Oemler (1978, 1984, BO effect hereafter) found that the fraction of blue galaxies, fB,increased from nearly zero at z 0 to 20% at z0.4. The galaxies responsible for the BO effect are associated with star-forming spiral or irregular cluster galaxies (Couch et al., 1994, Dressler et al., 1997). Spectroscopic studies (Dressler & Gunn, 1983, Dressler et al., 1985, Dressler & Gunn, 1992, Dressler et al., 1999, Poggianti et al., 1999) confirm the lack of emission-line galaxies among cluster members and the decline of strong star formation for moderate-redshift (z=0.35-0.55) clusters compared with the moderate-redshift field galaxies. Couch et al. (2001) studied H-emitting galaxies in the cluster AC 114 (z=0.32) and concluded that star formation is strongly and uniformly suppressed. They found that the star formation inferred from H was always less than 4 M⊙/yr, excluding strongly star forming systems. In addition, the H luminosity function was an order of magnitude below that observed for field galaxies at the same redshift. Using the Canadian Network for Observational Cosmology1 (CNOC1) data to provide [OII] emission line measurements in a sample of 15 X-ray luminous clusters at 0.18z0.55, Balogh et al. (1999) confirmed that cluster environments are not responsible for inducing starbursts. It is still debated whether cluster galaxies experienced a burst of star formation 1-2 Gyrs prior to the observations or if the star formation is gradually quenched and whether post starburst cluster members are in excess with respect to field galaxies at moderate redshift. Dressler et al. (1999) found that post starburst objects such as k+a/a+k galaxies (galaxies without [OII] emission lines but with H absorption lines (Dressler et al., 1999), or K+A galaxies (Dressler & Gunn) 1983), are an order of magnitude more frequent in moderate redshift clusters than among field galaxies. However, Balogh et al. (1999) did not find an excess of k+a/a+k galaxies in clusters compared with the field.
All the previous studies used optical emission lines to derive star formation properties. However these lines can be strongly attenuated by dust and therefore a large part of the star formation could be hidden partially or entirely. Using radio data, which is not sensitive to dust extinction, Smail et al. (1999) found that a significant number of the apparently post starburst (k+a/a+k) objects in A851 (z=0.41) are undergoing bursts of star formation that are completely hidden. Poggianti et al. (1999) have also suggested that dust can hide a large part of the star formation in clusters. Poggianti & Wu (2000) showed that 50% of a sample of cluster Very Luminous Infrared Galaxies (log (LIR/L⊙)11.5 where LIR is the total infrared luminosity in the [8-1000 m] range) exhibit e(a) spectra (i.e. with O[II] emission lines and EW(H)4 in the classification from Dressler et al., 1999). This emphasizes that these galaxies cannot be interpreted simply as post-starburst galaxies in dust free models because they are highly extincted.
Infrared galaxies are common in the local universe, but extreme objects such as Luminous Infrared Galaxies (LIRGs, with mLL☉] ) and Ultra Luminous Infrared Galaxies (LIRGs, with LIR[8-1000 mLL☉] ) are rare (Sanders & Mirabel, 1996). They are also found to be extremely rare in local clusters. Bicay & Giovanelli (1987) studied a sample of 200 FIR sources in seven local clusters and did not find such extreme objects. The survey of several clusters by ISO (see the review from Metcalfe et al., 2005), Fadda et al. (2000), Biviano et al. (2004) and Metcalfe et al. (2003) confirmed this finding.
However LIRGs are more common in the distant universe and dominate the infrared luminosity function at 0.5 z 1 (e.g., Le Floc’h et al. 2005, Pérez-González et al. 2005). LIRGs were also found in more distant clusters studied by ISOCAM such as Cl0024+1654 (z=0.39, Coia et al. 2005) or J1888.16Cl (z=0.56, Duc et al. 2004) showing a significance evolution of the activity of IR sources in clusters.
This paper uses Spitzer/MIPS data to study infrared-emitting galaxies in the cluster RX J0152.7-1357. Our target (section 2) is at z=0.83, where LIRGs play a dominant role in the field. The reduction and analysis of the observations are described in section 3. We present the basic results in section 4, and discuss them in the context of cluster galaxy evolution in section 5. Throughout this paper, we assume Ho= 75 km s-1 Mpc-1, = 0.3 and .
2. The Cluster
The cluster RX J0152.7-1357 was independently discovered in the RDCS survey (Rosati et al., 1998), in the SHARC survey ( Romer et al., 2000), and in the WARPS survey (Ebeling et al. 2000). The rest frame X-ray luminosity within an aperture of 1.5 Mpc is estimated to be LX=(6.8 0.6) 1044 h erg s-1 (Della Ceca et al. 2000). Observations from Chandra and XMM show the intracluster medium (ICM) has a complex structure with two peaks of X-ray emission, supporting the view of an ongoing merger of these two substructures (Maughan et al. 2003, Huo et al. 2004).
The extensive optical spectroscopic surveys of Demarco et al. (2005) and Jørgensen et al. (2005) identified respectively 102 and 29 cluster members. They are mainly distributed in the two X-ray substructures and the cluster looks like a filament perpendicular to the line of sight according to the distribution of these cluster members. Kodama et al. (2005) used photometric redshifts to find evidence for large scale structures around this cluster. These structures, one hosting the cluster and oriented NS and another one extending from NE-SSW, were spectroscopically confirmed by Tanaka et al. (2006). Blakeslee et al. (2006) showed that there is an offset of about 1000 km s-1 between the redshift distributions of late and early type galaxies suggesting an infall of late type objects onto the cluster.
RXJ052 is then a massive, dynamically young, and unvirialized cluster. Because merging of substructures and infalling are detected, it is an interesting target to study whether dust enshrouded star formation can be induced in a cluster environment or if this environment only quenches star formation.
3. Observations, data reduction, source detection and catalogs
3.1. MIR data
Deep 24 m observations were obtained in August 2004 with MIPS. We observed a 10’ 5’ field for a total of 3.6 ksec per sky pixel. The data were reduced with the MIPS Data Analysis Tool (Gordon et al., 2005). The final mosaic has an interpolated pixel size of 1245. An expected 1 rms photon noise level of 12 Jy should be reached in this exposure. However we performed aperture photometries at several positions where no objects were detected and estimated a detection level at 1 rms of 19 Jy in the inner 5’5’ field. The latter takes into account both the photon noise and the confusion limit. We concentrated on this region hereafter because of the lack of spectroscopic redshifts outside it. The astrometry of the field was checked with the ESO star catalog and NED and is better than 2”. Point source extraction and photometry were performed using DAOPHOT (Stetson, 1987) as described in Papovich et al. (2004), since the sources we are studying are unresolved. We detected 201 sources with 60 Jy among which 153 are 83 Jy.
3.2. Optical data
In addition, the cluster was observed with the HST ACS in November 2002 in the F625W, F775W, F850LP bandpasses (PI : H. Ford). We downloaded the flat–fielded images from the HST archive, cross-correlated to measure the alignment offsets not accounted for by the world coordinate system, and then mosaicked the images using MultiDrizzle version 2.5.
3.3. X-ray data
We downloaded the available Chandra data (PI : H. Ebeling) for RXJ0152.7-1357 from the archive, which included 34 ks of good data (excluding flares). We reduced the data using Ciao 3.2, following the CXC threads. We also created a point-source catalog from the Chandra data. To do so, we reduced each ACS-I chip separately, creating exposure–corrected images in the standard bands (0.5–8 keV, 0.5–2 keV, 2–8 keV, 4–8 keV). To identify sources, we ran the Ciao task Wavdetect on each chip, in each band, using the spatial wavelet scales used by Brandt et al. (2001), which are optimized for point source detection. For the wavdetect significance threshold of , there are likely to be 0.4 spurious sources in our catalog. For each source, we performed photometry in each band, on the exposure–corrected image, using a circular aperture whose radius is the encircled energy radius at that detector position and energy band. The sky annulus had an inner radius equal to the encircled energy radius, and an outer radius twice as large. We converted the exposure–corrected photons to ergs cm by multiplying by the flux-weighted energy of the band, and applying a aperture correction.
3.4. MIR catalog of cluster members
We cross-correlated the spectroscopically confirmed galaxy members and non-members from Demarco et al. (2005), Jørgensen et al.(2005), and Tanaka et al. (2006) with the MIPS objects, using a 2” search radius. This positional tolerance accounts for the MIPS positional accuracy and the fact that the brightest optical emission can be shifted from the MIR peaks (e.g., as in the Antennae galaxy, Mirabel et al., 1998). Twenty-two members (18 from the Demarco list, 3 more from the Tanaka list and 1 more from the Jørgensen list) were associated with unique MIR sources, while one association was rejected because the optical counterpart is not unique. An additional 17 MIR sources appear to be background or foreground objects. Using only spectroscopic redshifts allowed us to associate 19% of the MIPS sample with a unique redshift, which emphasizes the need to also use photometric redshifts.
Kodama et al (2005) performed deep observations (reaching MV* + 4) on RXJ0152.7-1357 in the VRi’z’ Suprime-Cam bands and derived photometric redshifts using the photometric redshift code presented in Kodama, Bell & Bower (1999). Tanaka et al. (2006) compared and showing that z= - = 0.01 0.02 111median value with 1- error bar. for the 200 galaxies with a spectroscopic redshift in the 0.76-0.88 range222z=0.01 0.02 for the subsample of galaxies with a photometric redshift in this range and a spectroscopic redshift., showing the good accuracy of their photometric redshifts. However photometric redshift estimation sometimes suffers from small numbers of strong outliers (z0.4). These wrong redshift estimations do not have a strong influence when studying statistical properties of a large number of galaxies and are taken into account in error bars, but can be important when using a small subsample of galaxies from a bigger sample of photometric redshifts. We have checked in the final sample of spectroscopic redshifts the probability that a galaxy with a spectroscopic redshift out of the 0.76-0.88 range, has a falling in this range. It appears that of 151 such sources, only 7% have a photometric redshift in the 0.77-0.88 range. In addition to the outliers, the spectroscopic data used to compare with the photometric redshifts may be biased against red cluster members, for which photometric estimates are known to be more efficient. Bluer galaxies (including many MIPS detections) may have less-confident redshifts; Tanaka et al (2006) showed that their photometric redshifts do not work well for very blue galaxies at z0.8.
We have therefore checked the accuracy of the photometric redshifts on the MIPS sources. Taking into account the subsample of these sources with a spectroscopic redshift, we estimated the accuracy of the photometric redshifts to be zMIPS=+0.01, which shows that the photometric redshifts using the VRi’z’ Suprime-Cam bands work well for MIPS sources. However they do not work for the two most luminous objects in the MIR, which are AGN (detailed in subsection 4.1) since z=zspec-zphot=-0.08 and -0.58 for them 333As it is shown in section 4.1, the other MIPS sources do not show any obvious evidence of AGN activiy.
We cross-correlated the 162 other MIR sources with the photometric redshift list from Tanaka et al. (2006). We associate 99 out of the 162 sources with a unique optical counterpart, among which 10 have a photometric redshift in the 0.80-0.87 range and may be cluster members. We were not able to associate a unique optical counterpart for 45 of the MIR detections, but only four of these cases among all the possible optical counterparts have photometric redshifts in the [0.76-0.88] range. As a consequence, we have omitted these MIR objects from our study because they have a very low probability of belonging to the cluster. No optical counterparts on either the ACS image or the Tanaka et al. (2006) images were found for the other sources.
Two subsamples were defined for the purpose of this paper : the subsample, composed of the 22 spectroscopically confirmed 24m-detected cluster members, and the sample with the ten likely 24m members that have only a photometric redshift in the 0.80-0.87 range 444Tanaka et al. (2006) chose the 0.76-0.88 range to study the large scale structure close to this cluster. Given our interest in the cluster alone, we will use a range of 0.80-0.87 in this paper.. Studying cluster membership with photometric redshifts is dangerous given typical photometric redshift errors : assuming a cluster velocity dispersion Vdisp to be 1320 km s-1 (Girardi et al., 2005), dz=Vdisp/c=0.005, which is a bit smaller than zMIPS. As a consequence most of this study is based on the spectroscopic subsample while we only use the second list to estimate upper limits in Sections 4 and 5.
Most of the first subsample (19/22) have a 24m flux density 83 Jy, which is the 80% completeness limit estimated by Papovich et al. (2004) for the MIPS Deep survey. This bias is mainly due to the difficulties in associating sources with 60Jy 83Jy with a unique counterpart. More than half the members of the second subsample (7/10) are brighter than 83 Jy.
Some MIPS sources may have an optical counterpart fainter than rAB26.5 (r 26.3) which is the magnitude limit of the catalog used for deriving the photometric redshift. As a consequence we may have missed them in our two catalogs. However Le Floc’h et al (2005) showed that most of the MIR sources with fl24 83 Jy and z 0.8 are expected to be associated with sources with R24 while fainter sources are usually at higher redshift. Even if we study sources down to 60 Jy, we do not expect to miss a significant number of MIPS sources since only 18 of 202 are not associated with optical counterparts. In fact, some of these sources are outside the ACS or Subaru fields, which can easily explain the lack of optical counterparts.
We also cross-correlated the X-ray catalog with the two MIR cluster member catalogs with a radius of 3” to take into account of astrometric uncertainties.
4. Results
4.1. IR Galaxies dominated by an active nucleus
The two most luminous galaxies at 24 m are also detected in the X-ray, and their optical spectra show broad MgII(2798) (Demarco et al., 2005), unambiguous signatures of AGN activity. One is associated with a very disturbed isolated galaxy while the other belongs to a compact group of at least 5 disturbed and strongly interacting galaxies within a 5” 3” region.
None of the other MIR detected galaxies are identified as a single X-ray source, although we cannot exclude the presence of obscured, dusty AGN. In the field, galaxies detected in the MIR range are predominantly associated with dusty star forming galaxies rather than AGN (Fadda et al., 2002). At lower redshift, La Franca et al (2004) showed that at least 25 % of the MIR sources detected in the ELAIS-S1 field are associated with an AGN according to their optical spectra and stressed this percentage is a lower limit since some objects whose spectra do not show signs of AGN activity are detected in the X-ray. However, as emphasized in Oliver & Pozzi (2005) the presence of an AGN does not imply that it dominates the total infrared luminosity and using SED modelling, Rowan-Robinson (2004) showed that the total infrared luminosity is dominated by AGN activity for only 11 % of the total ELAIS sample and 29 % in SWIRE (Rowan-Robinson, 2005).
As a consequence, even if such studies have not been conducted for galaxy clusters, we will assume that the other galaxies of our sample are dominated by dusty starbursts.
4.2. Star formation rate and infrared luminosity
The mid-infrared emission of a LIRG is dominated by a combination of a continuum associated with very small grains (Desert et al., 1990, VSG) stochastically heated and fluctuating around temperatures of a few hundred degrees, and broad emission features at 3.3, 6.2, 7.7, 8.6, 11.3 and 12.7 m associated with aromatic molecules loosely called Polycyclic Aromatic Hydrocarbon (Puget & Leger, 1989, PAH). Silicate grains are responsible for absorption features at 9.7 and 18 m.
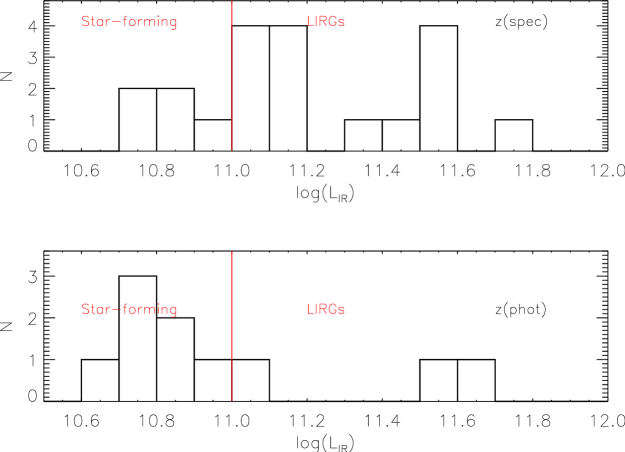
Thus, at z 0.8, the 24 m emission is associated with a combination of the 12 m PAH feature and the VSG continuum in the galaxy rest frame. The luminosities at 12 and 15m correlate with the LIR in the local universe (Chary & Elbaz, 2001) and at least up to z1.2 (Marcillac et al., 2006b). We therefore estimate the infrared luminosity of each galaxy using the spectral energy distribution (SED) from the Dale & Helou (2002) library as explained in Marcillac et al. (2006b). Each of the template SEDs is redshifted to the distance of the observed source. Then, the SED whose MIR flux density is the closest to the observed one is used to derive LIR after it is normalized to the exact observed flux density. Marcillac et al. (2006b) compared LIR estimated using 24m data to LIR estimated using radio data for LIRGs and found a scatter of 40% between the two estimates. Fig 1 shows a histogram of LIR for our sample of galaxies : 15 objects have a total infrared luminosity above and are LIRGs, while 5 lie just below this range (the AGN have been excluded from Fig 1). The histogram of sources selected with photometric redshifts is mainly composed of lower luminosity star-forming galaxies (L1011L☉).
The star formation rates in units of solar masses per year, SFR(IR) were derived using the relation of Kennicutt (1998) :
| (1) |
The resulting SFRs(IR) range between 9 and 86 M⊙/yr with a median SFR = 22 M⊙/yr, significantly higher than found with optical lines such as [OII] (SFR[OII] hereafter). For example, we find that the median SFR(IR) of the emission-line galaxies studied in Jørgensen et al. (2005) is 22 M⊙/yr, which is about 10 times higher than their optical SFR([OII]). These high values of SFR(IR) suggest a large amount of dust-embedded star formation.
There are a number of additional reasons for this difference beyond the strong dust attenuation at the blue wavelength of the [OII] line. Besides extinction, [OII] is also very sensitive to metallicity and the ionization state of the gas (Kennicutt 1998); in addition, this line can be polluted by AGN activity. H is known to be a better star formation indicator, particularly when corrected for attenuation and underlying stellar absorption (Liang et al., 2004, Flores et al., 2004 for distant LIRGs, Hopkins et al., 2003 for local ones), but it is redshifted into the near infrared window, polluted by strong sky lines and often impossible to detect. Thus, [OII] often is the only feasible line to measure at the redshift of the cluster.
4.3. Spatial distribution of the MIR-detected galaxies
We next discuss the spatial distribution of the MIR cluster members in comparison to the X-ray emission, its substructures and the distribution of the other cluster members. Figure 2 shows the ACS image of the 3’3’ cluster center. The blue contours show the Chandra X-ray emission and trace the ICM and point sources while the red ones show the MIPS sources.
4.3.1 Star formation activity in the inner X-ray clumps.
Among 9 MIPS sources located in the X-ray contours, only one is possibly associated with a cluster member with 0.8. The other photometric redshifts do not fall in the 0.76-0.88 range. This is in agreement with Blakeslee et al. (2006) who found that there are no blue cluster members (brighter than i775=23) in the area of high galaxy number density. Similarly Demarco et al. (2005), Jørgensen et al (2005) and Homeier et al. (2006) found that emission line galaxies are absent from this area. This lack of star formation activity may be attributed to interaction with the ICM, tidal stripping or galaxy harassment that have previously removed the gas from the galaxies. As a consequence, these objects must have formed their stars at earlier epochs.
4.3.2 Star formation activity between the two merging clumps.
Figure 2 shows the region between the two X-ray clumps, thought to be in the process of merging. As detailed in Section 2, interactions with the hot ICM between the two structures could either trigger or quench star formation. Annis (1994) found that a sample of clusters with z0.33 exhibits a blue fraction, , ranging from 0 to 50%. He suggested this tendency toward a high (but also highly variable) blue fraction is consistent with episodic star formation in clusters. One of his hypotheses is that many galaxies in the cluster undergo a starburst simultaneously due to the merging of a subcluster clump into a main cluster.
Eleven sources with f(24) 60 Jy are detected in the region between the X-ray clumps. However, one of these objects has a spectroscopic redshift incompatible with being a cluster member, while the remaining ten have zphot out of the range 0.77-0.88. Therefore, dusty star formation is not detected between the X-ray emission peaks. The merging region is not the site of intense star formation, at least at the level detectable at 24m.
4.3.3 Star formation activity in the cluster outskirts
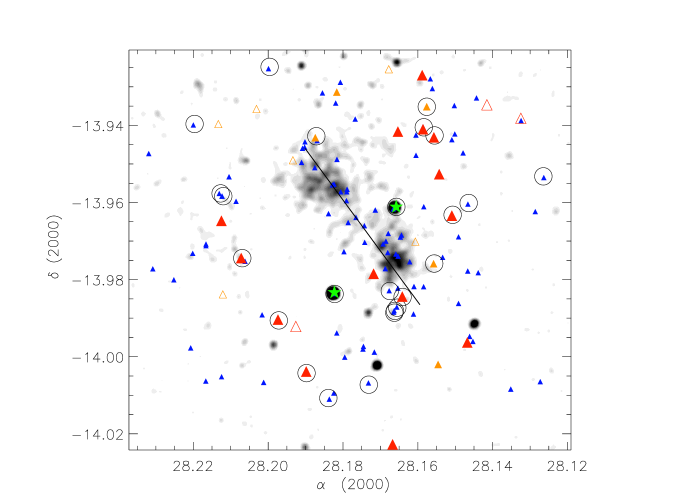
The spatial distribution of the outer cluster members is given in Figure 3, where the galaxy cluster members are indicated by blue triangles, LIRGs by red ones and lower-luminosity star-forming objects by yellow ones. The spectroscopically confirmed members are indicated by filled symbols and the photometric ones by empty ones. The black circles identify late-type galaxies (see section 4.4.2 for more details). The two AGNs are indicated as stars. Since the cluster looks more like a filament than a virialized symmetric structure, we studied the distribution of galaxies and MIR detected ones relative to the filament defined in Figure 3 instead of the radial distance as it is currently studied.
Figure 4 shows the distribution of the distance to the filament for the non-MIR-detected members (plain line), the MIR-detected sample (dashed lines) and the MIR-detected sample with membership from either a or . There is a lack of MIR-detected galaxies in the cluster center; MIR-detected galaxies tend to lie in the outskirts of the filament and seem to be less concentrated than the non-24m-detected cluster members.
A Kolmogorov-Smirnov test on these two subsamples of galaxies reveals that the probability that these two distributions come from the same parent is about 16 % for the sample. and about 14 % for the and sample. MIR sources appear sometimes to have a slightly different spatial distribution with respect to the other galaxy cluster members : Coia et al. (2005) found that 15 m detections, mainly associated with LIRGs, are less concentrated than the non-MIR-detected members in Cl0024+1654, while Biviano et al. (2004) found no significance difference between MIR and galaxy cluster members in A2218 (z=0.175).

4.4. MIR-detected galaxy properties
We now examine the optical properties of the MIR galaxies in comparison with those of the other member galaxies.
4.4.1 Spectral Properties
| Class | Type & Definition | MIR member sample | all galaxy cluster | |||
| EW[OII]3727 | EW H | comments | fl 60. Jy | fl 83. Jy | ||
| e(n)a | … | … | AGN | 2 | 2 | 3 |
| e(a)a | Yes | 4 | 2 | 2 | 2 | |
| e(b)a | 40 | … | 2 | 1 | 14 | |
| e(c)a | Yes,40 | 4 | 6 | 6 | 13 | |
| ea | Yes | ? | low S/N | 1 | 1 | 1 |
| k+[OII]+ab | 1 | 1 | 2 | |||
| ka | Absent | 3 | 3 | 1 | 58 | |
| k+aa | Absent | 3-8 | 1 | 1 | 8 | |
| a+k a | Absent | 8 | 0 | 0 | 1 | |
Comments : (a) Classification from Dressler et al. (1999). (b) Classification from Demarco et al. (2005) : these galaxies exhibit a k+a spectrum with [OII] superposed. Following Dressler et al. (1999), they should be classified as e(c) galaxies. However they are redder than the other e(c) galaxies and as red as k type ones.
Cluster galaxies can be divided into several categories that link their spectral properties to their recent star formation history. Dressler et al. (1999) summarize these differences based on the [OII]3727 emission line and H absorption one (see also Table 1):
-
•
passive galaxies (k type) : their spectra do not exhibit emission lines and EW(H) 3 .
-
•
post-starburst (k+a/a+k type) : no emission lines are detected in their spectra. “a+k” galaxy spectra exhibit stronger Balmer absorption lines (EW(H) 8 ) than k+a ones ( 3 EW(H) 8 ).
-
•
Emission-line galaxies (e(a)/e(b)/e(c)/e(n)) : e(a) galaxies exhibit emission lines and strong Balmer absorption lines (EW(H 4 ); e(b) galaxies are associated with spectra with EW([OII]) 40 while e(c) galaxies are associated with objects with moderate emission lines (EW([OII]40) and moderate absorption lines (EW(H)4 ). e(n) are sometimes associated with AGN.
Demarco et al. (2005) classified the members of RXJ0152.7-1357, following Dressler et al. (1999); they associated 18/22 of the spectroscopic subsample of MIR sources with a spectral type. Table 1 presents their spectral types for MIR and non-IR galaxies and confirms that MIR emission is mainly associated with emission-line galaxies. While 100% (e.g. 2/2) and 50% (e.g. 6/13) of e(a) and e(c) galaxies are detected respectively in the MIR, less than 15% (e.g. 2/14) of the e(b) ones are seen there. Only two e(b) galaxies of this subsample are detected: one with a flux at 24 m of 85 Jy and the other one even fainter. These differences can be explained by the effects of extinction in the MIR-bright galaxies. Since galaxies are classified as type e(b) if they have a strong [OII]3727 emission line (equivalent width greater than 40 ), this type must be less affected by extinction and thus less frequently detected in the MIR.
Another perspective is that 77% 555The object defined by a ’k+[OII]+a’ type as been associated with e(c) objects since it should be classified as e(c) using the Dressler et al. (1999) classification. of the sample is made up of galaxies whose burst of star formation/AGN activity is only partly hidden. Only four MIR objects exhibit spectra of passive galaxies (k) or post-starbust (k+a) galaxies without emission lines, which means that the burst of star formation is completely hidden (see Smail et al. 1999). The object with a “k” spectral classification can be explained by an old passive stellar population where a burst of star formation has just started, since the absorption lines are not affected by a very young burst of star formation (Marcillac et al. 2006a). It is not clear how to interpret the star forming history of the k+a galaxy; it could be a galaxy that has experienced a burst of star formation in the previous 2 Gyr and that is now experiencing a new one, or where the previous one is continuing. However, it could also be explained by very dusty AGN activity.
4.4.2 Morphology
Galaxy morphology is an important clue to galaxy evolution, and is complementary to spectral classification. Postman et al. (2005) visually classified all the galaxies in the ACS RX J0152.7-1357 field with i775 23.5 into three broad morphological categories: E (elliptical; -5 T-3), SO (lenticular; -2 T0), and Sp+Irr (spiral+irregular;1T10). We separate the last category into Spiral (Sa-Sd, 1T7) and Irregular (Sdm, Sm, Im, 8 T10) categories. We were able to associate a morphology with 16/22 of the spectroscopic subsample of MIR galaxies. Table 2 presents the morphological type for the MIR and non-MIR galaxies, and emphasizes the large proportion of spiral galaxies among MIR sources. The MIR sources are associated with mid-to-later type star-forming disk galaxies and not the evolved early-type cluster galaxies, showing that their morphology has not yet been strongly affected by the cluster environment.
| Type | fl 60. Jy | fl 83. Jy | galaxy clustera |
|---|---|---|---|
| E | 0 | 0 | 41 |
| S0 | 3 | 2 | 35 |
| Sp (Sa-Sd) | 9 | 8 | 22 |
| Irr (Sdm-Irr) | 2 | 2 | 7 |
| AGN | 2 | 2 | 2 |
Comments : (a) Data from Blakeslee et al. (2006)
4.4.3 Color-color diagram
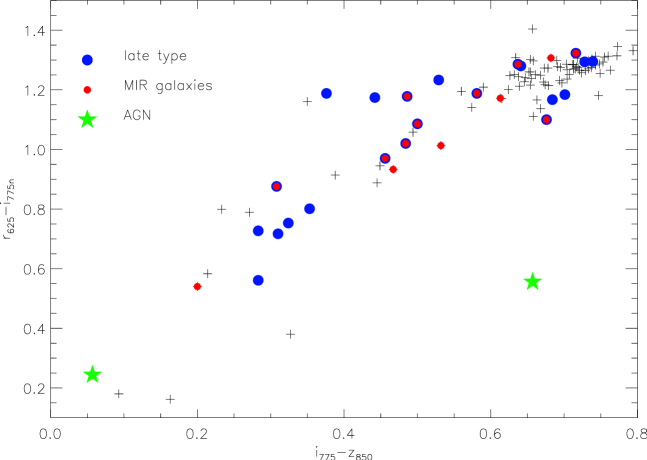
We now examine the optical colors (i775- z850 and r625- i775) of the MIR-detected galaxies compared with those of the other cluster members. We cross-correlated our sample of cluster members and non members with the optical measurements published by Blakeslee et al. (2006) to derive the color of both IR and non-IR galaxies: colors were available for 16 IR galaxies. The MIR galaxies studied here are actively star forming systems and one can expect that their optical colors may be affected by dusty star formation: they could be redder if the extinction is stronger. They also might be bluer if stars with longer evolutionary timescales than O or B stars had time to escape their parental giant molecular clouds. After escape, they are expected to be less extincted according to differential dust attenuation models such as Charlot & Fall (2000). Figure 5 compares the cluster members (dark crosses), late-type galaxies (blue circles), MIPS sources (red circles) in a color-color diagram. The colors of the IR galaxies do not differ significantly from those of the other late-type galaxies in this cluster.
4.4.4 Redshift distribution

Figure 6 shows a histogram of the velocity dispersion of all the non MIR galaxy members in addition to that of the MIR detected galaxies with a spectroscopic redshift. The velocity dispersion of the whole cluster has been estimated to be 1320 km/s (Demarco et al., 2005, Girardi et al., 2005). The median redshift of the IR galaxies is estimated to be 0.840666value with 1 error bar., while the whole sample has a median redshift of 0.837.
A Kolmogorov-Smirnov test on the MIR sample and the total set of galaxy members shows that the probability that these two distributions come from the same parent is about 6.0 %.
This difference in the two distributions is virtually identical to the difference found by Blakeslee et al. (2006) between the early-type (median redshift 0.833) and late-type cluster members (median redshift 0.840 ), suggesting that the former are falling onto the latter. Thus, the MIR emitting galaxies probably belong to the infalling group of late-type galaxies.
5. Discussion
5.1. Comparison between MIR cluster members and MIR field galaxies.
We have shown that the 24m-detected cluster members are located in the outskirts of the cluster, avoiding both the ICM region and where the subclump merging occurs. A large fraction of these sources have with spectra with emission lines. About 60% of the MIR-detected galaxies for which we have morphologies are associated with late-type objects and 8/11 7777 are classified late type galaxies while 1 is classified as Sdm.of the LIRGs with a morphological classification in this sample are late-type objects. These ratios are higher than the fraction of LIRGs associated with spiral objects found by Melbourne et al. (2005) at 0.61z1.00 (although our results are subject to small-number statistical uncertainties). However, our ratios agree well with the results of Bell et al. (2005), who studied the properties of 24m-detected galaxies with 0.65 z 0.75.
Homeier et al.(2006) found that late-type cluster galaxies have similar properties, such as physical sizes and disk lengths, as the late-type field galaxies, though they exhibit redder optical colors. Because of the redder colors, Homeier et al. (2006) claimed that these galaxies cannot be a pristine infalling population. However the MIR-detected galaxies have the same colors as the other late-type cluster galaxies. As a consequence, the burst of star formation does not affect the optical colors and some other mechanism must play a role to explain the late type redder colors.
5.2. Comparison of the dusty star formation in local clusters and field galaxies : is the RXJ0152 environment triggering bursts of star formation ?
Are infrared luminous galaxies in excess in this cluster with respect to field galaxies or other galaxy clusters ? In the CDFS, Le Floc’h et al. (2005) found 2966 objects at 24 m with a flux density greater than 83 Jy for 775 arcmin2, e.g. 3.8 sources per arcmin2. We found 6.1 sources per arcmin2 above this limit in the cluster field. This difference can be explained by cosmic variance and by the fact that the CDFS is known to be 40% and 90% underdense at respectively z 0.750.1 and 0.850.1 (Wolf et al., 2003).
In the CDFS, 203 objects are detected with 0.81z0.87 and flux density at 24m 83Jy. Taking into account the 80% completeness detection limit at 83 Jy for Spitzer deep surveys (Papovich et al. 2004), assuming a redshift completeness limit of 100% for sources with z 0.8 (see Figure 3 of Le Floc’h et al., 2005), and a maximum underdensity of 90 %, an upper limit of 0.6 sources per arcmin2 is expected.
The cluster studied here contains 19 sources detected at 24m with a spectroscopic redshift in the same redshift and luminosity range, which represents 0.8 sources/arcmin2. However, this density is a lower limit since we did not use the galaxies with photometric redshifts: 7 such galaxies are detected above 83 Jy, which sets an upper limit of 1 source/arcmin2. It should be noted that no completeness correction has been applied to the 24m detections in the cluster where it has been applied in the field, since it is difficult to estimate how many outlying MIR galaxies are members of the cluster. Such sources would not change significantly the results, but would only increase the excess of 24 m sources. Thus, an excess of 24m sources is detected in the cluster with respect to field galaxies located at the same redshift. RXJ0152.7-1357 is the first cluster that has been shown to have an excess of LIRGs and star-forming MIR galaxies (with fl24 83 Jy) compared with the field.
A small excess of MIR star forming galaxies has been detected for the rich cluster at z=0.181 by Fadda et al. (2000), but these IR galaxies are lower-luminosity star-forming objects. Using ISOCAM, Coia et al. (2005) found 6 LIRGs and 10 objects with with LIR/L1010 in Cl 0024+1654 (z0.39) from a survey of 38 arcmin2, plus two other galaxies without spectroscopic redshifts that may be LIRG cluster members. As a consequence, the LIRG density888taking into account all the sources with LIR/L1010. in this cluster is 0.30 sources arcmin-2.We used the 80 % completeness limit which is estimated in Metcalfe et al. (2003) for A370 since A370 and Cl 0024+1654 have an equivalent exposure at 15 m and are located at a comparable redshift, and applied a 20 % completeness correction to the previous value. Elbaz et al. (1999) present number counts for ISOCAM surveys at 15m. Using their integral counts above 320 Jy (which is the LIRG limit at z = 0.39 according to the Dale & Helou SEDs), one can expect a density of sources at least as luminous as LIRGs ranging from 0.39 to 0.66 sources arcmin-2. The range arises from cosmic variance between the ultra deep ROSAT and FIRBACK fields. Then no excess of MIR sources is detected in Cl 0024+1654. This is in agreement with Geach et al. (2006) who studied the outskirt of Cl 0024+1654 with MIPS and did not find a clear excess of MIPS sources when comparing number counts in the cluster field to the MIPS deep field number counts except in its center part where a slight excess is suggested. After having removed the bulk of the background field contamination, they find an excess of MIR sources in Cl 0024 but they did not find an excess in MS 0451 (z0.55). As a consequence, the deficit/excess of star formation with respect to field galaxies shows that we cannot simply expect more MIR in the cluster because the galaxy density and gravitational potential is much higher. The presence of LIRGs and star formation may be more connected to the dynamical state of the cluster and mechanisms such as merging of small substructures and infall of galaxies or poor groups that increase the star formation activity.
5.3. Dusty star formation activity and growth of structures.
As we saw in section 4, the merging of the two X-ray substructures does not lead to an excess of star formation at the interface. This can be explained if most of the star formation occurred at an earlier stage of the merging process. This explanation would require that the merging timescale for the two substructures be longer than the triggering timescale for star formation and its duration. As a consequence, these galaxies may have consumed a large amount of their available gas, and the ram pressure they are currently experiencing is stripping away the rest. However six galaxies studied by Demarco et al. (2005) that lie between the X-ray clumps exhibit a “k” spectral type. As a consequence, they probably did not experience a burst of star formation in the last two Gyr since it would have affected the Balmer absorption lines (Marcillac et al., 2006b).
The LIRGs and star forming galaxies tend to be located in the outskirts of the cluster. The arguments by Blakeslee et al. (2006) that the late-type galaxies are infalling on the cluster are detailed in section 4.5.1, where we also showed that the MIR-detected galaxies are associated with the infalling group. We do not know the MIR-detected galaxy motion perpendicular to the line of sight, but if the galaxies had already passed through the dense ICM and cluster core, they would have lost all their gas content, preventing them from experiencing IR bright phases. This suggests the only possible motion perpendicular to the line of sight is to fall on the cluster for the first time.
The infall of a gas rich isolated galaxy or small group of galaxies that contains some gas rich galaxies is thus more likely to be responsible for the LIRG phase rather than the infalling or merging of bigger substructures. These larger structures tend to be X-ray detected and are where galaxy evolution was influenced long ago by the cluster environment. Star formation has already been quenched and is no longer affected by the process of merging of big substructures. The intense episode of star formation in infalling galaxies helps consume their gas. In the field the duration of such an episode was estimated to be 0.1 Gyr and such a phase could consume about 5 109 M⊙ of gas (Franceschini et al., 2003, Marcillac et al., 2006b). However, the burst duration could be shorter in the cluster environnment since it is more hostile than the field.
5.4. Probable origins of the burst of star formation.
What causes the bursts of star formation in these galaxies? It is not known what triggers IR-bright phases such as LIRGs in field galaxies. In the local universe, mergers or interactions between galaxies are usually suggested, but single galaxies can also experience a LIRG phase (Ishida & Sanders, 2001). In clusters, other mechanisms such as interactions with the ICM, the cluster potential violent encounters between galaxies, or harassment have also been suggested for triggering LIRGs (see introduction for references).
In this cluster, the LIRG mechanism cannot be associated with violent encounters between galaxies, since it would lead to an excess of peculiar or irregular galaxies rather than the spirals that dominate the population.
Ram pressure is a unique aspect of the cluster environment. Following Gunn & Gott (1972), the ram pressure experienced by a galaxy is = V2 where is the ICM density and V the galaxy relative velocity. It can be expressed as follows :
| (2) |
Assuming a relative velocity of 1000 km.s-1 and an ICM density of about ( ), which is what is experienced by galaxies in the cluster outskirts,
| (3) |
The gravitational pressure defined by =2G can be expressed as follows, where x is the total galaxy to gas mass ratio.
| (4) |
or
| (5) |
We will assume the cluster members have the same mass and gas properties as field LIRGs in the same redshift and range, since we saw that the LIRGs are associated with late-type galaxies and the latter have similar size properties as the field galaxies (see section 5.1). The incompleteness of the photometric data for our sample of galaxies prevents determining their stellar masses. Franceschini et al. (2003) computed stellar masses from UV-optical-NIR spectra of IR luminous galaxies detected at 15 m. From their Table 6, a total of 6 LIRGs have a spectroscopic redshift between =0.6 and 1.0, and 2 more have a photometric redshift in this range. After converting Franceschini’s values to Ho= 75 km s-1 Mpc-1, we find a median stellar mass of 61010 M⊙ for the galaxies with spectroscopic redshifts. Including the less robust photometric redshifts does not change this value.
The HI and gas masses of local LIRGs have been estimated in Sanders & Mirabel (1996) and Mirabel & Sanders (1985,1988). Sanders & Mirabel (1985) found a tight correlation between LFIR(40-400 m) and M for local bright radio spirals with ranging between - . Assuming the Soifer et al. (1991) relation LIR=1.91LFIR, the median M mass for galaxies in the same LIR range is 4 M⊙. Mirabel & Sanders (1988) studied the HI gas mass of the most luminous far infrared galaxies in the local universe. They found no correlation between and MHI. Using their sample, the median MHI for galaxies in the same LIR range is 6 M⊙ even if a large dispersion is observed. A value of 0.16 can therefore be estimated for x, and
| (6) |
Since this value exceeds our rough estimate of Prp, the ram pressure may not be adequate to strip the gas away from the galaxy plane. However, its effects could be strong enough to induce star forming activity by disturbing the gas; it could also make the gas lose its angular momentum and induce AGN activity by making it move to the central massive black holes or produce a nuclear starburst.
As the infall progresses, the ICM density will become stronger while x will decrease due both to ram pressure and star formation activity. As a result, the gas will be stripped away and the star formation activity finally quenched.
However, our previous estimates are very crude and harassment can also account for the burst of star formation especially if the galaxy belongs to a small group of objects being accreted by the cluster. The major point is that it is quite plausible that galaxies experience a strong burst of star formation when falling into a cluster before different mechanisms transform them into early-type galaxies. Then, the star formation and the ram pressure stripping in addition to harassment will eventually remove the gas from the galaxies.
6. Summary and Conclusion
We used MIPS at 24m to study the dusty star formation in the cluster RX J0152.7-1357, located at z0.83. This cluster is an interesting target since its complicated X-ray image suggests two substructures are merging while it is also suspected to be undergoing an infall of late-type galaxies.
Our main results are summarized as follows :
There are 22 MIR-detected spectroscopically confirmed cluster members, among which are two AGNs, 15 LIRGs and 5 lower-luminosity star-forming galaxies. In addition 10 other MIR sources have a photometric redshift compatible with membership. The median SFR(IR) is estimated to be 22 M⊙/yr, much larger than the optically estimated star formation rate and showing that a large amount of the star formation is hidden by dust.
However, the majority of the MIR-detected galaxies are associated with emission-line late type galaxies, so dust only partially hides the star formation. Only four objects exhibit a high rate of star formation without optical emission lines. There is no significant difference between late-type galaxies with and without 24m emission in the optical color/color diagram.
An excess of MIR-emitting galaxies is seen in this cluster with respect to field galaxies at the same redshift. This is the first time such an excess of LIRGs/star forming objects in a cluster has been shown unambiguously. This behavior can be associated directly with the state of the cluster rather than just with the high galaxy density of the cluster.
The MIR galaxies seem to be mostly associated with the infall of late-type galaxies rather than the merging of bigger X-ray substructures, showing that a burst of star formation can occur during galaxy infall. These sources could either be isolated or belong to small groups being accreted by the cluster. Thus, some cluster environments may be responsible for a burst of star formation. This behavior seems also to be related to the infalling system properties such as its size and dynamical state. The ram pressure may not be adequate to strip away the gas but interaction between the galaxy and the ICM may induce perturbations leading to a burst of star formation. This perturbation could also be associated with harassment when galaxies encounter the greater galaxy concentration in the cluster. In any case, this burst of star formation can help quench future star formation by consuming the available gas and enhancing the gas loss by ram pressure stripping.
References
- Abadi et al. (1999) Abadi, M. G., Moore, B., & Bower, R. G. 1999, MNRAS, 308, 947
- Annis (1994) Annis, J. T. 1994, Ph.D. Thesis, University of Hawai
- Balogh et al. (1999) Balogh, M. L., Morris, S. L., Yee, H. K. C., Carlberg, R. G., & Ellingson, E. 1999, ApJ, 527, 54
- Bell et al. (2005) Bell, E. F. et al. 2005, ApJ, 625, 23
- Bicay & Giovanelli (1987) Bicay, M. D., & Giovanelli, R. 1987, ApJ, 321, 645
- Biviano et al. (2004) Biviano, A. et al. 2004, A&A, 425, 33
- Blakeslee et al. (2006) Blakeslee, J., Holden, B., Franx, M., Rosati, P., Bouwens, R., & Demarco, R. 2006, astro/ph0603058 accepted for publication in ApJ
- Brandt et al. (2001) Brandt, W. N. et al. 2001, AJ, 122, 2810
- Butcher & Oemler (1978) Butcher, H., & Oemler, A. 1978, ApJ, 219, 18
- Butcher & Oemler (1984) —. 1984, ApJ, 285, 426
- Chary & Elbaz (2001) Chary, R., & Elbaz, D. 2001, ApJ, 556, 562
- Coia et al. (2005) Coia, D. et al. 2005, A&A, 431, 433
- Couch et al. (2001) Couch, W. J., Balogh, M. L., Bower, R. G., Smail, I., Glazebrook, K., & Taylor, M. 2001, ApJ, 549, 820
- Couch et al. (1994) Couch, W. J., Ellis, R. S., Sharples, R. M., & Smail, I. 1994, ApJ, 430, 121
- Dale & Helou (2002) Dale, D. A., & Helou, G. 2002, ApJ, 576, 159
- Della Ceca et al. (2000) Della Ceca, R., Scaramella, R., Gioia, I. M., Rosati, P., Fiore, F., & Squires, G. 2000, A&A, 353, 498
- Demarco et al. (2005) Demarco, R. et al. 2005, A&A, 432, 381
- Desert et al. (1990) Desert, F.-X., Boulanger, F., & Puget, J. L. 1990, A&A, 237, 215
- Devriendt & Guiderdoni (2000) Devriendt, J. E. G., & Guiderdoni, B. 2000, A&A, 363, 851
- Dressler & Gunn (1983) Dressler, A., & Gunn, J. E. 1983, ApJ, 270, 7
- Dressler & Gunn (1992) —. 1992, ApJS, 78, 1
- Dressler et al. (1985) Dressler, A., Gunn, J. E., & Schneider, D. P. 1985, ApJ, 294, 70
- Dressler et al. (1997) Dressler, A. et al. 1997, ApJ, 490, 577
- Dressler et al. (1999) Dressler, A., Smail, I., Poggianti, B. M., Butcher, H., Couch, W. J., Ellis, R. S., & Oemler, A. J. 1999, ApJS, 122, 51
- Duc et al. (2004) Duc, P.-A. et al. 2004, in IAU Colloq. 195: Outskirts of Galaxy Clusters: Intense Life in the Suburbs, ed. A. Diaferio, 347–351
- Ebeling et al. (2000) Ebeling, H. et al. 2000, ApJ, 534, 133
- Elbaz et al. (1999) Elbaz, D. et al. 1999, A&A, 351, L37
- Fadda et al. (2000) Fadda, D., Elbaz, D., Duc, P.-A., Flores, H., Franceschini, A., Cesarsky, C. J., & Moorwood, A. F. M. 2000, A&A, 361, 827
- Fadda et al. (2002) Fadda, D., Flores, H., Hasinger, G., Franceschini, A., Altieri, B., Cesarsky, C. J., Elbaz, D., & Ferrando, P. 2002, A&A, 383, 838
- Flores et al. (2004) Flores, H., Hammer, F., Elbaz, D., Cesarsky, C. J., Liang, Y. C., Fadda, D., & Gruel, N. 2004, A&A, 415, 885
- Franceschini et al. (2003) Franceschini, A. et al. 2003, MNRAS, 343, 1181
- Fujita (1998) Fujita, Y. 1998, ApJ, 509, 587
- Geach et al. (2006) Geach, J. E. et al. 2006, ArXiv Astrophysics e-prints
- Girardi et al. (2005) Girardi, M., Demarco, R., Rosati, P., & Borgani, S. 2005, A&A, 442, 29
- Gordon et al. (2005) Gordon, K. D. et al. 2005, PASP, 117, 503
- Gunn & Gott (1972) Gunn, J. E., & Gott, J. R. I. 1972, ApJ, 176, 1
- Hatton et al. (2003) Hatton, S., Devriendt, J. E. G., Ninin, S., Bouchet, F. R., Guiderdoni, B., & Vibert, D. 2003, MNRAS, 343, 75
- Homeier et al. (2006) Homeier, N. L. et al. 2006, AJ, 131, 143
- Hopkins et al. (2003) Hopkins, A. M. et al. 2003, ApJ, 599, 971
- Huo et al. (2004) Huo, Z.-Y., Xue, S.-J., Xu, H., Squires, G., & Rosati, P. 2004, AJ, 127, 1263
- Ishida & Sanders (2001) Ishida, C. M., & Sanders, D. B. 2001, Bulletin of the American Astronomical Society, 33, 832
- Jørgensen et al. (2005) Jørgensen, I., Bergmann, M., Davies, R., Barr, J., Takamiya, M., & Crampton, D. 2005, AJ, 129, 1249
- Kennicutt (1998) Kennicutt, R. C. 1998, ARA&A, 36, 189
- Kodama et al. (1999) Kodama, T., Bell, E. F., & Bower, R. G. 1999, MNRAS, 302, 152
- Kodama et al. (2005) Kodama, T. et al. 2005, PASJ, 57, 309
- La Franca et al. (2004) La Franca, F. et al. 2004, AJ, 127, 3075
- Lavery & Henry (1994) Lavery, R. J., & Henry, J. P. 1994, ApJ, 426, 524
- Le Floc’h et al. (2005) Le Floc’h, E. et al. 2005, ApJ, 632, 169
- Liang et al. (2004) Liang, Y. C., Hammer, F., Flores, H., Elbaz, D., Marcillac, D., & Cesarsky, C. J. 2004, A&A, 423, 867
- Marcillac et al. (2006a) Marcillac, D., Elbaz, D., Charlot, S., Liang, Y. C., Hammer, F., Flores, H., Cesarsky, C., & Pasquali, A. 2006a, A&A, in press, astro-ph/0605642
- Marcillac et al. (2006b) Marcillac, D., Elbaz, D., Chary, R. R., Dickinson, M., Galliano, F., & Morrison, G. 2006b, A&A, 451, 57
- Maughan et al. (2003) Maughan, B. J., Jones, L. R., Ebeling, H., Perlman, E., Rosati, P., Frye, C., & Mullis, C. R. 2003, ApJ, 587, 589
- Melbourne et al. (2005) Melbourne, J., Koo, D. C., & Le Floc’h, E. 2005, ApJ, 632, L65
- Metcalfe et al. (2005) Metcalfe, L., Fadda, D., & Biviano, A. 2005, Space Science Reviews, 119, 425
- Metcalfe et al. (2003) Metcalfe, L. et al. 2003, A&A, 407, 791
- Mirabel & Sanders (1988) Mirabel, I. F., & Sanders, D. B. 1988, ApJ, 335, 104
- Mirabel et al. (1998) Mirabel, I. F. et al. 1998, A&A, 333, L1
- Moore et al. (1996) Moore, B., Katz, N., Lake, G., Dressler, A., & Oemler, A. 1996, Nature, 379, 613
- Oliver & Pozzi (2005) Oliver, S., & Pozzi, F. 2005, Space Science Reviews, 119, 411
- Papovich et al. (2004) Papovich, C. et al. 2004, ApJS, 154, 70
- Pérez-González et al. (2005) Pérez-González, P. G. et al. 2005, ApJ, 630, 82
- Poggianti et al. (1999) Poggianti, B. M., Smail, I., Dressler, A., Couch, W. J., Barger, A. J., Butcher, H., Ellis, R. S., & Oemler, A. J. 1999, ApJ, 518, 576
- Poggianti & Wu (2000) Poggianti, B. M., & Wu, H. 2000, ApJ, 529, 157
- Postman et al. (2005) Postman, M. et al. 2005, ApJ, 623, 721
- Puget & Leger (1989) Puget, J. L., & Leger, A. 1989, ARA&A, 27, 161
- Rieke et al. (2004) Rieke, G. H. et al. 2004, ApJS, 154, 25
- Romer et al. (2000) Romer, A. K. et al. 2000, ApJS, 126, 209
- Rosati et al. (1998) Rosati, P., della Ceca, R., Norman, C., & Giacconi, R. 1998, ApJ, 492, L21+
- Rowan-Robinson et al. (2005) Rowan-Robinson, M. et al. 2005, AJ, 129, 1183
- Rowan-Robinson et al. (2004) —. 2004, MNRAS, 351, 1290
- Sanders & Mirabel (1985) Sanders, D. B., & Mirabel, I. F. 1985, ApJ, 298, L31
- Sanders & Mirabel (1996) —. 1996, ARA&A, 34, 749
- Smail et al. (1999) Smail, I., Morrison, G., Gray, M. E., Owen, F. N., Ivison, R. J., Kneib, J.-P., & Ellis, R. S. 1999, ApJ, 525, 609
- Soifer & Neugebauer (1991) Soifer, B. T., & Neugebauer, G. 1991, AJ, 101, 354
- Stetson (1987) Stetson, P. B. 1987, PASP, 99, 191
- Tanaka et al. (2006) Tanaka, M., Kodama, T., Arimoto, N., & Tanaka, I. 2006, MNRAS, 365, 1392
- Teyssier (2002) Teyssier, R. 2002, A&A, 385, 337
- Wolf et al. (2003) Wolf, C., Meisenheimer, K., Rix, H.-W., Borch, A., Dye, S., & Kleinheinrich, M. 2003, A&A, 401, 73