Swift observations of GRB 050904: the most distant cosmic explosion ever observed.
Abstract
Context. Swift discovered the high redshift (z=6.29) GRB 050904 with the Burst Alert Telescope (BAT) and began observing with its narrow field instruments 161 s after the burst onset. This gamma-ray burst is the most distant cosmic explosion ever observed. Because of its high redshift, the X-ray Telescope (XRT) and BAT simultaneous observations provide 4 orders of magnitude of spectral coverage (0.2–150 keV; 1.4–1090 keV in the source rest frame) at a very early source-frame time (22 s). The X-ray emission was monitored by the XRT up to 10 days after the burst.
Aims. We present the analysis of BAT and XRT observations of GRB 050904 and a complete description of its high energy phenomenology.
Methods. We performed time resolved spectral analysis and light curve modeling.
Results. GRB 050904 was a long, multi-peaked, bright GRB with strong variability during its entire evolution. The light curve observed by the XRT is characterized by the presence of a long flaring activity lasting up to 1-2 hours after the burst onset in the burst rest frame, with no evidence of a smooth power-law decay following the prompt emission as seen in other GRBs. However, the BAT tail extrapolated to the XRT band joins the XRT early light curve and the overall behavior resembles that of a very long GRB prompt. The spectral energy distribution softens with time, with the photon index decreasing from 1.2 during the BAT observation to 1.9 at the end of the XRT observation. The dips of the late X-ray flares may be consistent with an underlying X-ray emission arising from the forward shock and with the properties of the optical afterglow reported by Tagliaferri et al. (2005b).
Conclusions. We interpret the BAT and XRT data as a single continuous observation of the prompt emission from a very long GRB. The peculiarities observed in GRB 050904 could be due to its origin within one of the first star-forming regions in the Universe; very low metallicities of the progenitor at these epochs may provide an explanation.
Key Words.:
gamma rays: bursts, gamma-ray bursts: individual (GRB 050904)1 Introduction
Gamma-Ray Bursts are bright flashes of high energy photons that can last from about 10 milliseconds to 10 minutes. Their origin and nature puzzled the scientific community for about 25 years until 1997, when the first X-ray afterglow of long ( 2 s duration) bursts were detected Costa et al. (1997), and the first optical van Paradijs et al. (1997) and radio Frail et al. (1997) counterparts were found. These measurements established that long GRBs are typically at high redshift (z) and are in sub-luminous star-forming host galaxies Bloom et al. (2002). They are likely produced in core-collapse explosions of a class of massive stars that give rise to highly relativistic jets (the collapsar model; MacFadyen et al. (2001)). Internal inhomogeneities in the velocity field of the relativistic expanding flow lead to collisions between fast moving and slow moving fluid shells and to the formation of internal shock waves Rees & Mészáros (1994). These shocks are believed to produce the observed prompt emission in the form of irregularly shaped and spaced pulses of gamma-rays, each pulse corresponding to a distinct internal collision. The expansion of the jet outward into the circumburst medium is believed to give rise to “external” shocks, responsible for producing the smoothly fading afterglow emission seen in the X-ray, optical and radio bands Mészáros & Rees (1997).
The Swift Gehrels et al. (2004) X-ray Telescope (XRT; Burrows et al. 2005b ) is providing a growing number of unprecedented observations of the early stages of GRB afterglow in the 0.2–10 keV X-ray band. The XRT rapid ( 2 min) response to the Swift Burst Alert Telescope (BAT; Barthelmy et al. 2005a ) triggers has already led to the discovery of rapid early X-ray declines followed by the smoother “standard” X-ray afterglow components Tagliaferri et al. 2005a ; Cusumano et al. 2006a ; Barthelmy et al. 20005b ; Vaughan et al. 2006a , dramatic flaring in the early X-ray light curves of short Fox et al. (2005); Barthelmy et al. 2005c ; Campana et al. (2006); Vaughan et al. 2006b and long bursts Burrows et al. 2005a ; Romano et al. (2006); Falcone et al. (2006); Burrows et al. 2005c ; Pagani et al. (2006); Morris et al. (2006) and simultaneous peaks at the end of the BAT observation (15–350 keV) and at the beginning of the XRT observation (0.2–10 keV) of some long bursts (GRB 050730, GRB 050820a, GRB 050822; see O’Brien et al. 2006). Thanks to its fast response, and precise source localization, about 3′ in BAT, 3′′–5′′ in XRT and 0.3′′ in UVOT (Roming et al. 2006), Swift is able to quickly alert ground-based telescopes to locate the optical counterpart and get redshift measurements before the object becomes too faint.
GRB 050904 triggered the BAT on 2005 September 4 at 01:51:44 UT Cummings et al. (2005). The burst was located on-board at RAJ2000=00h54m41s, DecJ2000=+14∘ 08 17′′ with an uncertainty of 3 radius (90% confidence level) and the spacecraft was quickly pointed towards it. The XRT on-board centroiding algorithm failed to detect the counterpart due to the presence of a hot CCD detector column. The burst was long and bright with duration = (22510) s and a 15–150 keV fluence of (5.40.2) 10-6 erg cm-2 Sakamoto et al. (2005). UVOT did not detect the burst counterpart down to a 3 sigma upper limit of about 21 mag in all its six filters Cucchiara et al. (2005). The optical detection was first made by the robotic observatory TAROT that begun to observe GRB050904 only 81 s after the Swift trigger. A bright optical flare was detected during the prompt high-energy emission phase Boër et al. (2006); Gendre et al. (2006).
Early photometry indicated a high redshift (z5, Reichart (2005)). A photometric redshift was measured by Tagliaferri et al. (2005b) and confirmed by a Subaru spectroscopic measurement of 6.29 0.01 Kawai et al. (2005). A break at = 2.61.0 days was also found in the J-band light curve Tagliaferri et al. 2005b .
Such a high redshift means that this explosion happened 12.8 billion years ago111We used standard cosmological parameters of =0.27, =0.73, =71 km s-1 Mpc-1, corresponding to a time when the Universe was young (), close to the re-ionization era Becker et al. (2001). This gave GRB 050904 the distinction of being the most distant cosmic explosion ever observed: the previous record for a GRB was 4.5 Andersen et al. (2000), the most distant quasar known is at a redshift of 6.4 Fan et al. (2003), and the most distant galaxy is at a redshift of Kneib et al. (2004).
Here we present the analysis of the BAT and XRT observations of GRB 050904. The details on data reduction are in Section 2; temporal and spectral analysis results are reported in sections 3 and 4, respectively. In section 5 we draw our conclusions. Our results have already been shortly summarized by Cusumano et al. (2006b), but this paper contains a complete description of the phenomenology of the GRB 050904. Compared to the Watson et al. (2005) paper, that already presented the XRT data analysis, we add: (i) the detailed BAT data analysis, (ii) complete and correct BAT and XRT light curves, (iii) time resolved spectral analysis on a finer temporal grid, (iv) spectral analysis of BAT and XRT simultaneous data. Hereafter, errors are reported for a 90% single parameter confidence level.
2 Observations and Data reduction
The BAT data were analyzed using the standard BAT analysis software included in the HEAsoft 6.0.4 package and described in the Swift BAT Ground Analysis Software Manual222http://swift.gsfc.nasa.gov/docs/swift/analysis/. BAT data from 306 to 525 s after the burst onset were telemetered in the masktag-lc observing mode that accumulates data in only four energy bands. As a consequence, no spectral energy analysis was performed on BAT data for this time interval.
GRB 050904 was observed by the XRT from 161 s up to 10 days after the burst onset, overlapping the BAT observations for about 364 s. The XRT observation started before the end of the high energy prompt emission. Data were accumulated in WT mode up to 573 s after the trigger time, while all the other data were obtained in PC mode. In the WT mode only the central of the field of view is read out, providing one dimensional imaging and full spectral capability with a time resolution of 1.8 ms. The PC mode provides, instead, full spatial and spectral resolution with a time resolution of 2.5 s.
XRT data were calibrated, filtered and screened using the XRTDAS package included in the HEAsoft 6.0.4, as described in the XRT Software User’s Guide2. Only observing time intervals with a CCD temperature below 47 degrees Celsius were used. The total exposures after all the cleaning procedures were 2.8 ks and 127.3 ks for data accumulated in the WT and PC modes, respectively. We used a 0–2 and 0–12 grade selection for data in the WT and PC modes, respectively. Such a selection provides the best combination of spectral resolution and detection efficiency. The GRB was imaged far from the CCD hot columns and no corrections for hot columns inside the photon extraction regions was necessary.
The position of the burst was refined by on-ground analysis Palmer et al. (2005). The BAT burst position is RAJ2000 = 00h54m53s, DecJ2000 = +14∘52", with an uncertainty of . This is from the on-board position and from the near–IR afterglow position Nysewanderet al. (2005). The XRT afterglow position derived with xrtcentroid (v0.2.7) and including the latest boresight correction Moretti et al. (2006) is RAJ2000 = 00h54m50s.8, DecJ2000 = +14∘05090, with an uncertainty of . The XRT derived coordinates are from the BAT ones and from the near–IR counterpart Nysewanderet al. (2005).
The BAT and XRT times are referred to the GRB 050904 onset 2005 Sep 4, 01:51:44.3 UT.
For the measured redshift , the 15–350 keV BAT band corresponds to a 109–2551 keV band in the burst rest frame while the 0.2–10 keV XRT band corresponds to a 1.4–73 keV band. The observed timescales are stretched by a factor with respect to the rest frame ones. In the following the GRB phenomenology is presented and discussed from the point of view of the source rest frame.
3 Timing Analysis
The timing analysis for the XRT data was performed by selecting events from a region centered on the source with a radius of 20 (47.2) and 35 (82.6) pixels (arcsec) for WT and PC data, respectively. The background was estimated from regions sufficiently offset ( 2 arcmin) from the source position to avoid contamination from the PSF wings and free from contamination by other sources.
The intensity of the source caused pile-up in the PC data up to 8 ks from the burst onset. The pile-up correction was performed by excluding a central region of 4 pixels radius and dividing the extracted count rate by the fraction of lost point spread function (PSF; 58%). For the rest of the observation we used the full circular extraction region.
WT data were also corrected for the fraction of PSF not included in the extraction region (7%).
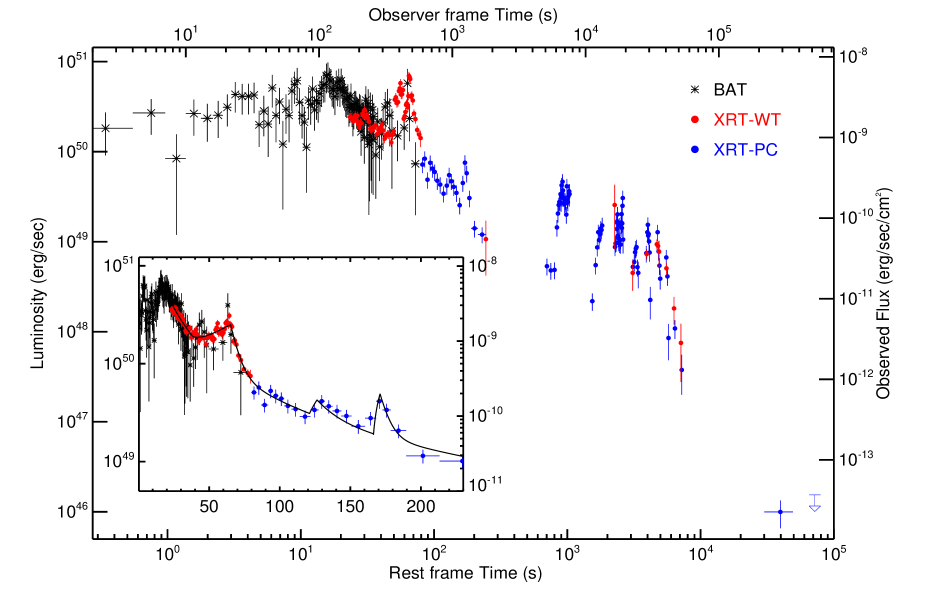
Figure 1 shows the evolution of the GRB flux and luminosity. The BAT light curve displays three main peaks: two short peaks (2 s long) at T+3.8 and at T+9.3 s, and a main long-lasting peak at T+13.7 s, where T is the time of the burst onset. Emission in the BAT energy range continues up to almost T+77.7 s with a weak peak at T+65 s, coincident with the first peak of the XRT light curve. The BAT and XRT light curves overlap between T+23 and T+69 s. The early XRT light curve shows a steep decay with a slope with three flares superimposed at T+65 s, T+126 s and T+171 s. These flares can be modeled by a linear rise lasting 26.6, 5.3 and 4.7 s, plus an exponential decay with decay time of 4.5, 10.98 and 5.2 s, respectively. The best fit model of the first orbit of the XRT light curve is shown in the inset of Fig. 1. Although interrupted by observing constraints imposed by the Swift orbit, the light curve from GRB 050904 reveals highly irregular rate variations likely due to the presence of flares up to T+1.5 hours. At later times the flaring activity is not detected and only a residual emission, 105 times lower than the initial intensity, is visible. Note that the XRT light curve presented in Watson et al. (2005) shows an evident discontinuity at the end of the WT observation segment likely caused by an error in his flux conversions for the following PC mode data, all of which are systematically too low by about a factor of four.
Figure 2 shows the rest frame XRT light curves of GRB 050904 in the 1.4–14 keV and 14–73 keV bands (top and middle panels). The two light curves are binned before conversion to the rest frame in order to have at least 40 counts per bin in both bands. The hardness ratio (bottom panel) is defined as H/S, where H (hard) and S (soft) are the high energy and the low energy bands. The H/S plot reveals a significant shift to softer energies with time during the first 80 s, with the exception of the flaring episode at T+65 s, where the hardness ratio peaks, too. Later emission shows no evidence of further softening until the tail of the last flare around T+5500 s.

4 Spectral Analysis
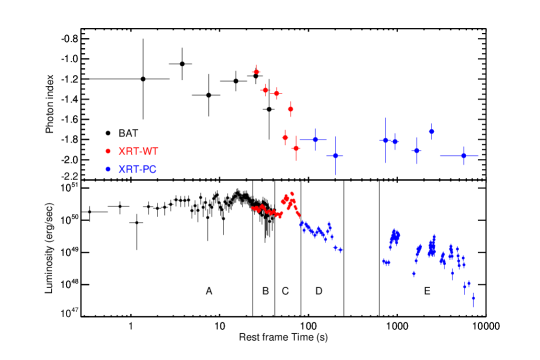
The spectral analysis of GRB 050904 was performed by selecting two sets of time intervals for the BAT and XRT observations, corresponding to characteristic phases of the light curve evolution. The BAT spectra were accumulated in the 14–150 keV observed band in six time intervals up to 41.6 s from the burst onset (Table 1). No BAT spectrum was accumulated from T+41.6 to T+72 s because BAT data were in the masktag-lc observing mode with only four energy bands. The XRT spectra were accumulated in thirteen time intervals from T+23 s to T+8173 s from the burst onset (Table 1). The WT and PC spectra were extracted from the same regions used for the timing analysis. Instrumental energy channels below 0.3 keV and above 10 keV for PC and WT spectra were ignored and the background was evaluated in regions sufficiently offset ( 2 arcmin) from the source position to avoid contamination from the PSF wings and free of contamination from other sources in the field of view. Moreover, energy channels between 0.5 and 0.6 keV were excluded because of the presence of a sistematics in such a range due to a time dependent energy scale problem at low energy333http://heasarc.gsfc.nasa.gov/docs/swift/analysis/; a sistematics in the gain offset produces a negative residual in the 0.5 keV region increasing in the fit procedure the NH estimation. The BAT spectra were modeled with a power law with photon index () while the XRT spectra were modeled with a power law plus two absorption components: one for the intrinsic absorption in the host galaxy and one for the Galactic absorption. The latter was fixed to the line-of-sight value of 4.93 cm-2 Dickey & Lockman (1990). The model gave acceptable values for all the selected intervals (Table 1). More complex models, such as a Band function Band et al. (1993), cannot be constrained by the data. Figure 3 shows the evolution with time of the photon index . The BAT spectra have , consistent with typical values of the parameter of the Band model Preece et al. (2000). This strongly suggests that the BAT observes the low energy part of the Band function and that the peak energy of the GRB spectrum is above keV in the source rest frame. If we exclude the spectrum of the first XRT flare at T+65 s, the XRT photon indices show a clear decreasing trend from about to about in the first T+200 s. No further spectral evolution is present in later XRT data, in agreement with the hardness ratio curve. The BAT and XRT photon indices are in good agreement in the overlapping region. We also detected in the XRT WT spectra (T T+67.1 s), a highly significant absorption in excess of the Galactic value. The intrinsic absorption column decreases with time at high significant level. In the time intervals where the burst was observed in PC mode (T T+67.1 s), due to the decreased statistics, only upper limits were measured. Table 1 shows the best fit parameters for each of the selected time intervals.
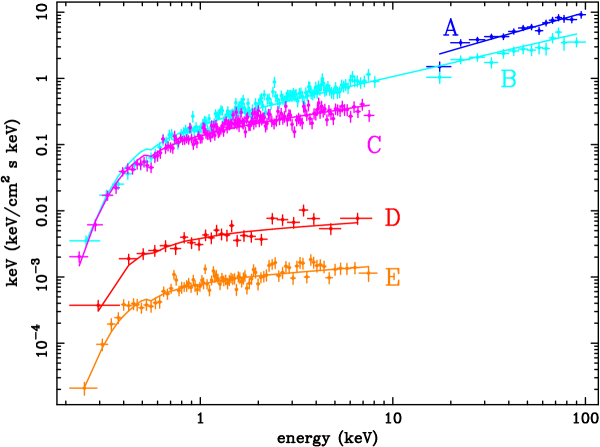
The GRB 050904 spectral evolution is also quite evident in Fig. 4 where the F(E) deconvolved spectra (equivalent to F() spectra) selected in 5 ad hoc intervals (bottom panel in Fig. 3) are shown together with the best fit spectral models. The first spectrum (A) is accumulated in the time interval T1.43 s T+23.2 s, when only BAT observed the burst. The second spectrum (B) is from T+23.2 s to T+41.7 s when the GRB is simultaneously observed by BAT and the XRT. The following spectra (C, D, E) refer to the time intervals T+41.6 s T+82.3 s, T+82.3 s T+224 s and T+628 s T+8163, respectively, when only the XRT detected the burst. The energy distribution is clearly softening with time starting from interval C. The fit in the broad energy band of interval B is also well modeled by an absorbed power law while a Band function Band et al. (1993), cannot be constrained by the data. Table 2 shows the best fit parameters for each of the selected time intervals.
| Interval | Time (s) | ( | (dof) | Flux (erg cm-2 s-1) | |||
| Start | Stop | 0.2–10 keV | 15–350 keV | ||||
| BAT 1 | 1.43 | 2.69 | – | 1.2 0.4 | 1.2 (57) | 1.4 | 22.9 |
| 2 | 2.69 | 4.89 | – | 1.050.16 | 0.86 (57) | 3.2 | 90.8 |
| 3 | 4.89 | 10.1 | – | 1.360.21 | 0.97 (57) | 3.4 | 30.9 |
| 4 | 10.1 | 20.4 | – | 1.170.08 | 0.95 (57) | 3.6 | 66.8 |
| 5 | 20.4 | 30.6 | – | 1.220.10 | 0.93 (57) | 3.0 | 45.7 |
| 6 | 30.6 | 41.6 | – | 1.5 0.3 | 0.88 (57) | 2.0 | 9.9 |
| XRT 1 | 23.2 | 28.7 | 5.734.2 | 1.190.1 | 0.77 (62) | 3.5 | – |
| 2 | 28.7 | 36.9 | 5.52.5 | 1.340.08 | 0.98 (95) | 2.5 | – |
| 3 | 36.9 | 50.6 | 3.42.2 | 1.330.08 | 0.78 (89) | 1.3 | – |
| 4 | 50.6 | 58.8 | 7.7 4.5 | 1.850.1 | 1.12 (56) | 1.4 | – |
| 5 | 58.8 | 67.1 | 4.22.0 | 1.500.09 | 1.14 (73) | 1.7 | – |
| 6 | 67.1 | 79.8 | 1.51.4 | 1.860.13 | 0.94 (37) | 0.54 | – |
| 7 | 79.8 | 159.4 | 6.4 | 1.800.15 | 1.12 (23) | 0.12 | – |
| 8 | 159.4 | 244.4 | 6.4 | 1.970.24 | 0.90 (7) | 0.05 | – |
| 9 | 628 | 848 | 5.2 | 1.800.24 | 0.92 (7) | 0.02 | – |
| 10 | 848 | 1040 | 6.8 | 1.860.14 | 0.90 (35) | 0.08 | – |
| 11 | 1452 | 1863 | 5.8 | 2.010.22 | 0.80 (17) | 0.02 | – |
| 12 | 2275 | 2618 | 6.9 | 1.900.14 | 1.26 (47) | 0.04 | – |
| 13 | 3045 | 8173 | 4.0 | 1.970.12 | 1.24 (35) | 0.008 | – |
We also evaluated the contribution to the total fluence in the 1.473 keV band of the three flares (T+65, T+126 and T+171 s) superimposed on the early XRT light curve. The fluence values over the continuum are , and erg cm-2, respectively. The fluence of the XRT continuum over the first orbit (i.e. from 23.2 to 244.4 s) is erg cm-2. The extrapolated 1.4–73 keV BAT fluence in the time interval from the burst onset to the start of the XRT observation is erg cm-2. The three XRT flares are therefore 5%, 1% and 1% of the total 1.4–73 keV emission observed up to T+244 s. The 1.4–73 keV fluence in the remaining part of the XRT observation is erg cm-2. This value is only a lower limit because of the observing gaps.
| Interval | Time (s) | ( | (dof) | Flux (erg cm-2 s-1) | ||||
|---|---|---|---|---|---|---|---|---|
| Start | Stop | 0.2–10 keV | 15–350 keV | |||||
| BAT | A | 1.43 | 23.2 | – | 1.19 0.07 | 0.96 (57) | 3.1 | 52.8 |
| BAT+XRT | B | 23.2 | 41.6 | 7.51.5 | 1.370.02 | 1.0 (189) | 2.6 | 11.9 |
| XRT | C | 41.6 | 82.3 | 4.71.2 | 1.630.05 | 1.19 (205) | 1.33 | – |
| XRT | D | 82.3 | 224 | 2.1 | 1.70.1 | 1.24 (22) | 0.03 | – |
| XRT | E | 628 | 8163 | 2.9 | 1.740.07 | 1.243 (80) | 0.006 | – |
5 Discussion
GRB 050904 was a long, multi-peaked, bright GRB with strong X-ray flaring activity lasting up to 1–2 hours in the source rest frame (or 56 s in the observer frame). X-ray flares are detected in nearly half of the Swift long bursts (e.g. GRB 050406 Burrows et al. 2005a ; Romano et al. (2006), GRB 050502 Burrows et al. 2005a ; Falcone et al. (2006), GRB 050607 Pagani et al. (2006), GRB 050713A Morris et al. (2006)). The rise time and decay time of these flares seen at lower z are frequently very fast with a ratio between the duration and peak time . These features make difficult to explain these flares with mechanisms associated with the external shock (Zhang et al. 2006)
The variability of GRB 050904 X-ray light curve is even more dramatic than the typical Swift afterglow showing flares, and the amplitude and rise/fall times of the flares are consistent with the behavior of nearby (z 1) long GRBs (Fishman & Meegan 1995). This suggests to interpret them as late internal shocks related to central engine activity. In this scenario they would have the same origin as the prompt gamma-ray emission Zhang et al. (2006); Nousek et al. (2006); O’Brien et al. (2006). This would require that the central engine remain active up to at least 5000 s, consistent with the collapsar model MacFadyen et al. (2001), which allows central engine activity for up to a few hours. Then, BAT and XRT have likely recorded a single continuous observation of long lasting prompt emission where the standard X-ray afterglow component is hardly detectable because its contribution is drowned by the intense and long lasting activity of the central engine.
TAROT observed a flare in the optical band Boër et al. (2006); Gendre et al. (2006) which is simultaneous with the X-ray flare at T+65 s. Later ( T+1200 s) optical and infrared observations Tagliaferri et al. 2005b are too sparse to test if the flaring activity observed at later times in X-rays is indeed present. The multiwavelength fit by Tagliaferri et al. (2005b) suggests that the optical data taken after T+1200 s are in agreement with standard afterglow emission and jet lateral spreading at about T+80 ks. Physical interpretations to explain the simultaneous X-ray and optical flare at T+65 s are extensively discussed in Gendre et al. (2006). They showed that delayed external shock from a thick shell (Piro et al. 2005), synchrotron emission from reverse shock (Fan & Wei 2005), inverse Compton emission from reverse shock (Kobayashi et al. 2005) and inverse Compton from late internal shock (Wei et al. 2006) cannot satisfactory explain the simultaneous X-ray and optical flare. On the other hand, the late internal shock model proposed by Zou et al. (2006) could account for the broad band data of the first flare.
In the time interval from T+23 to s, the observed intensity underlying the XRT flares decays as with = 2.070.03. An initial steep decay of the X-ray emission has been observed in many other GRBs detected by Swift Tagliaferri et al. 2005a ; Nousek et al. (2006); O’Brien et al. (2006). The decay slope together with the XRT energy index measured up T+50 s are in good agreement with the interpretation of the observed emission as due to high-latitude emission Kumar & Panaitescu (2000). In this model, the tail of a peak is the emission from the shocked gas moving at angle 1/ (where is the Lorentz factor) relative to the observer. The higher the angle , the later the photon arrival-time and the weaker the relativistic beaming of the emission, leading to a decay with . After T+50 s, due to the decrease of to about , the predicted slope would be steeper than the measured . This deviation could be reconciled with the high-latitude emission assuming that the delayed radiation from the outer parts of the emitting curved shell is softer and brighter than the radiation along our line of sight Kumar et al. (2006).
The decrease of the photon index around T+50 s could be interpreted as an indication of a shift of the spectral peak energy () towards lower energies, but poor statistics and the narrowness of the XRT energy range do not allow us to verify this hypothesis.
We detected highly significant absorption in excess of the Galactic value. The host column density decreases with time at a high significance level. This is consistent with the idea that the circum-burst absorbing material is photoionized by the high-energy photons of the burst (Perna & Loeb 1998). Evidence for such a decrease has been found for GRB 980329 Frontera et al. (2000) and GRB000528 Frontera et al. (2000) but neither of them has a comparable data quality. We do not confirm evidence found by Watson et al. (2006) of an increase of the column density at the peak of the first X-ray flare.
Our lack of knowledge concerning the peak energy of the BAT and XRT spectra does not allow a precise estimate of the total energy released by GRB 050904. However, we can calculate lower and upper limits to the isotropic-equivalent radiated energy up to 244 s from the burst onset, i.e. including contributions from the first three XRT flares. To evaluate the lower limit to we integrated the best fit power law spectral energy distributions in the (1+z) keV band and in the (1+z) keV band for the BAT and XRT, respectively. The standard energy range keV (rest frame) was used to evaluate the upper limit to . We obtained erg erg. Additional contributions from the later flare portions are only a few percent in both the upper and lower limit. The large isotropic equivalent energy of this burst is in agreement with the Amati relation Amati et al. (2002) with an of about 1500 keV in the rest frame. This is consistent with our non-detection of a peak energy in BAT spectral fit.
The break observed in the optical and infrared afterglows Tagliaferri et al. 2005b at = 2.61.0 days (observer frame) and the range of evaluated above imply a jet half-opening angle between and , assuming a radiative efficiency = 20% and a circumburst medium density n = 3 cm-3. This angle estimate is consistent with those obtained by modelling optical light-curve breaks observed in 10 pre-Swift GRBs (Panaitescu 2005). It corresponds to a collimation-corrected energy between 0.4 and 4.4 erg. This is well within the distribution of GRBs with known redshift Frail et al. (2001); Bloom et al. (2003). Consistency with the Ghirlanda relation Ghirlanda et al. (2004) constrains the rest frame peak energy of the average spectrum to be between 560 and 1300 keV.
In the optical afterglow, the measured pre-break slope decay = 0.7 0.2 (Tagliaferri et al. 2005) requires an electron index of p = (4/3)+1 1.90.3 in a local uniform interstellar medium. The expected intrinsic optical spectral slope should be = (p1)/2 0.450.15 while the observed one is = 1.250.15 (Tagliaferri et al. 2005). This discrepancy could be naturally explained assuming the presence of a bit of dust ( = (1.250.45)/(1+z) = 0.1) in the local host medium. In the X-ray regime the slowest decay of a possible underlying continuum, inferred by fitting the lowest points in Fig. 1 after T+1000 s, is 1.2. This is marginally consistent with the slope expected for the forward shock emission for the value of electron index inferred from optical data: = (3p2)/4 0.950.20, under the hypothesis that the cooling frequency is between optical and X-rays. The expected spectral index in X-rays is = p/2 1.00.1, consistent with the observed = 1.00.2 after T+1000s. The continuum component inferred by the fitting the the lowest points in Fig. 1 is, therefore, marginally consistent with a standard forward shock emission and the properties of the optical emission reported by Tagliaferri et al. (2005). However, we cannot prove that the estimated underlying X-ray continuum and the late optical light curve are the same forward shock emission because the observational gaps do not allow to see the minima of the X-ray light curve.
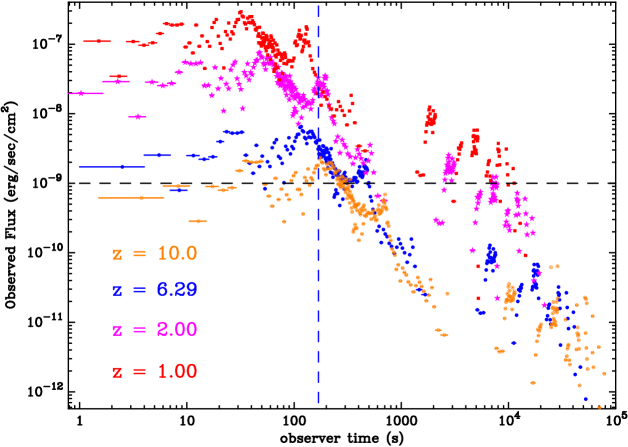
Figure 5 shows how GRB 050904 would appear in the Swift 0.2–10 keV band if it were at redshifts other than z=6.29. The observed intensity varies inversely with the square of the (1+z) factor. A further dependence on z is due to the K correction that accounts for the redshift dependence of the luminosity in a given wavelength band. The observed timescale undergoes different stretching factors with respect to the rest frame: the burst would appear longer at higher redshift. The horizontal line in Fig. 5 gives an indication of the sensitivity limit of BAT, while the vertical line marks the start of the XRT follow-up. Starting from a redshift lower than 2, BAT would have observed all later flares. GRB 050904 would have been detected up to a distance corresponding to z10. Comparing the intensity of other GRBs observed by Swift (see Fig.3 in O’Brien et al. 2006) with the flux that we would observe if GRB 050904 had exploded at a redshift lower than 2 ( the average redshift of the Swift GRBs) we see that this burst was intrinsically bright in X-rays.
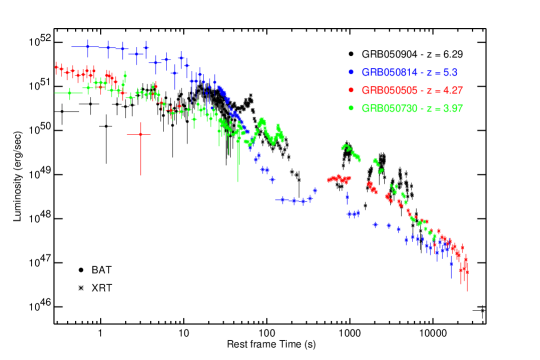
After one year of operations, Swift has detected four confirmed high-redshift (4) GRBs (out of 24 with known redshifts). Figure 6 shows the K-corrected 0.2–10 keV luminosity evolution of these GRBs, including both BAT and XRT data set. BAT light curves are obtained by extrapolation of the keV light curve to the XRT energy band. In addition to GRB 050904 this sample includes GRB 050730 at z=3.969 (Chen et al. 2005), GRB 050505 at z=4.27 (Berger et al. 2006) and GRB 050814 at z=5.3 (Jakobsson et al. 2006). All of the bursts are exceptionally luminous and long-lasting (as measured in the source rest-frame) and are among the brightest GRBs ever observed. Their exceptional intensity is not due to selection effects, since the keV burst fluxes are well above the BAT detection threshold. Rather, their unique properties could be due to their likely origin within some of the first star-forming regions in the Universe; Woosley & Heger (2006) suggested that the very low metallicities of the progenitors at these epochs may provide an explanation. A more reliable conclusion about systematic differences and similarities in luminosities and durations of high redshift GRBs will require an increase in the sample size, which should come in future years of Swift operation.
Detecting high-redshift GRBs with Swift, and measuring their redshifts with ground-based spectroscopy, is of substantial interest because of the link between long-duration GRBs and the star formation rate. The GRBs with measured redshift can be used to infer the cosmological star formation history, with relatively minor (or in any case unique) selection effects by comparison to other methods (Porciani & Madau 2001; Lamb & Reichart 2000; Bromm & Loeb 2002; Natarajan et al. 2005). A preliminary estimate of the star formation rate derived from Swift bursts (Price et al. 2006) shows, within current broad uncertainties, a flat or (at the highest redshifts) slowly-declining star formation rate, consistent with results obtained from color-selected galaxy observations (Bunker et al. 2004).
6 Summary and conclusion
We have presented the results of the analysis of BAT and XRT observations of the high redshift (z=6.29) GRB 050904. The GRB light curve is characterized by the presence of a long flaring activity lasting up to 1-2 hours after the burst onset in the burst rest frame, with no evidence of a smooth power-law decay following the prompt emission as seen in other GRBs. We interpret the overall phenomenology of GRB 050904 as long lasting prompt emission where the standard X-ray afterglow component is hardly detectable because its contribution is drowned by the intense and long lasting activity of the central engine. The spectral energy distribution softens with time, with the photon index decreasing from 1.2 during the BAT observation to 1.9 at the end of the XRT observation. The dips of the late X-ray flares may be consistent with an underlying X-ray emission arising from the forward shock and with the properties of the optical afterglow reported by Tagliaferri et al. (2005b).
Highly significant absorption in excess of the Galactic value has been detected. The intrinsic hydrogen-equivalent colunm density shows a significant decreasing with time that we interpret as due to the photoionization of the circum-burst absorbing material by the high-energy photons of the burst causing a graduale reduction of the opacity.
We have calculated lower and upper limits to the isotropic-equivalent radiated energy up to 244 s from the burst onset, i.e. including contributions from the first three XRT flares. We obtained erg erg. This range of and the break observed in the optical and infrared afterglows imply a jet half-opening angle between and , assuming a radiative efficiency = 20% and a circumburst medium density n = 3 cm-3.
Acknowledgements.
The authors acknowledge support from ASI, NASA and PPARC. KH is grateful for support under NASA grant FDNAG5-9210. We also acknowledge the anonymous referee for very useful suggestions.References
- Amati et al. (2002) Amati, L., Frontera, F., Tavani, M., et al. , 2002, A&A, 390, 81
- Andersen et al. (2000) Andersen, M. I., Hjorth, J., Pedersen, H., et al., 2000, A&A, 364, L54
- Band et al. (1993) Band, D., Matteson, J., Ford, L., et al., 1993, ApJ, 413, 281
- (4) Barthelmy, S., Barbier, L. M., Cummings, J. R., et al., 2005a, Space Sci. Rev., 120, 143
- (5) Barthelmy, S. D., Cannizzo, J. K., Gehrels, N., et al., 2005b, ApJ, 635, 133
- (6) Barthelmy, S. D.,Chincarini, G., Burrows, D. N., et al., 2005c, Nature, 438, 994
- Becker et al. (2001) Becker, R. H., Fan, X., White, R L., et al., 2001, AJ, 122, 2850
- Berger et al. (2006) Berger, E., Penprase, B. E., Cenko, S. B., et al., 2006, ApJ, 642, 979
- Bloom et al. (2002) Bloom, J. S., Kulkarni, S. R., Djorgovski, S. G., 2002, AJ, 123, 1111
- Bloom et al. (2003) Bloom, J. S., Frail, D. A., Kulkarni, S. R., et al., 2003, ApJ, 594, 674
- Bromm & Loeb (2002) Bromm, V. & Loeb, A., 2002, ApJ, 575, 111
- Boër et al. (2006) Boër, M., Atteia, J. L., Damerdji, Y., et al., 2006, ApJ, 638, L71
- Bunker et al. (2004) Bunker, A. J., Stanway, E. R., Ellis, R. S., McMahon, R. G., 2004, MNRAS, 355, 374
- (14) Burrows, D. N., Romano, P., Falcone, A., et al., 2005a, Sci, 309, 1833
- (15) Burrows, D. N., Hill, J. E., Nousek, A., et al., 2005b, Space Sci. Rev., 120, 165
- (16) Burrows, D. N., Romano, P., Godet, O., et al., 2005, in Proc. The X-ray Universe 2005, ESA-SP-604, p. 877
- Campana et al. (2006) Campana, S., Tagliaferri, G., Lazzati, D., et al., 2006, A&A, 454, 113
- Chen et al. (2005) Chen, H. S., Prochaska, J. X., Bloom, J. S., Thompson, I. B., 2005, ApJ, 634, L25
- Costa et al. (1997) Costa, E., Frontera, F., Heise, J., et al., 1997, Nature, 387, 783
- Cucchiara et al. (2005) Cucchiara, A., Cummings, J., Holland, S., et al., 2005, GCN Circular 3923
- Cummings et al. (2005) Cummings, J., Angelini, L., Barthelmy, S. D. , et al., 2005, GCN Circular 3910
- (22) Cusumano, G., Mangano, V., Angelini, L., et al., 2006a, ApJ, 639, 316
- (23) Cusumano, G., Mangano, V., Chincarini, G., et al., 2006b, Nature, 440, 164
- Dickey & Lockman (1990) Dickey, J. M. & Lockman, F. J., 1990, ARA&A, 28, 215
- Falcone et al. (2006) Falcone, A. D., Burrows, D. N., Lazzati, D. et al, 2006, ApJ, 641, 1010
- Fan et al. (2003) Fan, X., Strauss, M. A., Schneider, D. P. et al. 2003, AJ, 125, 1649
- Fan & Wei (2005) Fan, Y. Z. & Wei, D. M., 2005, MNRAS, 364, 42
- Fishman & Meegan (1995) Fishman, G. J., Meegan, C. A., 1995, ARA&A, 33, 415
- Fox et al. (2005) Fox, D. B., Frail, D. A., Price, P. A, et al., 2005, Nature, 437, 845
- Frail et al. (1997) Frail, D. A., Kulkarni, S. R., Nicastro, S. R., et al., 1997, Nature, 389, 261
- Frail et al. (2001) Frail, D. A., Kulkarni, S. R., Sari, R., et al., 2001, ApJ, 562, L55
- Frontera et al. (2000) Frontera, F., Amati, L., Costa, E., et al., 2000, ApJS, 127, 59
- Frontera et al. (2004) Frontera, F., Amati, L., Lazzati, D., et al., 2004, ApJ, 614, 301
- Gehrels et al. (2004) Gehrels, N., Chincarini, G., Giommi, P. , et al., 2004, ApJ, 611, 1005
- Gendre et al. (2006) Gendre, P., Galli, A., Corsi, A., et al., 2006, A&A, submitted, astro-ph/0603431
- Ghirlanda et al. (2004) Ghirlanda, G., Ghisellini, G., Lazzati, D., 2004, ApJ, 616, 331
- Nysewanderet al. (2005) M. Nysewander, D. Reichart, J. Haislip, 2005, GCN Circular 3922
- Kawai et al. (2005) Kawai, N., Yamada , T., Kosugi, G., et al., 2005, GCN Circular 3937
- Kneib et al. (2004) Kneib, J. P., Ellis, R. S., Santos, M. R., Richard, J., 2004, ApJ, 607, 697
- Kobayashi et al. (2005) Kobayashi, S., Zhang, B., Mészáros, P., Burrows, D. N., 2005, ApJ, submitted, astro-ph/0506157
- Kumar & Panaitescu (2000) Kumar, P., & Panaitescu, A., 2000, ApJ, 541, L92
- Kumar et al. (2006) Kumar, P., McMahon, E., Barthelmy, S. D., et al., 2006, MNRAS, 367, L52
- Jakobsson et al. (2006) Jakobsson, P., Leva, A., Gynbo, J .P., et al., 2006, A&A, 447, 897
- Lamb & Reichart (2000) Lamb, D. Q. & Reichart, D. E., 2000, ApJ, 536, 1
- MacFadyen et al. (2001) MacFadyen, A. I., Woosley, S. E., Heger, A., 2001, ApJ, 550, 410
- Mészáros & Rees (1997) Mészáros, P., & Rees, M. J., 1997, ApJ, 476, 232
- Moretti et al. (2006) Moretti, A., Perri, M., Capalbi, M., et al., 2006, A&A, 448, L9
- Morris et al. (2006) Morris, D. C., Reeves, J., Pal’shin, V., et al., 2006, ApJ, submitted, astro-ph/0602490
- Natarajan et al. (2005) Natarajan, P., Albanna, B., Hjorth, J., et al., 2005, MNRAS, 364, L8
- Nousek et al. (2006) Nousek, J. A., Kouveliotou, C., Groupe, D., et al., 2006, ApJ, 642, 389
- O’Brien et al. (2006) O’Brien, P. T., Willingale, R., Osborne J., et al., 2006, A&A, in press, astro-ph/0601125
- Pagani et al. (2006) Pagani, C., Morris, D. C., Kobayashi, S., et al., 2006, ApJ, 645, 1315
- Palmer et al. (2005) Palmer, D., Barbier , L., Barthelmy, S., et al., 2005, GCN Circular 3918
- Panaitescu et al. (2005) Panaitescu, A., 2005, MNRAS, 363, 1409
- Perna & Loeb (1998) Perna R. & Loeb A., 1998, ApJ, 501, 467
- Piro et al. (2005) Piro, L., De Pasquale, M., Soffitta, P., et al., 2005, ApJ, 623, 314
- Preece et al. (2000) Preece, R. D., Briggs, M. S., Mallozzi, R. S, et al., 2000, ApJS, 126, 19
- Price et al. (2006) Price, P. A., Cowie, L. L., Minezaki, T., et al., 2006, ApJ, 645, 851
- Porciani & Madau (2001) Porciani, C., & Madau, P., 2001, ApJ, 548, 522
- Rees & Mészáros (1994) Rees, M. J., & Mészáros, P., 1994, ApJ, 430, L93
- Reichart (2005) Reichart, D. E., 2005, GCN Circular 3915
- Romano et al. (2006) Romano, P., Moretti, A., Banat, P. L., et al., 2006, A&A, 450, 59
- Roming et al. (2005) Roming, P. W. A., Kennedy, T. E., Mason, K. O., et al., 2005, Space Sci. Rev., 120, 95
- Sakamoto et al. (2005) Sakamoto T., Barbier L., Barthelmy, S., et al. 2005, GCN Circular 3938
- (65) Tagliaferri, G., Goad, M., Chincarini, G., et al., 2005a, Nature, 436, 985
- (66) Tagliaferri, G., Antonelli, L. A., Chincarini, G., et al., 2005b, A&A, 443, L1
- van Paradijs et al. (1997) van Paradijs, J., Groot, P. J., Galama, T., et al., 1997, Nature, 386, 686
- (68) Vaughan, S., Goad, M. R., Beardmore, A. P., et al., 2006a, ApJ, 638, 920
- (69) Vaughan, S., Willingale, R., Romano, P., et al., 2006b, ApJ, 639, 323
- Zhang et al. (2006) Zhang, B., Fan, Y.Z., Dyks, J., et al., 2005, ApJ, 642, 354
- Zou et al. (2006) Zou, Y.C., Xu, D., Dai, Z.G., 2006, ApJ, 646, 1098
- Watson et al. (2006) Watson D., Reeves, J.N., Hjorth, J., et al., 2006, ApJ, 637, L69
- Wei et al. (2006) Wei, D.M., Yan, T., Fan, Y.Z., 2006, ApJ, 636, L69
- Woosley & Heger (2006) Woosley, S.E., & Heher, A., 2006, ApJ, 637, 914