Spectropolarimetry and the study of circumstellar disks
Summary
Circumstellar disks play an important role in many stages of the evolution of stars. However, it is only possible to directly image circumstellar disks for a few of the nearest stars. For massive stars, the situation is even more difficult, as they are on average further away than the more numerous low mass stars. Here, we discuss spectropolarimetry which is a technique that can reveal the presence of disks on spatial scales of order stellar radii. It is therefore extremely useful in studying disks around young stars, while the method has prospects for quantitative modelling. In this review we will discuss the status on the study of (accretion) disks around intermediate- to high mass pre-main sequence stars and will concentrate on the linear spectropolarimetry aspect. We wil make a brief excursion to observations of massive evolved stars where spectropolarimetry has revealed the clumpy structure of stellar winds, and conclude with a brief outlook. 111To be published as a chapter in ’Diffuse Matter from Star Forming Regions to Active Galaxies’ - A volume Honouring John Dyson. Eds. T. W. Harquist, J. M. Pittard and S. A. E. G. Falle.
1 Introduction
The disk accretion paradigm has proven to be extremely successful in explaining the formation of low mass stars. Due to angular momentum considerations it is now commonly accepted that during gravitational collapse a disk forms around a newly born star. The disk material accretes onto the star by moving along magnetic field lines and free-falling onto the stellar photosphere, giving rise to shocked emission. This picture of magnetically controlled disk accretion has been confirmed for the low mass T Tauri stars, where disks have been found in high resolution images (Dutrey et al 1998) while evidence for magnetic fields and magnetically controlled accretion via such disks has been often found (Bertout 1989, Johns-Krull et al. 1999). This has been reinforced by model simulations of the data (e.g. Muzerolle et al 2001).
For the “intermediate mass” (ranging from 2-8 solar masses) objects, the optically visible Herbig Ae/Be stars, the situation is less clearcut. Although a small number of Herbig Ae stars has now been found to exhibit a (weak) magnetic field (e.g. Wade et al. 2005), these more massive stars have radiative photospheres, and consequently weaker, if any, magnetic fields. Therefore, the main component for the T Tauri paradigm, magnetically controlled disk accretion, is less well established and other scenarios that can form higher mass stars need to be considered. In addition, observationally, the presence of accretion, and disk accretion in particular is much less settled for these objects than for their low mass counterparts. Spectroscopic evidence for at least some transient accretion has now been found (e.g. Mora et al 2004), mostly towards the A-type objects. Evidence for the presence of extended, flattened disks has emerged recently (e.g. Mannings & Sargent 2000 in mm-CO observations, Fukagawa et al 2003, Grady et al 2001 in coronagraphic images). These large arcsec scale structures do not necessarily indicate the presence of accretion disks, which, inevitably, are to be found at much smaller radii.
The picture is even more obscure for the most massive stars, which we loosely define as having masses greater than about 8-10 M⊙. Even a theoretical consensus has not emerged for these objects. The radiation pressure from a newly born, yet still accreting star, may blow away the infalling material, halting further growth (e.g. Yorke & Kruegel 1977; Adams 1993). The maximum possible mass that can be accumulated in simple accretion models is as low as 10M⊙ (Wolfire & Cassinelli 1987). Disks around massive stars may help the continued growth of these cores; Material accreting via a disk captures less light than in the spherical case, while disks can withstand the radiation pressure much better due to their higher density (Norberg & Maeder 2000; Yorke & Sonnhalter 2002). Accretion disks may thus be able to supply the necessary material to allow stars to reach higher masses. As an alternative, stellar coalescence due to collisions of lower mass objects has been proposed as a way to form a massive star (Bonnell, Bate & Zinnecker 1998; Bally & Zinnecker 2005).
Next to the theoretical difficulties, observations of massive young stellar objects (MYSO) are challenging. The steepness of the Initial Mass Function combined with their short lifetimes make them scarce. They are therefore found at distances that are on average much larger than those to lower mass stars, and this hampers studies aimed at probing the circumstellar material close to the objects. The situation is made worse as most young massive stars are deeply embedded in their natal clouds, in general preventing optical studies. Thus, the presence of disks would go a long way into explaining the formation of massive stars, but data on disks of any size are sparse. Indirect evidence for the presence of, large scale, disks comes from high resolution radio observations of the ionized circumstellar material. Hoare et al (1994, 2002) have seen evidence both for flattened disk-like winds and highly collimated jets, suggesting the presence of inner disks feeding both processes. Among the highest resolution studies of MYSOs we find the exceptional data for the 8-10M⊙ object G192.16-3.82. Shepherd et al. (2001) obtained 30-40 milli-arcsec resolution data at 7 mm with the VLA for their single target. Based on the similarities of the disk found at 100 AU with those around lower mass objects, they assume the disk to be an accretion disk. Only recently have examples at similar scales been published. Using the sub-millimetre array, Patel et al. (2005) observed Cepheus A HW2, a 15M⊙ pre-main sequence star and found a disk or a flattened geometry with a size of order 330 AU. Jiang et al. (2005) observed the Becklin-Neugebauer object, which has an estimated mass of 7M⊙. They revealed a disk of a few hundred AU with their adaptive optics assisted polarization images. These studies are representative of the problems faced in the study of the formation of young massive stars. Firstly, the state-of-the-art-studies are single-object studies and secondly, although disks with sizes comparable to the Solar system are observed, it is extremely difficult to convincingly demonstrate the presence of accretion. The latter can only be studied when we can trace structures much closer to the star.
One such technique that is capable of probing the disks and immediate circumstellar environment on very small scales, of order stellar radii, is spectropolarimetry. Indeed, the only evidence for disks around intermediate mass pre-main sequence stars comes from spectropolarimetry across the optical H emission (Oudmaijer & Drew 1999, Vink et al 2002, 2005a). In the case of HD 87643, H could be kinematically resolved and by comparison with basic models (Wood et al. 1993) it was possible to show that the scattering electrons were located in an expanding rotating disk (Oudmaijer et al 1998). But before discussing such results, let us first consider the basics of spectropolarimetry below.
2 Spectropolarimetry as a technique
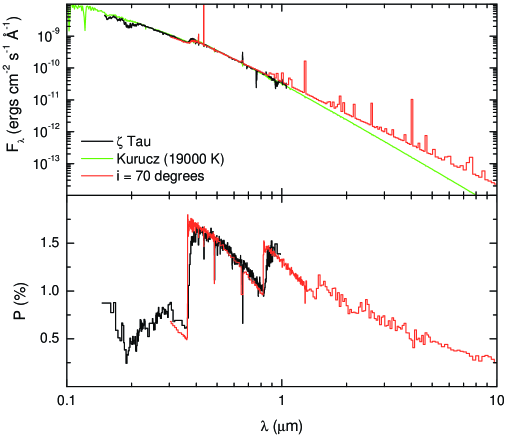
The principle of the method is rather simple: it uses the fact that free electrons in an extended ionized region scatter the continuum radiation from the central star and polarize it. If the projected distribution of the electrons on the sky is circular, for example when a disk is seen face-on, or when the material is distributed spherically symmetrically, all polarization vectors cancel out and no polarization is observed. If the geometry is not circular as in the case of an inclined disk for example, a net polarization of the stellar continuum will be observed. The polarization due to electron scattering originates from the region closest the star where the electron densities, and thus optical depths, are the largest. It is typically sensitive to scales of a few stellar radii and results in polarizations of order 1-2% (Cassinelli et al. 1987). By measuring the polarization due to ionized material, the method provides a means to detect disks that otherwise can not be found. An example of the broadband polarization behaviour around a star that is known to have an inclined disk is shown in Fig. 1. The upper panel shows the flux emanating from this system. The near-infrared excess due to bound-free and free-free emission can be clearly seen. The bottom panel shows the low resolution spectropolarimetry. The model fits (solid lines - computed up to 1m) reproduce the data very well. As electron scattering is grey, it is not intuitive that the observed polarization is not constant, but closely follows the Balmer and Paschen jumps instead. This is due to the increased hydrogen opacity shortward of the respective jumps, here the electron-scattered photons will mostly be absorbed, reducing the observed polarization, whereas the lower hydrogen opacity on the red end allows more electron-scattered photons to escape (see e.g. Wood, Bjorkman & Bjorkman 1997). The magnitude of the jump depends on many parameters, as for example the inclination of the disk.
Observing polarization on its own towards an object does not necessarily imply the presence of an aspherical small scale structure however. Aligned and elongated interstellar dust grains can selectively absorb background light resulting in a net polarization (Serkowski, 1962), while circumstellar dust in non-circular geometries at larger distances from the star can also produce net polarization, in much the same way as the free scattering electrons do. As the observed polarization can be a combination of electron-scattering, circumstellar dust scattering and interstellar polarization, the nature of the polarization can be hard to disentangle. However, the latter mechanisms have a different wavelength dependence of the polarization than the fairly flat polarization due to electron scattering, and very broad wavelength coverage observations may help in assessing the polarizing agent (e.g. Quirrenbach et al. 1997). Yet, the ISP and circumstellar dust scattering can contribute the majority to the observed polarization of an object. Unless the star is closeby and does not have much circumstellar dust, as is the case for the bright Be stars, the broad band behaviour is less conclusive than we might hope for.
Here is where line spectropolarimetry comes in. It exploits the fact that the hydrogen recombination line emission arising from within the ionized material will be polarized much less efficiently than the photospheric continuum. This is because of two reasons. Firstly the line emission will encounter less electrons as it travels a shorter distance through the disk. Secondly the lines can form over a larger volume than the electron scattering region, which is very much confined to the inner, denser, regions. This implies that emission lines will be less polarized than the continuum or even unpolarized altogether. Such a “line-effect” will be absent for the interstellar polarization as dust grains have a broad wavelength dependence, while circumstellar dust typically resides at much larger distances than the hydrogen recombination line forming region and consequently both star light and line emission will be scattered equally.
Therefore, when interpreting polarization spectra, a change in the polarization spectrum across an emission line such as H immediately indicates the presence of a flattened structure close to the star. This technique can thus reveal the presence of aspherical structures at scales that can not even be imaged with the most sensitive telescopes. Indeed, it is distance independent, so potentially stars in other galaxies can be studied in much the same way as closeby Be stars.
2.1 An example : the Be star Tau

Spectropolarimetry was already explored in the seventies by Poeckert & Marlborough (1976). They used narrow-band polarimetry to prove that Be stars are surrounded by ionized disks. It was only many years later that this result could be directly confirmed with high spatial resolution radio and optical interferometry (Dougherty & Taylor 1992, Quirrenbach et al. 1994, respectively). With the advent of CCD detectors and the installation of stable and efficient polarization optics, it has become possible to make routine spectropolarimetric observations at medium to high resolution.
Data of the H line of a typical Be star, Tau, taken in January 1996 is presented in Fig. 2, where the Stokes I (direct intensity) vector is plotted in the bottom panel, and the polarisation percentage and polarisation angle (PA) are displayed in the middle and upper panels respectively. These data are adaptively binned such that individual bins correspond to 0.1% in polarization. The line is asymmetric, assuming the line to be doubly peaked, the blue component stronger than the red component. The continuum polarisation of 1.3% and the PA of 30o follow the trend of increasing polarization observed over the past years as noted by McDavid (1999). The polarisation across the H line shows a marked drop with respect to the continuum and is a clear example of the “line-effect” revealing the presence of aspherical symmetries, i.e. the disk.
The right hand panel shows the QU polarization vectors plotted against each other, and the line excursion is clearly present as well. The cluster of points in the upper right hand corner of the graph represent the continuum polarization () and the excursion to the bottom left shows the polarization when the wavelength moves to and from the line center. The amplitude of the excursion, about 1%, is a measure of the polarization due to electron scattering and in good agreement with theoretical expectations. The individual datapoints are distributed around the linear excursion, and its pattern is not well understood. However, the scatter appears to be of order the 0.1% error binning applied and care should be taken when trying to interpret such changes.
The data also allow us to directly determine the intrinsic polarization angle (PA) from the excursion across the line profile observed in the QU diagram. The PA can be written as atan(U/Q). This results in 32o with an estimated experimental error of around 4o. In the case of optically thin scattering, the situation encountered the most, the polarization angle will be perpendicular to the disk structure itself, and the intrinsic polarization angle implies a disk orientation of -58 on the sky.
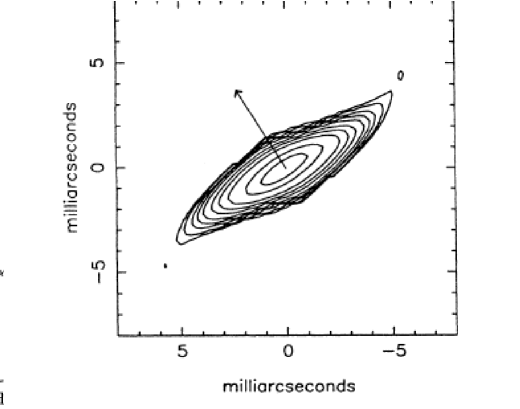
For comparison, we show Quirrenbach et al.’s (1994) high resolution, reconstructed, image in the H line of Tau in Fig. 3. With a V band magnitude of 3 and a distance of 128 pc (as derived from the Hipparcos parallax of 7.8 milli-arcsec) this is one of the brightest and nearest objects in the sky. Yet, the extent of the disk is only a few milli-arcseconds. The second contour, counted from the centre, traces 50% of the peak light, and implies a full-width-at-half-maximum (FWHM) of 5 milli-arcsec. Quirrenbach et al. (1994, 1997) measure the disk’s position angle to o. This value is in very good agreement with the position angle derived from the spectropolarimetry and presents a compelling validation of spectropolarimetry as a means to reveal small scale asphericities.

Let us now extend the wavelength coverage by a factor of a few. In Fig. 4 three other hydrogen recombination lines in the spectrum of Tau are shown, from top to bottom ordered in wavelength, the optical H, H lines and the near-infrared 1.28m Pa line. The optical lines were observed 8 years after the H line shown in Fig. 2 (September 2004, Mottram et al. 2007). The Pa line was obtained in September 1999 (taken from Oudmaijer, Drew and Vink 2005). As expected from their lower transition probabilities the lines are much weaker than H. The optical lines show stronger blue peaks, like H. Pa was taken at a different epoch and shows both peaks at similar strength. Kaye & Gies (1997) observed the same for H and clearly, the profiles are variable. Such blue peak to red peak variability of the line-profile has most often been interpreted as being due to the presence of one-armed density waves within the circumstellar disk (see e.g. Porter & Rivinius 2003). Note also that the optical, simultaneous, continuum polarization is fairly flat, as expected from electron-scattering (see Fig. 1)
The intrinsic angle derived from the QU graphs is 29o, 29o, and 32o for the lines respectively. Both H and H have consistent values, but the H and Pa data, taken a few years earlier, are different by a few degrees. This difference could be explained by the generous errorbars, but may also be a confirmation of the one-sided arm hypothesis of the disks. A axi-symmetric disk can display polarization changes, due for example to changes in its density, but it will normally be expected to show the same orientation. On the other hand, orbiting density enhancements could induce variations in the orientation if they are not always located in the same plane.
A special word on the weakest line in the graph. The H emission does not even exceed the continuum level, yet, a line-effect is clearly visible in the data. In addition, the position angle derived from the excursion in the QU plot is perfectly consistent with the other, stronger, lines. It is because we have knowledge of the other lines in the spectrum of Tau that we can be confident that a true line-effect is present. This, certainly at first sight puzzling, fact that we can see this effect at all is because the disk emission is still substantial. The photospheric hydrogen lines of a B2IV star such as Tau are strongly in absorption. Any emission first has to fill in the strong absorption line before exceeding the continuum. This emission is unpolarized and significant compared to the underlying remaining photosheric radiation, and gives rise to a line-effect. It is a testament to the spectropolarimetric method that such a weak line still allows a disk to be revealed. This is the first published instance of a “line-effect” in spectropolarimetry, without the presence of an emission line!
In summary, line spectropolarimetry is a powerful method to reveal the presence of circumstellar disks at very small scales. In the following we give a brief overview of the most recent developments in the field of spectropolarimetry. Inevitably, the topics will be slightly biased towards the interests of the author, and will focus mainly on pre-main sequences star, a brief excursion to clumpier material will be presented later.
3 Application to Pre-Main Sequence Stars
We now move towards the pre-main sequence stars. As discussed earlier, one of the major issues in the field of star formation is whether these objects accrete material via a disk or not. Establishing the presence of small scale disks will substantially contribute to settling this issue; to have disk accretion, we first need disks reaching into, or close to, the stellar photosphere. On the longer term, follow-on models have the potential obtain physical parameters for such disks.
Linear spectropolarimetry requires comparatively high spectral resolution to properly sample the emission line profiles and very high signal-to-noise ratios. The binning in the previous figures was done to an accuracy of 0.1% in polarization, which corresponds to measuring the spectrum to a precision of one-thousandth of the total collected light. This means that signal-to-noise ratios (SNR) of order 1000 are needed. If we then also add the requirement of moderately high spectral resolution, it may be clear that we are restricted to observing optically bright objects. In the 4m telescope era (AAT, WHT), objects brighter than about V = 10 are routinely observed, objects in the 11-12 magnitude range have been observed, but these become very challenging.
Such bright limits prevent us from observing the most massive, heavily embedded, optically obscured pre-main sequence stars. Having said that, an excellent starting sample to address the issue are the Herbig Ae/Be stars. These objects are intermediate between the lower mass T Tauri stars and the high mass stars. They therefore provide a continuous coverage of the mass spectrum and will allow us to mark the switch from magnetically controlled accretion to other mechanisms. Last but not least, the most massive objects among the Herbig Be stars (8-10M⊙) are already direct examples of objects which should not have formed via spherical accretion alone.
3.1 On the presence of the effect
Although line spectropolarimetry had been performed for a selected number of evolved stars such as AG Car (Schulte-Ladbeck et al. 1994 and references therein), in the early nineties, data on young stars was sparse. The best data are arguably those of Schulte-Ladbeck et al. (1992) of the Herbig Ae/Be star HD 45677. Their emphasis was on the broadband behaviour of the spectropolarimetric data however, and the spectral resolution was not sufficient to detect a line-effect in the H emission line. The first medium resolution ( kms-1) data were presented by Oudmaijer & Drew (1999) and Vink et al. (2002) who observed a significant sub-sample from the Thé et al. (1994) catalogue of Herbig Ae/Be objects. Some examples of line-effects are shown in Fig. 5, where also a T Tauri star from Vink et al. (2005a) is plotted for comparison. Whenever data on larger scale disks are available, often obtained after the spectropolarimetry, the intrinsic polarization angles are perpendicular to the position angles of the imaged disks, as expected.
To within the sensitivity, more than half of the two dozen objects surveyed show a line effect (16 out of 23 objects). As the systems are oriented randomly in the line of sight it is inevitable that some objects are face-on or close to face-on. A non-detection does therefore not necessarily imply the absence of a disk, because a face-on disk would appear circular on the sky, and not produce a line-effect. In the slightly inclined case, only very small effects are present and these may be hard to pick up at the 0.1% sensitivity level. Taking this into account, the high detection rate of a line-effect (7017%) strongly suggests that all systems are surrounded by disks. This survey therefore provides evidence that the disk accretion scenario is a strong contender to explain the formation of massive stars.
It could be argued that the mere presence of a disk alone can not be regarded as the smoking gun for disk accretion scenarios. This objection is equally valid for the disks noted in the spectropolarimetry as it is for the high resolution imaging studies by e.g. Shepherd et al. (2001). Recent studies in binary formation may help in this respect. Studies of multiplicity amongst Herbig Ae/Be stars have retrieved large binary fractions up to 70% (Baines et al. 2006, Leinert et al. 1997). As reviewed by e.g. Clarke (2001), the formation of a binary system is due to the break-up of the pre-natal cloud into two or more fragments, or due to the capture of a lower mass star. These two competing models predict a different alignment of the binary systems and the disks around the stars. Capture models result in randomly oriented disks with respect to the binary position angle (e.g. Bally & Zinnecker 2005), while fragmentation models predict co-planar disks around the stars (see also Wolf et al. 2001 who find this for T Tauri stars). Baines et al. (2006) compare the orientations of the binary Herbig Ae/Be at their disposal with the intrinsic polarization angle if present in the literature. Five of the six objects that have data for both, have intrinsic position angles perpendicular to within 25∘ from the binary position angle. From a statistical analysis they reject that the sample is drawn from a population of randomly aligned disk-binary systems at the 98.2% level. Instead, as the intrinsic polarization angle is perpendicular to the disk orientation, this result indicates that the circumprimary disks and the much larger binaries are well aligned.
This provides strong evidence in favour of the fragmentation scenario for the formation of binary systems as it predicts aligned disks, and argues against the stellar capture scenario or the stellar merger theory for the more massive stars.


3.2 Resolved emission lines
As discussed above, the classical idea of a depolarization across the emission line is due to the electrons scattering the stellar photospheric emission, and not the line itself.
However, for a large fraction of the stars, more than just a simple depolarization signature is seen, and even instances of enhanced polarization are observed. This occurs more often in the cooler Herbig Ae stars than in the Herbig Be stars. Intrigued by this, Vink et al. (2003, 2005a) observed a sample of T Tauri stars to investigate whether the line polarization properties depend on stellar mass, and if so, at what spectral type there may be a change in properties, perhaps sign posting a different formation mechanism. Fig. 5 shows a representative sequence with data from Herbig Be star, a Herbig Ae star and a T Tauri star. The earliest type star shows a clear depolarization. The T Tauri star has an additional polarization across the line, and despite many attempts to correct for intervening dust polarization, the enhanced polarization across the line remains. The same applies to the Herbig Ae object. Vink et al. (2005a) quantify these different line profiles using a measure of the width of the polarization feature across the line. There appears to be a trend in that the “shape” of the polarization across the line in the Herbig Be stars is broader than that of the T Tauri stars, with the Herbig Ae stars intermediate between the two, as also visible in the Figure. The QU graphs also show the marked difference, whereas the Herbig Be object displays a linear excursion over H, the later type objects can best be described with a “loop” (Vink et al. 2005b).
The lack of a true line depolarization in T Tauri stars can be explained by the fact that their disks are magnetically truncated and have an inner hole. As most electron-scattering occurs in the inner regions of the disk, the polarization of the photosphere of a T Tauri star due to electron-scattering could be very low. As a result, no true line effect would be expected in in the spectropolarimetry of T Tauri stars. The enhanced polarization can be explained as being due to a compact source of emission that scatters off a rotating disk-type structure. The best candidates for the compact sources will be the accretion hot spots where the accretion flow free falls onto the stellar surface.
The similarity in the spectropolarimetric behaviour of the convective T Tauri stars and their hotter Herbig Ae counterparts led Vink et al. (2003) to suggest that magnetically controlled accretion plays a role in stars more massive than T Tauri stars. In fact, this was the first indication that the change from magnetically controlled accretion to other processes occurs at higher temperatures than previously thought. Not much later, Hubrig et al (2004, 2006) and Wade et al (2005) detected, for the first time, magnetic fields in some Herbig Ae stars, supporting this idea.


3.3 Modelling : towards physical parameters of the disks
So far, we have only discussed the qualitative, observational, result that disks are present around the target objects. In parallel with the improved instrumentation, theoretical models have matured as well. The ultimate aim of such models is to constrain the astrophysical parameters of the disks giving feedback to the models of the disks’ formation. In order to reproduce the observed polarization, line emission and the spectropolarimetric line profiles, one needs full-blown radiative transfer models of such disks that take the dynamics of the system into account as well. At present, this is not readily possible, and currently the problem is approached from several directions. Broadly speaking there are two families of models being developed to interpret spectropolarimetric data.
The first line of attack is based on the line-profiles themselves. The resulting polarization as a function of wavelength gives valuable kinematical information on the velocity field of the scattering electrons. Vink et al. (2005b), using the Monte Carlo code of Harries (2000) and building on the analytical work of Wood et al. (1993) consider the scattering of radiation from a central source by rotating disks. The line emission by being scattered off the electrons within the disks will not only be polarized, but also carry the Doppler information with them. By simple comparison with the Wood et al. (1993) models, Oudmaijer et al. (1998) were able to infer from their observed line profiles that the scattering material was located in an expanding, rotating disk. A remarkable new result from the Vink et al. (2005b) paper is that it proves possible to check whether the disk reaches into the (finite) star or whether an inner hole is present, as expected for the magnetically truncated disks in T Tauri stars. An example of their model results is shown in Fig. 6. The left hand panel shows the polarization profiles for a disk with a hole, a rotation is present in the polarization angle. The right hand panel displays the case for the disk reaching into the star. The polarization itself has qualitatively the same shape, but due to light being eclipsed by the stellar disk, there occurs a double rotation in the polarization angle. This appears to be a robust result, and will allow us to pinpoint the nature of the disks, well before imaging data can resolve them. In fact, when the inclination of the (larger scale) disk is known, it proves possible to estimate the size of the inner hole. Vink et al. (2005a) apply this new technique to a sample of T Tau stars and find that the inner hole of the disk around SU Aur is larger than 3 stellar radii. This is consistent with the interferometric findings of Akeson et al. (2005) who fit ring and disk models to their visibility data of the object, and for the ring model derive an inner radius of 0.18 AU.
This approach is particularly powerful in interpreting line profiles from compact emission sources, as for example the accretion hot spots from T Tauri stars and other general cases. The natural next step is to incorporate radiative transfer in the models to simulate not only the scattering but the line emission itself as well.
This method is perfectly complemented by the radiative transfer models of circumstellar, dense, ionized disks. These models are becoming increasingly increasingly realistic (e.g. Carciofi & Bjorkman 2006). Such 3-D Monte Carlo models not only solve the radiative transfer but by following the energy packets as they are created and scattered, also compute the observed polarization (see Fig. 1, cf. Wood et al. 1997, note that the line effect is readily visible). Such models, applied to the broad wavelength spectropolarimetry have already allowed the determination of the disks’ opening angles (2.5o in the case of Tau), quantities which are impossible to measure by any other observational means. The natural next step is to implement the line profiles in the codes and it will be only a matter of time that the exciting prospect of full models of line spectropolarimetry is reality.
4 Variability studies
4.1 UXOR variability
An often overlooked property that reveals an object is intrinsically polarized and therefore surrounded by aspherical material is variability in the observed polarization. Because interstellar polarization is not expected or observed to change on short timescales, any variability immediately points at either circumstellar dust or electrons being the polarization agents.
A sub-sample of pre-main sequence stars displays a special type of photo-polarimetric variability, commonly referred to as the ‘UX Ori’ phenomenon (e.g. Grinin et al. 1994, Oudmaijer et al. 2001). From long term monitoring of a small number of young stars, Grinin et al. (1994) identified a group of objects that are photo-polarimetrically variable. This group of stars shows increased polarization when the optical light of the stars is faint. Crucially, the objects also are redder at fainter magnitudes, while in extreme visual minima there is a colour reversal, the observed colours become bluer again. Named after their proto-type, UX Orionis, these stars are commonly referred to as UXORs. UX Ori itself is a well-known Herbig Ae/Be star, and indeed many UXORs fall in the intermediate mass Herbig Ae/Be category.
The main explanation of this phenomenon concerns the existence of dust clumps located in a disk-like configuration rotating around the star. When the dusty clumps are not in our line of sight, the star will be observed at maximum light, with only a slight contribution of radiation scattered off the dusty disk. If the dust intersects the line of sight, light from the star will be absorbed, and the relative contribution of the scattered light to the total light increases, increasing the observed polarization. The fact that the reddening of the star coincides with the faintening, leaves little doubt that dust absorption indeed plays the main role in the process. In cases of extremely deep minima, the light from the star is blocked almost entirely, resulting in a ‘blueing’ of the energy distribution, as now mostly scattered light dominates the observed light. Depending on the distribution of dust-clouds, the light can be more or less absorbed during a period of photo-polarimetric monitoring. A direct observational consequence is that any variations in QU space predominately occur along a straight line with a slope perpendicular to the orientation of the disk, and is observed.
A more refined explanation of the UXOR behaviour is provided by Dullemond et al. (2003). They consider that the dusty disks around UXORs are thin and that the inner rims of the disks shadow the outer parts. The inner rim of the disks is heated by the stellar radiation field and is “puffed up”. Dullemond et al. discuss and model the case where only slight hydrodynamical perturbations can result in an uneven inner rim, and such fluctuations in the density can occasionally obscure the stellar light from view, in exactly the same manner as the qualitative clumps discussed previously in the literature.


4.2 Going clumpy : Luminous Blue Variables
Adding complications to simple observational pictures has always been a habit of theoreticians. Introducing clumps in stellar winds previously assumed to be smooth is but an example. I first met John Dyson at a workshop on evolved stars in Chile in 1991. In those days, the progenitors to Planetary Nebulae, post-Asymptotic Giant Branch stars, were not very numerous, mostly single and surrounded by spherically symmetric material, or so we thought. At that time, annoying complications such a circumstellar disks and binary central stars were creeping up already (e.g. Waters 1991), but John Dyson - who gave one of the most hilarious after dinner speeches I’ve ever witnessed - managed to complicate the issue even further with a flamboyant presentation on clumpy winds (Dyson 1991). I actually proceeded approaching the problem by considering disks around evolved stars. A step up in complexity from the spherically case at least. Fast forward more than a decade, and we arrive at the more massive evolved stars, Luminous Blue Variables (LBVs). These stars are thought to be the link between the main sequence O stars and the final products of massive-star evolution such as Wolf-Rayet stars and Supernovae (see Lamers et al 2001). Their large scale structures have bipolar morphologies (Nota et al 1995). However, it remains unclear whether these bipolar nebulae are due to spherically symmetric winds interacting with a pre-existing density contrast or whether the star is undergoing enhanced mass loss in the equatorial plane, perhaps due to rotation (Dwarkadas & Balick 1998; Dwarkadas & Owocki 2002). The presence of an equatorial density contrast, or a disk, can potentially answer questions related to the nature of the formation of the bipolar flows. To detect these disks, Davies, Oudmaijer & Vink (2005) undertook spectropolarimetric observations of a large sample of both Galactic and Magellanic Cloud Luminous Blue Variables. Around half of the objects show a line effect. As an example AG Car is shown in Fig. 7. Schulte-Ladbeck et al. (1994) already observed this line effect and also discovered polarization variability in AG Car. As the points in QU space followed a straight line in the data at their disposal, the presence of a disk was readily inferred. New data are added to this dataset and presented in Fig. 7 as well. The big cross in the middle is the polarization at the line centre. It is not variable and most likely represents the interstellar polarization. This means that the intrinsic polarization angle varies randomly with time, opposed to what would be expected from a circumstellar disk and illustrating that the addition of more data here complicated the issue.
Davies et al. (2005) discuss several mechanisms that may explain the variability, and arrive at the random ejection of clumps in the wind as the most plausible scenario. In fact, this was introduced earlier in the case of P Cygni by Nordsieck et al (2001 - using results by Taylor et al. 1991), where the variability, at smaller magnitude, was also found to be random. There are not enough variability data available to extrapolate this particular conclusion to the entire class. However, the main result that roughly half of the LBVs show a line effect and thus the evidence for either disks or clumpiness is robust. For comparison, Harries et al (1998) find that only 10% of Wolf-Rayet stars and 25% of O supergiants show the effect (Harries et al. 2002), while the majority of evolved B[e] supergiants do (Schulte-Ladbeck et al 1993; Oudmaijer & Drew 1999). Pending further analysis, the data may hint at different evolutionary sequences for WR stars and LBVs and further study is warranted. As clumps seem to dominate at least the spectropolarimetry of massive evolved stars, it would turn out that John Dyson had indeed been right to warn the unsuspecting community of more complexities!
5 Outlook

The previous sections discussed H data and the application of the method to optically visible objects. The earliest type Herbig Be stars sample the highest mass stars already, but even with the advent of the 8m class telescopes, the deeply embedded massive Young Stellar Objects remain elusive. To be able to determine whether (accretion) disks around such objects are present we need study them at longer wavelengths where the objects are brighter. Their infrared hydrogen recombination lines are fairly strong (Bunn et al 1995) and would be excellent target lines for spectropolarimetry. Little medium resolution spectropolarimetry has been performed in the near-infrared, so far however. Here we present some of the very first data across atomic lines of a stellar object. Oudmaijer et al. (2005) undertook proof-of-concept observations at UKIRT and observed amongst others the massive YSO AFGL 490. The results around the Pa line are shown in Figure 8. The data show a clear line-effect, and are consistent with Schreyer et al. (2006) who, in parallel, observed a larger scale rotating disk around the object.
Going to the other end of the evolution of massive stars, much progress has been made over the last years in the study of the geometry of supernova ejecta using spectropolarimetry. Studies from e.g. Wang et al. (2003) and Leonard et al. (2005 - see references herein), building on the original suggestion by McCall (1984) find large intrinsic polarizations, and thus asymmetries, towards core-collapse supernovae. Ultimately, data such as these, and combined with those on their progenitors such as the LBVs mentioned earlier, will provide strong observational constraints on not only the supernova mechanism itself, but also on the possible Gamma ray bursters resulting from them.
In this review, we have discussed the enormous progress that has been made, both observationally and theoretically, over the past decade in the field of linear spectropolarimetry and its application to star formation and stellar evolution. With the coming of age of spectrpolarimetry on 8-m class telescopes and improved modelling, the future hold even more exciting prospects in store.
Acknowledgements
It is a pleasure to thank John Dyson for his inspiration, not only as an astronomer, but also as a friend, and I am happy to have been able to work in Leeds with him. My sincere thanks to my long-term collaborators in spectropolarimetry, Janet Drew, Jorick Vink and Tim Harries. Joe Mottram and Ben Davies are thanked for their comments on an earlier draft of the manuscript. Jon Bjorkman is thanked for providing figure 1.
6 References
Adams F.C. 1993, ASP Conf. Ser. 35, p.56
Akeson R.L., Walker C.H., Wood, K. et al. 2005, ApJ 622, 440
Bally J., Zinnecker H. 2005, AJ 129, 2281
Baines D. Oudmaijer R.D., Porter J.M., Pozzo M., 2006 MNRAS 367, 737
Bertout C. 1989 ARA&A 27, 351
Bonnell I.A., Bate M.R., Zinnecker H. 1998, MNRAS 298, 93
Bunn J., Hoare M.G., Drew J.E. 1995, MNRAS 272, 346
Carciofi A.C., Bjorkman J.E. 2006, ApJ 639, 1081
Cassinelli J.P., Nordsieck K.H., Murison M.A. 1987, ApJ 317, 290
Clarke C.J. 2001, IAUS 200, 346
Davies B., Oudmaijer R.D., Vink J.S. 2005, A&A 439, 1107
Dougherty S.M. & Taylor R. 1992, Nature 359, 808
Dullemond C.P., van den Ancker M.E., Acke B., van Boekel R. 2003, ApJ 594, L47
Dutrey A., Guilloteau S., Prato L., Simon M., Duvert G., Schuster K., Menard F. 1998 A&A 338, L63
Dwarkadas V.V. and Balick B. 1998, AJ 116, 829
Dwarkadas V.V. and Owocki S. 2002, ApJ 581, 1337
Dyson J.E. 1991 in “Mass loss on the AGB and beyond”, ed. H.E. Schwarz, ESO Conference and Workshop Proceedings 46, p. 1
Fukagawa M., Tamura M., Itoh Y., Hayashi S.S., Oasa Y.2003, ApJ, 590, 49
Grady C.A., Polomski E.F., Henning Th. et al., 2001, AJ, 122, 3396
Grinin V.P., Thé P.S., de Winter D., Giampapa A.N., Tambovtseva L.V., van den Ancker M.E. 1994, A&A 292, 165
Harries T.J., Hillier D.J., Howarth I.D. MNRAS 296, 1072
Harries T.J. 2000, MNRAS 315, 722
Harries T.J., Howarth I.D., Evans C.J. 2002, MNRAS 337, 341
Hoare M.G., Drew J.E., Muxlow T.B., Davis R.J. 1994 ApJ 421, L51
Hoare M.G. 2002 ASP Conf Proc, Vol. 267, p 137
Hubrig S., Schöller M., Yudin R.V. 2004, A&A 428, 1
Hubrig S., Schöller M., Yudin R.V., Pogodin M.A. 2006, A&A 446, 1089
Jiang Z., Tamura M., Fukagawa M., Hough J., Lucas P., Suto H., Ishii M., Yang J. 2005 Nature 437 112
Johns-Krull C.M., Valenti J.A., Koresko C. 1999, ApJ 516, 900
Kaye A.B., Gies D.R. 1997, ApJ 482, 1028
Lamers H.J.G.L.M., Nota A., Panagia N., Smith L.J., Langer N. 2001, ApJ 551, 764
Leinert C., Richichi A., Haas M. 1997, A&A 318, 472
Leonard D.C., Weidong L., Filippenko A.V., Foley R.J., Chornock R. 2005, ApJ 632, 450
Mannings V. & Sargent A. I., 2000, ApJ, 529, 391
McCall M.L. 1984, MNRAS 210, 829
McDavid D. 1999, PASP 111, 494
Mora A., Eiroa C., Natta A. et al. 2004 A&A 419, 225
Mottram J.C., Vink J.S., Oudmaijer R.D., Patel M. 2007, MNRAS submitted
Muzerolle J. Calvet N., Hartmann L. 2001, ApJ 550, 944
Norberg P., Maeder A. 2000, A&A 359, 1035
Nordsieck K.H. et al. 2001 in “P Cygni 2000: 400 years of progress” ed. M. de Groot & C. Sterken, ASP Conf. Ser. 233, 261
Nota A.,Livio M., Clampin M., Schulte-Ladbeck R. 1995, ApJ 448, 788
Oudmaijer R.D. and Drew J.E. 1999, MNRAS 305, 166
Oudmaijer R.D., Proga D., Drew J.E., de Winter D. 1998, MNRAS, 300, 170
Oudmaijer R.D., Palacios J., Eiroa C. et al. 2001, A&A 379, 564
Oudmaijer R.D. Drew J.E., Vink J.S. 2005, MNRAS 364, 725
Patel N.A., Curiel S., Sridharan T.K., Zhang Q., Hunter T.R., Ho P.T.P., Torrelles J.M., Moran J.M., Gómez J.F., Anglada G. 2005 Nature 437, 109
Poeckert R. and Marlborough J.M. 1976, ApJ 206, 182
Porter J.M., Rivinius T. 2003, PASP 115, 1153
Quirrenbach A., Buscher D.F., Mozurkewich D., Hummel C.A., Armstrong J.T. 1994, A&A 283, L13
Quirrenbach A., Bjorkman K.S., Bjorkman J.E. et al 1997, ApJ 479, 477
Schreyer K., Semenov D., Henning Th., Forbrich J. 2006, ApJ 637, L129
Schulte-Ladbeck R.E., Shepherd D.S., Nordsieck K.H., et al. 1992, ApJ 401, L195
Schulte-Ladbeck R.E.,Leitherer C., Clayton G.C. et al. 1993, ApJ 407, 723
Schulte-Ladbeck R.E., Clayton G.C., Hillier D.J., Harries T.J., Howarth I.D. 1994, ApJ 429, 846
Serkowski K., 1962, in Adv. Astron. Astroph. 1, 289
Shepherd D.S., Claussen M.J., Kurtz S.E. 2001, Science 292, 1513
Taylor M., Nordsieck K.H., Schulte-Ladbeck R.E., Bjorkman K.S. 1991, AJ 102, 1197
Thé P.S., de Winter D., Perez M.R., 1994, A&AS, 104, 315
Vink J.S., Drew J.E., Harries T.J., Oudmaijer R.D. 2002, MNRAS, 337, 356
Vink J.S., Drew J.E., Harries T.J., Oudmaijer R.D., Unruh Y. 2003, A&A 406, 703
Vink J.S., Drew J.E., Harries T.J., Oudmaijer R.D., Unruh Y. 2005a, MNRAS, 359, 1049
Vink J.S., Harries T.J., Drew J.E. 2005b, A&A 430, 215
Wade G.A., Drouin D., Bagnulo S., Landstreet J.D., Mason E., Silvester J., Alecian E., Böhm T., Bouret J.-C., Catala C., Donati J.-F. 2005, A&A 442, L31
Wang L., Baade D., Höfflich P., Wheeler J.C. 2003, ApJ 592, 457
Waters L.B.F.M., Waelkens C., Trans N.R. 1991 in “Mass loss on the AGB and beyond”, ed. H.E. Schwarz, ESO Conference and Workshop Proceedings 46, p. 298
Wolf S., Stecklum B., Henning Th. 2001, IAUS 200, 295
Wolfire M.G., & Cassinelli J.P. 1987, ApJ 319, 850
Wood K., Brown J.C., Fox G.K. 1993, A&A 271, 492
Wood K., Bjorkman K.S., Bjorkman J.E. 1997, ApJ 477, 926
Yorke H.W. and Kruegel E. 1977, A&A 54, 183
Yorke H.W. and Sonnhalter C. 2002, ApJ 569, 846