11email: smieske@eso.org 22institutetext: Argelander Institut für Astronomie, Abteilung Sternwarte, Auf dem Hügel 71, 53121 Bonn, Germany
22email: mhilker@astro.uni-bonn.de 33institutetext: Departamento de Astronomía y Astrofísica, Pontificia Universidad Católica de Chile, Casilla 306, Santiago 22, Chile
33email: linfante@astro.puc.cl 44institutetext: Instituto de Astronomia, Geofísica, e Ciências Atmosféricas, Departamento de Astronomia, Universidade de São Paulo, Rua do Matáo 1226, Cidade Universitãria, 05508-900 São Paulo, SP, Brazil
44email: oliveira@astro.iag.usp.br
The early-type dwarf galaxy population of the Fornax cluster
Abstract
Aims. We analyse the photometric properties of the early-type Fornax cluster dwarf galaxy population ( mag), based on a wide field imaging study of the central cluster area in and bandpasses. We used the instrument/telescope combination IMACS/Magellan at Las Campanas Observatory, providing much larger light collecting area and better image resolution than previous wide field imaging surveys.
Methods. We create a fiducial sample of Fornax cluster dwarf ellipticals (dEs) in the following three steps: (1) To verify cluster membership, we measured -band surface brightness fluctuations (SBF) distances to candidate dEs known from previous surveys; (2) We re-assessed morphological classifications for those candidate dEs that are too faint for SBF detection; and (3) We searched for new candidate dEs in the size-luminosity regime close to the resolution limit of previous surveys.
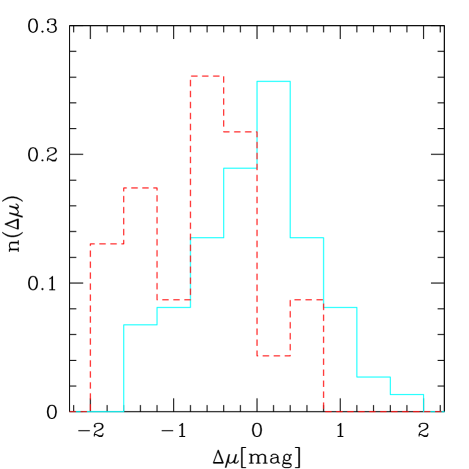
Results. (1) We confirm cluster membership for 28 candidate dEs in the range mag by means of SBF measurement. We find no SBF background galaxy. (2) Of 51 further candidate dEs in the range mag, 2/3 are confirmed as probable cluster members by morphological re-assessment, while 1/3 are re-classified as probable background objects. (3) We find 12 new dE candidates in the range mag, two of which are directly confirmed via SBF measurement. The resulting fiducial dE sample follows a well-defined surface brightness - magnitude relation, showing that Fornax dEs are about 40% larger than Local Group dEs. The sample also defines a colour-magnitude relation that appears slightly shallower than that of Local Group dEs. The early-type dwarf galaxy luminosity function in Fornax has a very flat faint end slope . We discuss these findings in the context of structure formation theories.
Conclusions. The SBF method is a very powerful tool to help constrain the faint end of the galaxy luminosity function in nearby galaxy clusters. For the Fornax cluster, morphological cluster memberships – if performed at sufficient resolution – are very reliable.
Key Words.:
galaxies: clusters: individual: Fornax cluster – galaxies: dwarf – galaxies: fundamental parameters – galaxies: luminosity function –techniques: photometric1 Introduction
1.1 Fornax cluster galaxy luminosity function
The Fornax cluster is the most prominent nearby galaxy cluster in the southern hemisphere, being located at about 19 Mpc ( mag) distance (Freedman et al. Freedm01 (2001)). Due to its compact nature and dominance of early-type galaxies (Ferguson Fergus89 (1989)), the Fornax cluster is well suited for characterising the global properties of its galaxy population. The reference source of information on the Fornax galaxy population is the Fornax Cluster Catalog (FCC, Ferguson Fergus89 (1989)), a wide-field imaging survey with 1.68′′ pixel scale on photographic scans that covers the inner 3.5 of the cluster.
One of the most important quantities for characterising a galaxy population is the galaxy luminosity function (GLF). Its logarithmic faint end slope is a very useful quantity to be contrasted with the expected slope for the mass spectrum of cosmological dark matter halos (e.g. Jenkins et al. Jenkin01 (2001), Moore et al. Moore99 (1999)). Generally, the value of derived in various environments including the Local Group is much shallower than the expected slope of dark matter halos (see for example Grebel et al. Grebel03 (2003); Trentham & Tully Trenth02 (2002); Trentham et al. Trenth05 (2005); Andreon et al. Andreo06 (2006); Tanaka et al. Tanaka04 (2005); and Infante et al. Infant02 (2003) and references therein). This discrepancy is also known as the “substructure problem” of present day cosmology.
Up to now, investigations of the Fornax GLF in the low luminosity regime ( mag) have been restricted to morphological cluster membership assignment (e.g. Caldwell Caldwe87 (1987), Ferguson & Sandage Fergus88 (1988), Ferguson Fergus89 (1989), Phillipps et al. Philli87 (1987), Kambas et al. Kambas00 (2000), Hilker et al. Hilker03 (2003)). This is because spectroscopic surveys have not had the sufficient depth to obtain velocities for dE candidates fainter than about 23 mag /arcsec2 (e.g. Hilker et al. 1999a , Drinkwater et al. Drinkw01 (2001)). The faint end slopes derived for the Fornax GLF in the literature generally cover the range , depending on the magnitude limits and galaxy types considered. The important restriction of the morphological assessment is the uncertainty in estimating the amount of contamination by background galaxies (e.g. Trentham & Tully Trenth02 (2002)). This can lead to different authors deriving very different slopes for the same cluster: Ferguson & Sandage (Fergus88 (1988)) obtain for the dwarf GLF in Fornax; Kambas et al. (Kambas00 (2000)) suggest a much steeper slope , based on poorer resolution data of without colour information (see also the discussion in Hilker et al. Hilker03 (2003)). Both surveys have comparable completeness limits of mag. Such differences in stress the need for high-resolution imaging and an extension of the limiting magnitude for direct cluster membership determination.
A note on nomenclature: for simplicity, throughout this paper we use the term dE (dwarf elliptical) to refer to early-type dwarf galaxies ( mag) in general. I.e. the term dE encompasses also dS0 and dSph.
1.2 Previous work by our group
In Mieske et al. (Mieske03 (2003), paper I hereafter) we investigated by means of Monte Carlo simulations the potential of the surface brightness fluctuations (SBF) method (Tonry & Schneider Tonry88 (1988)) to directly determine cluster memberships of faint candidate dEs in nearby galaxy clusters. We find that with 1 hour -band exposures on 8m class telescopes and with good seeing (0.5′′), reliable SBF cluster memberships can be determined down to mag at 20 Mpc distance. This is several magnitudes fainter than the limit from previous spectroscopic surveys.
In Hilker et al. (Hilker03 (2003), paper II hereafter) we present a wide field photometric study of the Fornax galaxy population, based on data obtained with the WFCCD camera at the 2.5m duPont telescope at Las Campanas Observatory, Chile (LCO). This camera has a field of view of 25′ and a pixel scale of 0.8′′, enabling the detection of very faint dE candidates. Using a combination of visual inspection and SExtractor (Bertin & Arnout Bertin96 (1996)) automated object detection, we discovered about 70 dE candidates in Fornax with mag, extending the FCC sample of Ferguson (Fergus89 (1989)) about three magnitudes fainter. For constructing the GLF from the WFCCD imaging, we used the galaxies listed in the FCC as likely cluster members plus the newly discovered fainter dE candidates. As an ad-hoc correction for possible interlopers, we restricted the sample to galaxies within 2 of the colour-magnitude and surface brightness-magnitude relation defined by the entire sample. The faint end slope derived from this was , in good agreement with the value found by Ferguson & Sandage (Fergus88 (1988)). Note that the error of this value is statistical only and does not account for systematic uncertainties of morphological classifications.
There were two deficits with the WFCCD data set, related to its large pixel scale of 0.8′′ and correspondingly large point source FWHM of about 1.9′′ ( 170 pc at the Fornax cluster distance): 1. These data did not allow to measure SBF amplitudes and hence derive direct cluster memberships for candidate dEs. 2. For mag, the image resolution approached the expected size of Local Group (LG) dE analoga, with typical LG dEs being about twice as large as the seeing FWHM (see Fig. 1). Therefore, the data did not allow to morphologically separate probable cluster members from background galaxies in that magnitude regime. Note that this resolution restriction applies even more to previous surveys such as the FCC or the Kambas et al. (Kambas00 (2000)) work.
1.3 Aim of this paper
In this paper we investigate the photometric properties of the dwarf galaxy population in the Fornax cluster ( mag), following up our paper II study. We use data obtained with the instrument IMACS mounted at the 6.5m Magellan telescopes at LCO, which provides about four times smaller pixel scale and seven times larger light collecting area as compared to the WFCCD data of paper II, and a comparable field of view. In Mieske et al. (2006b , paper III hereafter), those data were already presented and have been used to derive a calibration of the SBF method at blue colours. This paper is structured as follows:
The IMACS data are presented in Sect. 2. In the subsequent three chapters we describe the following steps to compile a fiducial Fornax dE sample:
1. Confirm cluster membership of candidate dEs by means of -band SBF measurement, see Sect. 3.
2. Re-assess the morphological classification of candidate dEs too faint for SBF detection, see Sect. 4.
3. Search for new candidate dEs close to the resolution limit of previous surveys, see Sect. 5.
2 The data
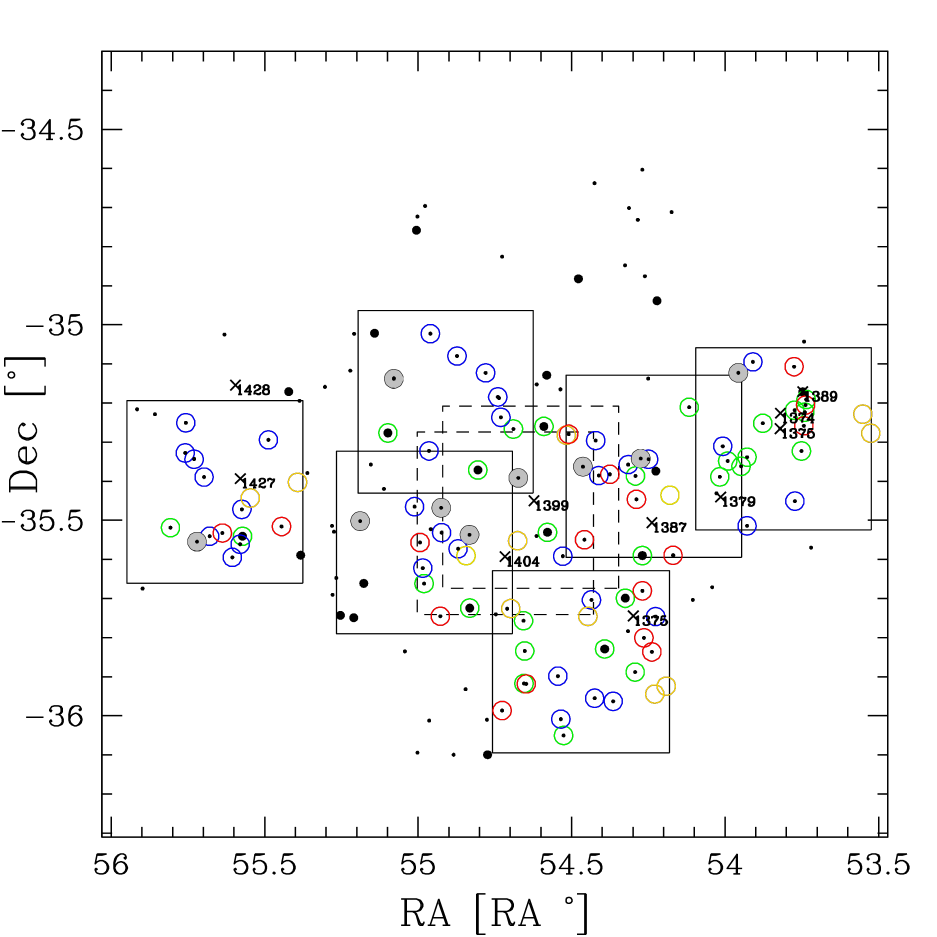
The imaging data for this paper were obtained with the instrument IMACS at Las Campanas Observatory, Chile (see also paper III). Using the “short” f/2 camera, a 27.4′ field is imaged onto eight 2k4k chips which have a pixel scale of 0.2′′. Seven fields in the central Fornax cluster were observed in both and under photometric conditions, covering the inner square degree ( 330 kpc) and slightly beyond (see Fig. 2). The total -band integration time was between 3800 and 5160 seconds, except for the central NGC 1399 field, which had 900 seconds integration for each of the two dithered exposures. The total integration times in were between 1200 and 1800 seconds except for the central field around NGC 1399, for which it was 900 seconds for each of the two slightly dithered exposures. The main part of the observing time was used for the -band in order to measure SBF in this filter. Table The early-type dwarf galaxy population of the Fornax cluster lists the candidate dEs from paper II that were imaged with IMACS.
The image reduction before SBF measurement was done in the following steps: first, a master-bias was created for each chip and was subtracted from the domeflat exposures. Then for each chip the bias corrected dome flats were combined to create master-domeflats. Having the master-biases and master-domeflats prepared for each chip, we used the COSMOS package111Carnegie Observatories System for MultiObject Spectroscopy, http://llama.lco.cl/aoemler/COSMOS.html to do bias-subtraction, trimming and flat-field correction of the raw science frames. The reduced single science frames were registered with integer pixel shifts to avoid distortion of the SBF power spectrum and combined using a min-max rejection algorithm. The seeing FWHM of the combined images typically ranged between 0.6 and 1.2′′, with a median around 0.8′′.

FCC 222
FCC 196
FCC 191
FCC 269
FCC 284
WFLSB 2-1
FCC 141
WFLSB 6-3
WFLSB 1-4
3 Direct cluster membership assignment via SBF measurement
The SBF measurements for the candidate dEs are performed in the -band and are described in detail in paper III. The signal-to-noise ratio of the SBF measurement is defined as , where is the amplitude of the proper stellar SBF signal, while is the white noise amplitude. The amplitude of the background SBF fluctuations (arising from undetected intra-cluster globular clusters, background galaxies, and CCD effects like fringing) ranged between 0.1 and 0.55 mag.
We classified as confirmed cluster members all galaxies for which the SBF measurement had a , see Table 1 of paper III. All those 25 galaxies have SBF distances compatible to within 1.9 with the Fornax cluster reference distance of 31.39 0.12 mag when applying the calibration D from paper III. This specific calibration implies a bifurcated relation between colour and absolute fluctuation magnitude . In paper III it was marginally favoured over a non-bifurcated relation at the 1.8 level. When opting for a non-bifurcated relation instead, the scatter of the implied SBF distances naturally increases (see Tables 2 and 3 of paper III). In that case, one galaxy is attributed a very low distance more than 3 below the reference distance, namely FCC 218 with 30.32 0.33 mag. For its magnitude, this galaxy is not an outlier in terms of colour or surface brightness, see Table The early-type dwarf galaxy population of the Fornax cluster and Sect. 6. Ex- or including it in the sample of Fornax cluster members does therefore not influence the statements that will be made further on in this paper.
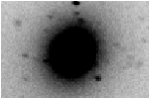
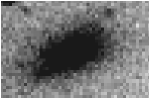
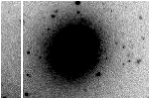
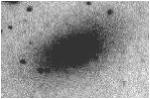
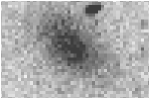
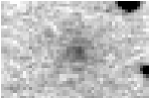
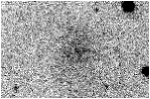
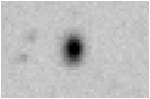
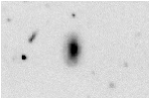
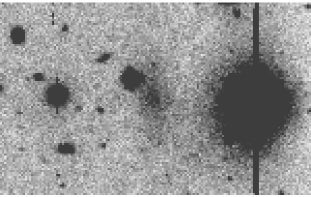
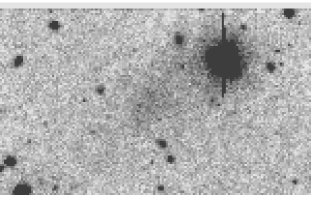
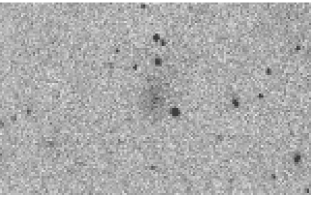
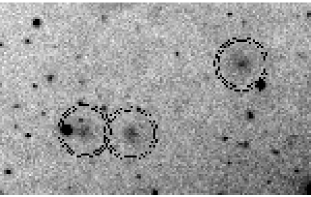
The 25 galaxies with SBF confirmed cluster membership span the range mag. Those galaxies are assigned a membership flag 1 in Table The early-type dwarf galaxy population of the Fornax cluster of this paper (see also Fig. 3 for example thumbnail images). There are 7 additional galaxies for which an SBF signal with 3 was detected. Three of them have background SBF below 50% of the stellar SBF signal and an SBF distance error below 0.5 mag. We include those three sources into the sample of confirmed cluster members assigning a flag value of 1.3. This yields a full sample of 28 galaxies spanning a luminosity range mag. The remaining four dEs ( mag) with larger background fluctuations and SBF distance errors were defined as probable members from morphology with a membership flag of 1.7 (see also next Section). Note that nine of the 28 SBF confirmed members also have radial velocity measurements available (Drinkwater et al. Drinkw01 (2001)), all of which are consistent with them being cluster members.
4 Morphological re-classification
In addition to allowing for SBF measurements, the IMACS data also enable us to check which dE candidates from paper II retain a smooth morphology when imaged at 2-3 times better spatial resolution.
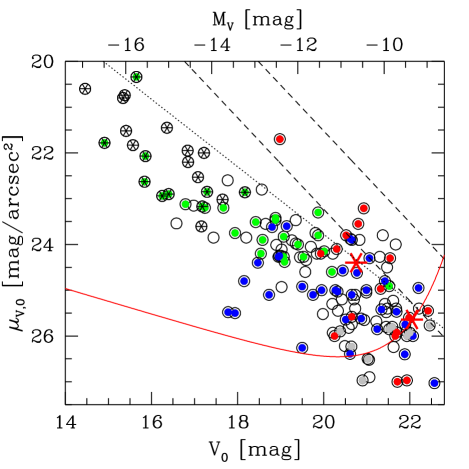
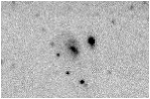
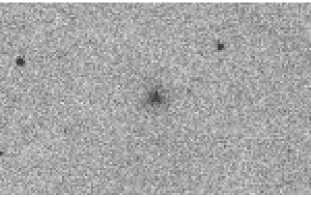
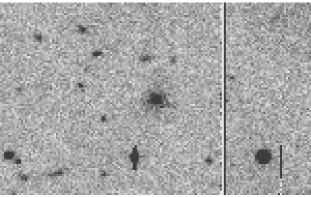
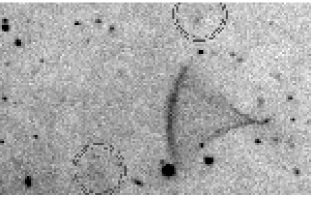
For this morphological re-assessment, we defined three possible cases. i) The galaxy retains its smoothness on the IMACS data, hence is confirmed as probable cluster member (flag 2 in Table The early-type dwarf galaxy population of the Fornax cluster). ii) The galaxy exhibits clear substructure that is indicative of a background spiral, or resolves into separate point sources (flag 3 in Table The early-type dwarf galaxy population of the Fornax cluster). Note that for the latter case we also demand that there is no low surface brightness envelope. Such an envelope would be indicative of a dwarf irregular galaxy (dIrr) that may be in the cluster. We did in any case not detect any such possible dIrr in our image inspections. iii) The IMACS data do not allow a clear assessment (flag 4 in Table The early-type dwarf galaxy population of the Fornax cluster). The latter case iii) is restricted to very low surface brightness candidates (Fig. 1). Figs. 4 and 5 show example cases for the morphological re-assessment. In the magnitude-surface brightness plot in Fig. 1 we indicate the respective classifications of the re-observed objects by different colour codings. We note that this morphological classification implicitly exploits the fact that the dwarf galaxy population in the central Fornax cluster is vastly dominated by early-type galaxies (Ferguson Fergus89 (1989)).
The majority of candidate dEs is morphologically confirmed as probable cluster members: out of 60 candidate dEs with revised morphological assessment (and no SBF measurement) in the range mag, 34 are confirmed as probable members, 17 are re-classified as probable background, and 9 have unclear definitions. The contamination by background galaxies hence is about 1/3 (17 out of 51). However, for the calculation of the GLF in paper II we excluded galaxies more than 2 outside the mean surface-brightness magnitude relation to reduce the sample contamination. When considering only candidates within the 2 surface brightness limit and brighter than the 50% detection limit of mag from paper II, the contamination drops to about 20%. Fig. 1 shows that as expected, the sources re-classified as background galaxies lie close to the resolution limit of the WFCCD data. We finally note that the WFCCD data from paper II included one pointing towards an empty comparison field outside the Fornax cluster in which two candidate dEs were detected (see Fig. 1). Given that the average number of candidate dEs per pointing in Fornax was 6.5 0.7 (paper II), the formal background contamination derived from the detection of these two sources is in the range 10% to 50%. This is consistent with the amount of contamination estimated from the IMACS morphological re-assessment.
Apart from morphological re-classification, we have also re-measured surface brightness profiles, total magnitudes and colours for the paper II candidate dEs. We describe these measurements in detail in Sect. 6, but mention this re-measurement here since in the next subsection we refer to the revised surface brightness-magnitude plot in Fig. 6.
4.1 SBF background galaxies?
Do some galaxies in our sample classify as SBF confirmed background galaxies? This would be the case for galaxies without an SBF signal that are bright and large enough to expect such a signal at the Fornax distance. In that context it is striking that all morphologically selected cluster members for which no SBF signal was detected had faint surface brightnesses 24 mag / arcsec2 (see Fig. 6). There is only a small overlap region in surface brightness ( mag/arcsec2) where both SBF memberships and morphological memberships are assigned. Galaxies in this overlap region with no SBF signal detected are the only ones that could in principle be confirmed as SBF background galaxies. Of course, one also expects such an overlap even if all galaxies are cluster members. This is because of differing SBF detection limits among the galaxies, depending on observing conditions (seeing, integration time) and intrinsic SBF amplitudes. The overall surface brightness limit for SBF detection in our data is mag / arcsec2 (except for the central pointing with shorter integration time). This limit is between the estimates derived in paper I for seeing FWHM of 0.5′′ and 1.0′′ and at comparable integration times, which fits to the fact that the median seeing of our data was 0.8′′.
In the following, we briefly discuss the galaxies in the overlap surface brightness region. The detectability of the SBF signal decreases at a fixed surface brightness when going to galaxies with fainter total luminosities, given that the SBF sampling area decreases. This fact can explain the occurence of 3 galaxies with just morphological membership in the range mag, mag (Fig. 6). We find two further galaxies in the same range but about 1.5 mag brighter. These are indeed the only two sources which from this plot may qualify as SBF confirmed background galaxies. The brighter one of these galaxies is FCC 197. This galaxy actually had a SBF signal consistent with the cluster distance, but it is one of those four sources whose was too low and background fluctuation too large to reliably classify it as an SBF member (flag=1.7 in Table The early-type dwarf galaxy population of the Fornax cluster). The fainter galaxy is FCC 220. For this galaxy we did not detect a measurable SBF signal. The corresponding galaxy image has comparably bad seeing (), and the galaxy is quite red (). These two facts decrease the detectability of the SBF signal. FCC 220 is furthermore only a few tenths of magnitudes brighter than the approximate limiting surface brightness for SBF detection in Fig. 6.
We therefore conclude that for none of the galaxies, the lack of a detectable SBF signal is sufficient to classify them as background.
IM4_2_LSB1
IM7_2_LSB1
IM1_6_LSB2
IM1_2_5_LSB1
IM1_2_2_LSB1
IM7_6_LSB1
Simulated LG dEs I
Simulated LG dEs II
Spurious detections
5 Search for new members
The WFCCD data from paper II had a resolution limit which is close to the intrinsic size of LG dEs for mag (see also Fig. 1). The IMACS data now allow us to check how many dE candidates may have been overlooked in the WFCCD data because of this restriction.
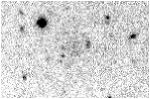
To do so, we first added several hundred images of artificial dEs of colour in the range mag on top of the IMACS -band images. For simulating them we assumed exponential surface brightness profiles. Their central surface brightnesses were adopted to randomly scatter 1.5 mag around the LG magnitude-surface brightness relation (Grebel et al. Grebel03 (2003), see also Fig. 1). This scatter corresponds to the 2 width of the magnitude-surface brightness relation for the Fornax dE candidates found in paper II. We then let SExtractor run on those images to recover the simulated dEs. To achieve efficient detection of those artifical galaxies and minimize the contamination by more compact sources, we demanded as detection threshold 400 connected pixels above 0.7 of the sky noise. Only for the central pointing with lower integration time we demanded 200 connected pixels. The detection completeness ranged between 88% for the brightest dEs with mag to 74% for the faintest dEs with mag, with an average of 80%.
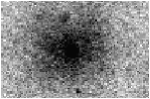
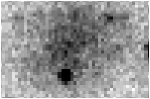
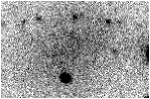
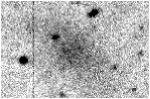
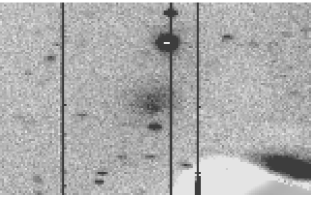
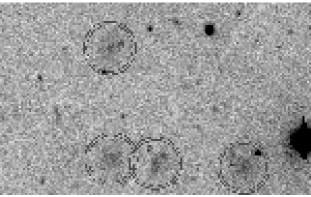
We then examined the SExtractor parameter space covered by those artificial dEs in terms of isophotal magnitude, surface brightness, Kron-radius, image area and FWHM. To find new dE candidates, we run SExtractor on all IMACS images, applying the same detection parameters as for the IMACS images with added artificial galaxies. We then restricted the SExtractor output catalog to the parameter space recovered by the program for the artifical dEs. This selection was very efficient, resulting in only very few candidates per chip, sometimes none. We then compared those detected sources morphologically with the simulated dE. We rejected obvious backgound objects like spirals, unresolved sources in the region of strong image distortion, fringing and reflection artefacts, and also groups of separate neighbouring sources that had not been correctly deblended by SExctractor (see Fig. 8 for examples). We also double-checked the image morphology in the shorter exposure -band images. Obvious V-band dropouts – hence high z objects – were rejected, although those were very few galaxies, all restricted to compact relatively high-surface brightness objects. In addition to the automated SExtractor search, we finally inspected the images visually to search for sources morphologically representing the simulated LG dE analoga.
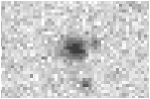
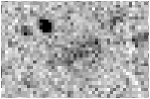
This search resulted in the detection of 12 dE candidates in the range mag that had not been detected in the WFCCD data in paper II. Example images are shown in Fig. 8. Eight of the 12 new candidates were detected by SExtractor, four additional ones by visual inspection only (see Table The early-type dwarf galaxy population of the Fornax cluster). This fraction of visual detections is consistent with SExtractor’s incompleteness as quoted above. The locations of all new dE candidates are indicated in the Fornax map (Fig. 2). Their photometric parameters are listed in Table The early-type dwarf galaxy population of the Fornax cluster and shown graphically in Figs. 6 and 9. Four of these 12 dE candidates are located outside the image borders of the WFCCD data, all of which are included in the FCC as likely cluster members (see Table The early-type dwarf galaxy population of the Fornax cluster). There is furthermore one new dE candidate listed as probable background galaxy in the FCC (see Table The early-type dwarf galaxy population of the Fornax cluster).
How many of the new dE candidates can be confirmed via SBF? We detected an SBF signal for only two galaxies, sources IM4_2_LSB1 and IM1_2_2_LSB1. The first galaxy has the highest total luminosity of the new dE candidates, while the second galaxy has the highest surface brightness. We have applied the SBF reduction procedure from paper III to these galaxies. The resulting SBF parameters are listed in Table 1. The of the SBF signal was 5.0 for IM4_2_LSB1 and 1.9 for IM1_2_2_LSB1. Their SBF distances are marginally consistent with the Fornax cluster distance of 31.39 mag (Freedman et al. Freedm01 (2001)), albeit at the low limit. We accept both galaxies as SBF confirmed Fornax cluster member, but assign IM1_2_2_LSB1 an intermediate membership flag=1.3 due to its low in the SBF measurement (see Table The early-type dwarf galaxy population of the Fornax cluster).
None of the other new candidates had a measurable SBF signal. It must therefore be checked whether among those may be any bona-fide SBF background galaxy. From Fig. 6 it is clear that apart from the two candidates with SBF signal, six more have central surface brightnesses mag/arcsec2, which was the approximate SBF detection limit for the entire sample of dE candidates from paper II. Three out of those six are detected in the central dithered IMACS pointing which only had 1800 seconds total exposure time. Two of the galaxies, namely IM1_2_6_LSB1 and IM1_1_7_LSB1, are indeed detected in only one of the two dithered exposures of 900 seconds integration time. This substantial reduction of integration time by a factor of 2-4 compared to the other fields results in a brighter limiting magnitude for SBF measurement by 1-2 mag (see paper I), hence explaining the absence of an SBF signal. Two further galaxies IM1_6_LSB1 and IM1_6_LSB2 had very large PSF FWHM 1.6′′, being located in a part of the field of view with strong image distortion (see Fig. 8). This leaves one single object, namely IM7_6_LSB1, as a galaxy with reasonably good seeing and long -band integration time. Fig. 8 shows that this galaxy is very compact, in fact yielding too few independent data points for SBF sampling. Furthermore, this galaxy has the bluest colour of all new dE candidates (see next Section and Fig. 9). It may therefore be a background blue compact dwarf or unresolved background spiral. We have assigned this galaxy an intermediate cluster membership flag of 2.3 (see Table The early-type dwarf galaxy population of the Fornax cluster).
6 The revised photometric properties of Fornax early-type dwarf galaxies
In this section we discuss the photometric properties of the early type Fornax dwarf galaxy population based on the IMACS photometry. We include in our analysis those galaxies from Table The early-type dwarf galaxy population of the Fornax cluster with membership flag . They are the ones directly classified as cluster members from SBF (Sect. 3), plus those that are probable cluster members from our revised morphological assessment (Sect. 4), plus those that were newly discovered in the IMACS data (Sect. 5).
Total galaxy magnitudes were derived with the IMACS data as for the WFCCD data by curve-of-growth analyses using the IRAF task ELLIPSE. Along each isophote fitted by ELLIPSE, a 3 clipping algorithm was applied to reject contaminating sources. The sky level was adjusted individually for every galaxy in the course of the curve-of-growth analysis. Total magnitudes were derived by summing up the fitted intensities up to a cutoff radius determined by the curve-of-growth analysis. Central surface brightnesses were determined by fitting an exponential function to the surface brightness profile, excluding the nuclear regions of dE,Ns.
Colours from the IMACS data are derived as the difference between and magnitudes within an aperture of 4′′ radius, exactly like for the WFCCD data. We adopt as the final galaxy colour the mean of the WFCCD and IMACS values, given that the scatter in the colour-magnitude plane reduces by 35% when doing so. Zero-point colour offsets between both photometry sets are negligible: the mean colour difference between IMACS and WFCCD data is mag.
It is worth detailing the procedure applied to obtain a realistic colour error for each galay. The first step was to estimate a global uncertainty of the sky background determination for the IMACS data. The corresponding colour error then is robust in a relative sense such that galaxies with fainter surface brightness have correspondingly larger colour errors. For the global sky background uncertainty in the IMACS data we adopted the RMS scatter between two sets of estimates: first, the background obtained “manually” from the curve-of-growth analysis. Second, the sky background obtained from subtracting a SExtractor sky map off the galaxy image, which itself had previously been cleaned of all objects using a SExtractor object map.
To obtain a realistic colour error also in an absolute sense, we re-scaled the estimated global sky background uncertainty such that the resulting average colour error equals the RMS scatter between the IMACS and WFCCD colours. The colour errors derived in this way were on average around 0.10 mag, with a broad range between 0.02 mag for the highest surface brightness galaxies and almost 0.40 mag for the faintest ones (see Table The early-type dwarf galaxy population of the Fornax cluster).
For and , we use only the IMACS values, given that the scatter of the mean values in the magnitude-surface brightness plane is marginally larger than the scatter of the IMACS values alone. Errors in and were derived from the uncertainty in the sky background determination in the IMACS data, as outlined in the previous paragraph. The resulting errors are given in Table The early-type dwarf galaxy population of the Fornax cluster. We finally note that the IMACS and values are on average about 0.1 mag fainter than the WFCCD values. This is because the higher resolution IMACS data allowed a better masking of contaminating point sources close to the galaxy centres, especially for the lower surface brightness galaxies.
6.1 Magnitude-surface brightness relation
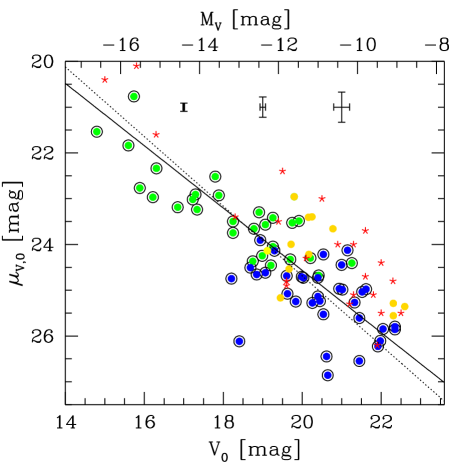
In Fig. 6 we show the IMACS magnitude-surface brightness plot, with typical error bars indicated. Data for LG dEs are shown for comparison. We fit the following relation between central surface brightness and absolute magnitude , assuming mag and applying a 3 clipping algorithm:222The fit errors are derived from random resampling of the data points within their measured scatter. Given that the scatter of values in Fig. 6 is much larger than the measurement uncertainty in both and , we do not error weight the data points in the fit.
| (1) |
Assuming the same slope, the relation defined by the LG dEs has an offset of 0.75 0.15 mag towards brighter . In other words, the Fornax dEs in our sample are about 40% larger than the LG dEs at equal central surface brightnesses. There have been indications for such a size difference also for Virgo cluster dwarfs: Caldwell & Armandroff (Caldwe00 (2000)) and Caldwell (Caldwe05 (2005)) report on the discovery of a large population of very low surface brightness dEs in the Virgo cluster whose sizes extend to significantly larger values than known for LG dEs.
An offset in mean size may be explained within a scenario where tidal forces disrupt the smallest and least massive dEs more effectively in denser environment like the Fornax or Virgo cluster than in the LG (e.g. Hilker et al. 1999c ). However, Fig. 7 suggests that the Fornax cluster also hosts an overabundance of larger dEs, in addition to an underabundance of smaller ones. Indeed, the surface brightness distribution of LG and Fornax totally agree with each other once a simple offset to the LG values is applied, see Fig. 7. One may therefore speculate that tidal heating (e.g. Valluri Vallur93 (1993), Das & Jog Das95 (1995)) could be enhancing the internal energy of dEs in the Fornax cluster more than for LG dEs. This is conceivable since tidal heating effects are expected to be more pronounced in denser environments (Valluri Vallur93 (1993)), as is the Fornax cluster in comparison with the LG. It remains to be clarified whether the vastly dark matter dominated faint dEs could indeed be sufficiently affected by the cluster tidal field.
Another mechanism that may in principle cause environmental differences among galaxy populations is re-ionization (e.g. Dekel & Woo Dekel03 (2003), Moore et al. Moore06 (2006)). It is reasonable to assume that those galaxy halos that collapsed in the densest regions of the universe collapsed very early, and consequently had more time to form stars before re-ionization than halos in less dense regions of the universe. This may have led to less centrally concentrated stellar halos in galaxies located in high density environments like Fornax. However, Grebel & Gallagher (Grebel04 (2004)) line out that the star formation histories of most LG dwarfs were probably not decisively influenced by re-ionization. Along these lines, also Ricotti et al. (Ricott02 (2002)) argue that the star formation histories of low mass dark matter haloes are almost independent of the external radiation field and mostly influenced by radiative feedback.
A general concern about the comparison between the LG and other environments is that the LG sample may be highly incomplete. In that context it is interesting to note that the latest discoveries of new faint LG members with 9 mag (e.g. Armandroff et al. Armand99 (1999), Whiting et al. Whitin99 (1999), Zucker et al. Zucker04 (2004)) are restricted to rather small scale sizes. This may indicate that the LG dE sample is more incomplete at smaller than at larger galaxy sizes. The fact that large scale stellar overdensities like the Sagittarius and Monoceros stream are quite readily detected in all-sky surveys (Ibata et al. Ibata01 (2001), Majewski et al. Majews04 (2004), Peñarrubia et al. Penarr05 (2005)), seems to support this impression.
It is clear that more work still needs to be done regarding this subject: both regarding a comparison of structural parameters of LG dwarfs with their counterparts in nearby clusters, and, the theoretical framework of dwarf galaxy formation.
6.2 Colour-magnitude relation
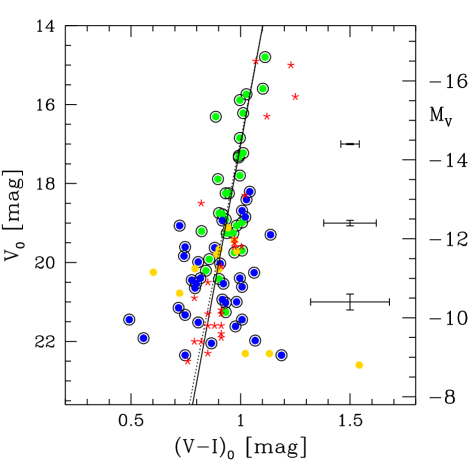
In Fig. 9 we show the colour-magnitude diagram of the same sources as in the magnitude-surface brightness plot in Fig. 6, with typical error bars indicated. Data for LG dEs are also shown for comparison. We fit the following relation between colour and absolute magnitude , applying a 3 clipping algorithm333For this fitting we weight each data point by its colour error, given that the scatter in the CMD is consistent with being entirely created by colour measurement errors.
| (2) |
The colours of Fornax dEs are in reasonable agreement with the values for Local Group dEs except for the brightest few galaxies, indicating overall similar self-enrichment histories for both populations. There is a marginal shift of 0.032 0.014 mag towards redder colours for the LG data. However, it must be noted that the LG dE colours for mag are no direct measurements but rather estimated from their [Fe/H] values (see caption of Fig 9). When restricting the consideration to mag the colour difference is substantially larger with 0.14 0.05 mag. The nominal slope of the colour-magnitude correlation for the LG dEs is , about 40% higher than for the Fornax dEs at 2.2 significance. We note that these differences are consistent with a higher self-enrichment efficiency among LG dEs than in Fornax dEs – especially in the brighter luminosity regime. It is an interesting speculation that the more compact light distribution of LG dEs (see previous sub-section) may be part of the reason for such a stronger self-enrichment, provided that light traces mass in a similar manner in both environments. Both a stronger gravitational potential and a higher gas density may have supported self-enrichment in Local Group dEs more than in Fornax dEs. The smaller sizes of Local Group dEs and the (still preliminary) colour differences between LG and Fornax dEs could therefore be two sides of the same medal.
6.3 Galaxy luminosity function
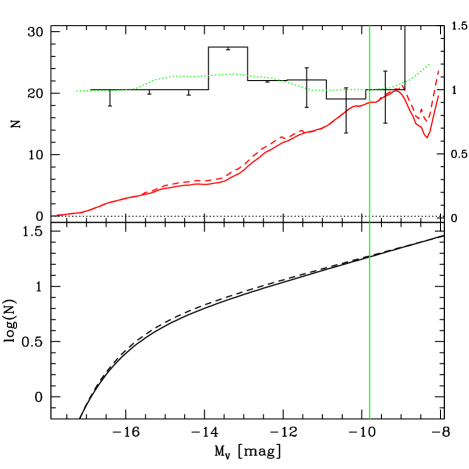
In Fig. 10 we show the Fornax dE GLF, as derived from scaling the paper II GLF with the fraction of galaxies that are confirmed as cluster members in this paper. Note that the inclusion of the new candidates from Sect. 5 raises this fraction above unity in some magnitude bins.
The denominator of this fraction is the number of galaxies per magnitude bin from paper II that enter in the calculation of the paper II LF. Note that these are only those that lie within the 2 limits of both the colour and surface-brightness magnitude relation defined by the entire sample. This restriction had been applied in paper II to reduce the effect of contaminators to the sample, given the limited morphological selection potential of the WFCCD data especially in the parameter space defined by LG dEs. The IMACS data largely removes this restriction by virtue of its improved spatial resolution. For the nominator we hence adopt the number of confirmed cluster member candidates – i.e. those with flag 2.5 in Table The early-type dwarf galaxy population of the Fornax cluster – without applying any cut. We do however exclude those five new dE candidates that were outside the WFCCD FOV.
Applying a one component Schechter function fit to the resulting dwarf galaxy luminosity function down to mag (the 50% WFCCD completeness limit), the faint end slope is both for the paper II GLF and for the corrected GLF (see Fig. 10). Note that the paper II GLF and hence also the corrected GLF is incompleteness corrected. The nominal slope difference is below 0.01. Also the inclusion of the five new dE candidates outside the WFCCD FOV does not alter the slope by more than 0.01. Restricting the fit to the very faint end mag (the onset of the dSph regime, see Grebel et al. Grebel03 (2003)), the values are for the paper II GLF and for the corrected GLF. The corrected slope is only marginally shallower than the value from paper II, much smaller than the statistical uncertainty of 0.10.
It is comforting that the faint end slope of the Fornax dwarf GLF remains in the range to when going from the early studies of Ferguson & Sandage (Fergus88 (1988)) and Ferguson (Fergus89 (1989)) to the present paper which samples the GLF to about 3 magnitudes fainter. We are therefore confident that this value is robust and not much biased by systematic effects. Morphological cluster membership assignment in Fornax apparently is very reliable, provided that the image resolution is sufficient.
It is well known that such a shallow faint end slope is in sharp contradiction to the much steeper value predicted for the mass function of CDM halos (e.g.Kauffman et al. Kauffm00 (2000), Moore et al. Moore99 (1999)). Possible reasons to explain that discrepancy include the accretion scenario (e.g. Hilker et al. 1999c , Côté et al. Cote98 (1998)), where dwarf galaxies that fall into the cluster centres are tidally disrupted, hence contributing to form the extended cD halos of the most massive cluster galaxies like NGC 1399 in Fornax. The presence of ultra-compact dwarf galaxies (UCDs) in the central Fornax cluster (Hilker et al. 1999b , Drinkwater et al. Drinkw03 (2003)) may be a signpost of these tidal interactions, given that some – but possibly not most – of them may be tidally stripped dE,Ns (Bekki et al. Bekki03 (2003), Mieske et al. 2006a ). Another possibility is that the low surface brightness dEs that we see nowadays originate from tidally stripped originally much more massive dark matter halos (Stoehr et al. Stoehr02 (2002), Kravtsov et al. Kravts04 (2004)), while the lower mass halos have not been able to maintain condensed gas to from stars. However, Kazantzidis et al. (Kazant04 (2004)) argue that observed velocity dispersion profiles of Local Group dE exclude such very massive progenitors, indicating that tidal stripping can only be a part of the picture. More work on the theoretical side is certainly needed to better understand the mechanisms that create and destroy dark matter dominated stellar systems at the low mass end (e.g. Hayashi et al. Hayash03 (2003), Moore et al. Moore06 (2006)).
7 Summary and conclusions
In this paper we have presented a photometric analysis of the early-type dwarf galaxy population ( mag) in the central Fornax cluster, covering the central square degree and slightly beyond. The analysis is based on wide field imaging in and using the instrument IMACS mounted at the 6.5m Walter Baade Magellan telescope at Las Campanas Observatory, Chile. The pixel scale of 0.2′′ and 0.8′′ median seeing FWHM enabled us to efficiently resolve LG dE analoga down to mag. We used these data to follow up a previous imaging survey of our group (Hilker et al. Hilker03 (2003), paper II) that had four times larger pixel scale and seven times smaller light collecting area.
We summarize our main results as follows:
-
1.
We confirm the cluster member status for 28 candidate dEs from paper II in the magnitude range mag by means of -band surface brightness fluctuation (SBF) measurements.
-
2.
We re-assess the morphological classification of 51 further candidate dEs from paper II in the range mag based on the much improved imaging resolution. Of these, 2/3 retain their smooth dE like appearence on our images, hence are confirmed as probable cluster members. About 1/3 are re-classified as probable background galaxies, most of which have sizes close to the resolution limit of the data from paper II. We cannot confirm the status of background galaxy by means of SBF measurement. This is because the galaxies without a measurable SBF signal are at about or fainter than the limiting surface brightness for SBF detection at the Fornax cluster distance.
-
3.
We find 12 new dE candidates in the range mag whose intrinsic sizes are close to the resolution limit of the data from paper II. These detections result from a search for low surface brightness features trimmed to detect analoga of Local Group dEs with mag. Two of the new candidates can be confirmed via SBF measurement.
-
4.
We investigate the surface brightness-magnitude relation for the joint sample of confirmed dE candidates from items (1) to (3). We derive the following fit:
We find that the Fornax dEs are shifted by 0.75 0.15 mag towards fainter at a given luminosity compared to Local Group dEs. That is, Fornax dEs are about 40% larger than Local Group dEs. We briefly discuss possible reasons for this difference. -
5.
We investigate the colour-magnitude relation for the same sample of Fornax dEs and find the following fit:
The derived slope is slightly shallower than estimated for Local Group dEs, mainly driven by the fact that Local Group dEs with mag appear significantly redder than their Fornax counterparts of same luminosity. We indicate that in the context of self-enrichment this may be expected from the fact that Local Group dEs have a more compact stellar body than Fornax dEs. -
6.
We re-scale the paper II dwarf galaxy luminosity function (GLF) in Fornax as a function of magnitude by the fraction of confirmed candidate dEs derived in items (1) to (3). A one-component Schechter fit of the corrected GLF down to mag yields a faint end slope differing by less than 0.01 from the value derived in paper II. When restricting the fit to mag, the slope is for the corrected GLF and -1.06 for the paper II GLF. Our results confirm a very shallow faint end slope for the Fornax dwarf galaxy luminosity function, in agreement with early estimates in the reference study of Ferguson & Sandage (Fergus88 (1988)). We briefly discuss this finding in the context of structure formation models.
We conclude that for nearby clusters such as Fornax, the SBF method is a powerful tool for extending the limit of cluster membership determination down to the regime where the faint end slope dominates the shape of the GLF. Our predictions for the potential of the SBF method (Mieske et al. Mieske03 (2003), paper I) are confirmed by the results of this paper. We can also conclude that for the Fornax cluster case, the morphological cluster membership assignment is very efficient, provided that the image resolution is substantially better than the expected galaxy size. Future targets for studies like the one presented here include the Virgo cluster, or other nearby galaxy groups within about 20 Mpc.
Acknowledgements.
We thank the staff at Las Campanas Observatory for their friendly and very efficient support during the execution of the imaging runs. SM acknowledges support by DFG project HI 855/1 and DAAD Ph.D. grant Kennziffer D/01/35298. LI was supported by FONDAP “Center for Astrophysics”. CMdO would like to thank the Universitätssternwarte München and the Max Planck Institut für Extraterretrische Physik for their hospitality. CmdO acknowledges support from FAPESP (proyeto temático 2001/07342-7).References
- (1) Andreon, S., Cuillandre, J.C., Puddu, E, & Mellier, Y. 2006, MNRAS in press, astro-ph/0606710
- (2) Armandroff, T.E., Jacoby, G.H., & Davies, J.E. 1999, AJ, 118, 1220
- (3) Bekki, K., Couch, W.J., Drinkwater, M.J., Shioya, Y., 2003, MNRAS, 344, 399
- (4) Bertin E., Arnouts S., 1996, A&AS 117, 393
- (5) Caldwell, N. 1987, AJ, 94, 1116
- (6) Caldwell, N., & Armandroff, T.A. 2000, 197th AAS Meeting, #106.05; Bulletin of the American Astronomical Society, Vol. 32, p.1579
- (7) Caldwell, N. 2005, Near-fields cosmology with dwarf elliptical galaxies, Proceedings of IAU colloquium 198, held 14-18 March, Switzerland, edited by Jerjen, H.; Binggeli, B. Cambridge: Cambridge University Press, 2005., pp.285-289
- (8) Côté, P., Marzke, R.O., & West, M.J. 1998, ApJ, 501, 554
- (9) Das, M., Jog, C.J. 1995, ApJ, 451, 167
- (10) Dekel, A., & Woo, J. 2003, MNRAS, 344, 1131 ApJ 438L, 13
- (11) Drinkwater, M.J., Gregg M.D., Holman B.A., & Brown M.J.I., 2001, MNRAS 326, 1076
- (12) Drinkwater, M.J., Gregg, M.D., Hilker, M. et al., 2003, Nature, 423, 519
- (13) Ferguson, H.C., & Sandage, A. 1988, AJ, 96, 1520
- (14) Ferguson H.C. 1989, AJ 98, 367
- (15) Freedman, W.L., Madore, B.F., Gibson, B.K. et al., 2001, ApJ, 553, 47
- (16) Grebel, E.K., Gallagher, J.S., & Harbeck, D. 2003, AJ, 125, 1926
- (17) Grebel, E.K., & Gallagher, J.S. 2004, ApJ letters, 610, 89
- (18) Hayashi, E. et al. 2003, ApJ, 584, 541
- (19) Hilker, M., Kissler-Patig, M., Richtler, T., Infante, L., Quintana, H. 1999a, A&AS, 134, 59
- (20) Hilker, M., Infante, L., Vieira, G., Kissler-Patig, M., & Richtler, T. 1999b, A&AS, 134, 75
- (21) Hilker, M., Infante, L., Richtler, T. 1999c, A&AS, 138, 55
- (22) Hilker, M., Mieske, S., & Infante, L. 2003, A&AL, 397, L9 (paper II)
- (23) Ibata, R., Irwin, M., Lewis, G. F. & Stolte, A. 2001, ApJ, 547L, 133
- (24) Infante, L., Mieske, S., & Hilker, M. 2003, Ap&SS, 285, 87
- (25) Kauffmann, & G., Haehnelt, M., 2000, MNRAS 311, 576
- (26) Jenkins, A., Frenk, C. S., White, S. D. M. et al. 2001, MNRAS, 321, 372
- (27) Kambas, A., Davies, J. I., Smith, R. M., Bianchi, & S., Haynes, J. A., 2000, AJ 120, 1316
- (28) Kazantzidis, S., Mayer, L., Mastropietro, C., Diemand, J., Stadel, J., & Moore, B. 2004,ApJ, 608, 663
- (29) Kissler-Patig, M., Brodie, J. P., Schroder, L. L., Forbes, D. A., Grillmair, C. J., Huchra, J. P. 1998, AJ, 115, 105
- (30) Kravtsov, A.V., Gnedin, O.Y., & Klypin, A.A. 2004, ApJ, 609, 482
- (31) Majewski, S. R., Kunkel, W. E., Law, D. R. et al. 2004, AJ, 128, 245
- (32) Mateo, M. L. 1998, ARA&A, 36, 435
- (33) Mieske, S., Hilker, M., Infante, L. 2003, A&A, 403, 43 (paper I)
- (34) Mieske, S., Hilker, M., Infante, L. 2004, A&A, 418, 445
- (35) Mieske, S., Hilker, M., Infante, L., Jordán, A. 2006a, AJ, 131, 2442
- (36) Mieske, S., Hilker, M., Infante, L. 2006b, A&A in press, astro-ph/0605660 (paper III)
- (37) Moore, B., Ghigna, S., Governato, F. et al. 1999, ApJL, 524, 19
- (38) Moore, B., Diemand, J., Madau, P., Zemp, M., & Stadel, J. 2006, MNRAS, 368, 563
- (39) Peñarrubia, J., Martínez-Delgado, D., Rix, H.W. et al. 2005, ApJ, 626, 128
- (40) Peng, E., et al. 2006, ApJ, 639, 95
- (41) Phillipps, S., Disney, M. J., Kibblewhite, E. J., Cawson, M. G. M. 1987, MNRAS, 229, 505
- (42) Ricotti, M., Gnedin, N.Y., & Shull, J.M. 2002, ApJ, 575, 49
- (43) Schlegel, D.J., Finkbeiner, D.P., & Davis, M. 1998, ApJ, 500, 525
- (44) Stoehr, F, White, S.D.M., Tormen, G., & Springel, V. 2002, MNRAS letters, 335, 84
- (45) Tanaka, M. et al. 2005, MNRAS, 362, 268
- (46) Tonry, J.L., & Schneider, D.P. 1988, AJ, 96, 807
- (47) Tonry, J.L., Dressler, A., Blakeslee, J.P. et al. 2001, ApJ, 546, 681
- (48) Trentham, N., & Tully, R.B., 2002, MNRAS 335, 712
- (49) Trentham, N., Sampson, L., & Banerji, M. 2005, MNRAS, 357, 783
- (50) Valluri, M. 1993, ApJ, 408, 57
- (51) Whiting, A.B., Hau, G.K.T., & Irwin, M.J. 1999, AJ, 118, 2767
- (52) Zucker, D.B., Kniazev, A.Y., Bell, E.F. et al. 2004, ApJ letters, 612, 121
| Name | ||||||
|---|---|---|---|---|---|---|
| IM4_2_LSB1 | 28.28 0.37 | 0.932 | 5.0 | 0.36 | 0.01 | 31.00 0.39 |
| IM1_2_2_LSB1 | 28.13 0.37 | 0.920 | 1.9 | 0.12 | 0.02 | 30.91 0.39 |
[x]—l—rrrrrr—
Membership flags and photometric properties
of investigated Fornax dE candidates, ordered by decreasing luminosity. Column 1
gives the object identifier. FCC refers to the Fornax Cluster
Catalog (FCC, Ferguson Fergus89 (1989)). WF.. refers to new dE
candidate detections from Hilker et al. (Hilker03 (2003), paper
II) with the WFCCD camera. IM… refers to new dE candidate detections from this paper using IMACS. and is from the IMACS data. The colour is the mean of the IMACS and WFCCD values, see text for more details. Errors are indicated in parentheses. The flags denote the various membership classifications as described in Sects. 3 to 5. Non-integer flags denote gradual classifications, see text. Galaxies marked with ∗ have their photometry from paper II, because in the IMACS data the detection of those objects was unclear or they were resolved into several single sources. Note that all probable members (flag 2.5) do have IMACS photometry. New dE candidates marked by ∗∗
were not imaged in the WFCCD data from paper II, but are
listed in the FCC as likely members. The galaxy marked with ∗∗∗
is listed in the FCC as likely background / possible cluster member
under FCC B1241 and in Hilker et al. (1999a ) as
GCF_1-44. The four new dE candidates marked by + were detected
only by visual inspection, not by SExtractor.
Name Flag RA [2000] DEC [2000]
\endfirstheadcontinued.
Name Flag RA [2000] DEC [2000]
\endhead\endfootFCC 222 1. 14.80 (0.01) 21.54 (0.08) 1.112 (0.040) 3:39:13.31 35:22:16.43
FCC 188 1. 15.60 (0.01) 21.84 (0.05) 1.102 (0.024) 3:37:04.68 35:35:24.36
FCC 211 1. 15.74 (0.01) 20.77 (0.06) 1.027 (0.028) 3:38:21.65 35:15:34.99
FCC 223 1. 15.89 (0.02) 22.77 (0.07) 0.997 (0.032) 3:39:19.63 35:43:27.98
FCC 241 1. 16.22 (0.02) 22.97 (0.08) 1.012 (0.040) 3:40:23.63 35:16:35.15
FCC 274 1. 16.31 (0.01) 22.34 (0.08) 0.887 (0.040) 3:42:17.30 35:32:26.84
FCC 156 1. 16.85 (0.01) 23.19 (0.06) 0.997 (0.028) 3:35:42.80 35:20:18.13
FCC 208 1. 17.23 (0.02) 23.02 (0.14) 1.012 (0.069) 3:38:18.88 35:31:50.81
FCC 196 1. 17.30 (0.02) 22.91 (0.08) 0.992 (0.040) 3:37:34.13 35:49:44.44
FCC 160 1. 17.34 (0.01) 23.24 (0.09) 0.992 (0.044) 3:36:04.16 35:23:19.18
FCC 194 1. 17.80 (0.02) 22.52 (0.09) 0.997 (0.044) 3:37:18.01 35:41:57.08
FCC 287 1. 17.89 (0.02) 22.93 (0.16) 0.897 (0.077) 3:43:13.60 35:31:07.21
FCC 269 2. 18.21 (0.09) 24.75 (0.17) 1.042 (0.081) 3:41:57.06 35:17:39.05
FCC 140 1. 18.25 (0.02) 23.75 (0.09) 0.947 (0.044) 3:34:56.59 35:11:26.99
FCC 218 1. 18.25 (0.05) 23.50 (0.17) 0.932 (0.081) 3:38:45.53 35:15:58.86
FCC 226 2. 18.41 (0.29) 26.12 (0.45) 1.027 (0.218) 3:39:50.41 35:01:21.14
FCC 228 2. 18.69 (0.08) 24.51 (0.54) 1.007 (0.263) 3:39:51.48 35:19:20.68
FCC 229 1. 18.75 (0.04) 24.37 (0.12) 0.902 (0.057) 3:39:55.33 35:39:42.30
FCC 168 1. 18.78 (0.05) 23.66 (0.16) 0.917 (0.077) 3:36:28.06 35:12:38.66
FCC 157 2. 18.85 (0.04) 24.66 (0.10) 1.022 (0.048) 3:35:42.83 35:30:50.69
FCC 141 3. 18.89 (0.01) 21.64 (0.04) 0.752 (0.020) 3:34:57.10 35:12:18.00
FCC 214 1. 18.91 (0.04) 23.30 (0.20) 0.932 (0.097) 3:38:36.66 35:50:03.16
FCC 197 1.7 18.94 (0.04) 23.91 (0.18) 0.917 (0.085) 3:37:41.17 35:17:45.13
FCC 154 1.3 18.99 (0.03) 24.25 (0.07) 1.007 (0.032) 3:35:30.49 35:15:06.44
FCC 284 1.7 19.07 (0.08) 24.62 (0.39) 0.722 (0.190) 3:42:55.16 35:20:37.25
FCC 145 1. 19.07 (0.02) 23.57 (0.15) 0.982 (0.073) 3:35:05.57 35:13:05.81
IM4_2_LSB1∗∗ (FCC 175) 1. 19.12 (0.06) 24.14 (0.23) 0.942 (0.109) 3:36:43.03 35:26:07.80
FCC 215 1. 19.21 (0.06) 24.46 (0.20) 0.822 (0.097) 3:38:37.57 35:45:24.70
FCC 191 1. 19.26 (0.05) 23.42 (0.26) 0.967 (0.125) 3:37:10.07 35:23:11.51
FCC 144 1. 19.26 (0.04) 24.05 (0.14) 0.937 (0.069) 3:35:00.29 35:19:21.83
FCC 220 2. 19.30 (0.08) 24.14 (0.33) 1.137 (0.158) 3:38:55.32 35:14:11.29
IM7_2_LSB1∗∗ +(FCC 272) 2. 19.45 (0.11) 25.17 (0.28) 0.972 (0.137) 3:42:11.20 35:26:34.44
FCC 275 2. 19.61 (0.09) 24.69 (0.15) 0.747 (0.073) 3:42:19.14 35:33:39.60
WFLSB4_4 2. 19.63 (0.09) 25.08 (0.18) 0.882 (0.089) 3:36:59.84 35:20:37.75
IM1_6_LSB2∗∗ +(FCC 127) 2. 19.67 (0.04) 24.54 (0.07) 0.902 (0.036) 3:34:06.03 35:16:37.92
FCC 192 1. 19.70 (0.08) 24.33 (0.39) 1.007 (0.190) 3:37:10.35 35:53:17.34
IM1_2_5_LSB1∗∗∗ + (FCC B1241) 2. 19.72 (0.10) 24.00 (0.28) 0.982 (0.137) 3:38:42.23 35:33:08.28
WFLSB6-4 1. 19.75 (0.04) 23.53 (0.10) 0.972 (0.048) 3:35:57.93 35:20:53.84
IM1_2_2_LSB1 1.3 19.80 (0.08) 22.96 (0.23) 0.892 (0.113) 3:39:22.49 35:35:24.83
FCC 401 2. 19.84 (0.14) 25.25 (0.32) 0.742 (0.154) 3:38:57.67 35:11:03.88
WFLSB9-4 1. 19.92 (0.04) 23.49 (0.27) 0.857 (0.129) 3:38:37.23 35:55:02.60
WFLSB1-3 2. 19.99 (0.06) 24.71 (0.13) 0.807 (0.065) 3:39:41.62 35:31:53.26
WFLSB11-4 2. 20.03 (0.16) 24.73 (0.25) 0.907 (0.121) 3:42:25.27 35:35:41.17
WFLSB10-4 2.7 20.08 (0.09) 23.77 (0.26) 1.002 (0.125) 3:37:03.46 35:48:02.16
IM1_1_7_LSB1 2. 20.16 (0.06) 23.41 (0.13) 0.792 (0.065) 3:38:04.08 35:16:55.49
IM1_6_LSB1∗∗ (FCC 131) 2. 20.17 (0.05) 24.22 (0.17) 0.907 (0.081) 3:34:12.35 35:13:41.99
WFLSB11-3∗ 3. 20.21 (0.25) 25.96 (0.06) 0.772 (0.070) 3:42:33.07 35:31:56.60
WFLSB6-2 1. 20.21 (0.04) 24.30 (0.20) 0.842 (0.097) 3:34:57.74 35:13:23.81
WFLSB6-1 3.3 20.23 (0.04) 23.51 (0.11) 0.772 (0.053) 3:35:06.06 35:06:25.16
IM7_6_LSB1 2.3 20.25 (0.07) 23.40 (0.16) 0.602 (0.077) 3:41:34.22 35:24:09.90
WFLSB10-7 2. 20.26 (0.18) 25.28 (0.30) 1.062 (0.145) 3:37:41.98 35:57:18.36
WFLSB6-6∗ 4. 20.34 (0.15) 25.86 (0.04) 1.612 (0.050) 3:35:49.64 35:07:21.86
WFLSB2-1 2. 20.40 (0.16) 25.14 (0.36) 0.817 (0.174) 3:37:38.71 35:23:07.30
WFLSB10-6 1.7 20.40 (0.13) 24.73 (0.40) 0.997 (0.194) 3:37:27.50 35:57:46.44
WFLSB10-8 1. 20.42 (0.10) 24.68 (0.22) 0.902 (0.105) 3:38:06.26 36:03:01.08
WFLSB1-6 2. 20.45 (0.08) 25.24 (0.21) 0.777 (0.101) 3:39:56.36 35:37:19.85
WFLSB11-2 2. 20.54 (0.10) 24.22 (0.27) 0.797 (0.129) 3:42:43.02 35:32:26.16
WFLSB5-1 2. 20.54 (0.11) 25.53 (0.30) 0.922 (0.145) 3:35:05.38 35:27:03.38
WFLSB4-3∗ 4. 20.60 (0.22) 26.19 (0.07) 1.082 (0.090) 3:37:05.99 35:20:31.02
WFLSB1-5 2. 20.62 (0.16) 26.45 (0.24) 1.007 (0.117) 3:40:02.76 35:27:54.50
WFLSB1-2 2. 20.65 (0.69) 26.86 (0.78) 0.792 (0.380) 3:39:28.77 35:34:21.90
WFLSB2-6 3. 20.71 (0.09) 23.45 (0.23) 1.632 (0.109) 3:37:04.65 35:40:48.76
IM1_2_6_LSB1+ 2. 20.78 (0.14) 23.66 (0.23) 0.722 (0.109) 3:38:47.54 35:43:32.52
WFLSB11-8∗ 4. 20.86 (0.33) 26.93 (0.10) 1.442 (0.120) 3:42:52.87 35:33:16.52
WFLSB2-7 2.3 20.94 (0.11) 24.97 (0.18) 0.917 (0.085) 3:37:44.44 35:42:12.92
WFLSB3-4∗ 4. 20.98 (0.20) 26.46 (0.11) 0.632 (0.130) 3:40:18.98 35:08:16.76
WFLSB3-2 1.7 21.00 (0.12) 24.45 (0.26) 0.982 (0.125) 3:39:07.18 35:07:22.33
WFLSB10-2 2. 21.02 (0.14) 24.99 (0.27) 0.932 (0.129) 3:36:54.31 35:44:46.32
WFLSB1-1 2.7 21.02 (0.07) 23.31 (0.11) 0.722 (0.053) 3:39:58.52 35:33:23.80
WFLSB6-3 3. 21.07 (0.05) 23.33 (0.09) 0.632 (0.044) 3:34:58.37 35:15:29.74
WFLSB11-1 2.3 21.15 (0.14) 24.13 (0.26) 0.717 (0.125) 3:42:17.84 35:28:18.84
WFLSB5-6 1.3 21.26 (0.08) 24.41 (0.18) 0.932 (0.085) 3:35:47.44 35:21:41.64
WFLSB3-5 2. 21.33 (0.18) 25.27 (0.31) 0.747 (0.150) 3:39:29.55 35:04:46.97
WFLSB2-3 2. 21.45 (0.26) 25.61 (0.25) 1.007 (0.121) 3:37:15.72 35:21:26.50
WFLSB12-2 2. 21.45 (0.30) 26.55 (0.33) 0.492 (0.158) 3:43:02.06 35:19:39.72
WFLSB2-13∗ 4. 21.48 (0.18) 25.81 (0.03) 0.862 (0.040) 3:37:51.20 35:21:45.36
WFLSB10-1 2. 21.52 (0.22) 25.04 (0.32) 0.807 (0.154) 3:38:08.40 36:00:30.60
WFLSB9-5 2.7 21.53 (0.18) 24.14 (0.43) 1.872 (0.210) 3:38:35.47 35:55:06.49
WFLSB1-9∗ 4. 21.55 (0.25) 25.76 (0.07) 0.452 (0.080) 3:38:41.70 35:23:29.52
WFLSB6-8 2. 21.62 (0.18) 24.98 (0.38) 0.977 (0.186) 3:36:01.80 35:18:37.99
WFLSB1-7∗ 3. 21.62 (0.55) 25.96 (0.09) 0.752 (0.110) 3:39:42.62 35:44:42.83
WFLSB4-6∗ 3. 21.67 (0.36) 26.96 (0.14) 0.982 (0.170) 3:38:02.25 35:16:46.99
WFLSB7-3∗ 4. 21.89 (0.39) 25.96 (0.07) 1.082 (0.080) 3:40:45.30 35:30:07.02
WFLSB2-11∗ 3. 21.89 (0.66) 26.93 (0.38) -0.018 (0.450) 3:36:40.68 35:35:21.84
WFLSB12-3 2. 21.92 (0.37) 26.23 (0.58) 0.557 (0.283) 3:43:01.63 35:15:01.80
WFLSB2-10∗ 2.7 21.94 (0.28) 25.56 (0.11) 0.307 (0.053) 3:37:49.95 35:32:58.67
WFLSB1-4∗ 4. 21.96 (0.40) 25.89 (0.07) 0.612 (0.090) 3:39:41.97 35:28:04.98
WFLSB2-9 2. 21.98 (0.48) 26.11 (0.78) 1.067 (0.376) 3:38:06.89 35:35:30.01
WFLSB9-6 2.7 22.04 (0.30) 25.29 (0.39) 0.812 (0.190) 3:38:54.31 35:59:11.36
WFLSB11-7 2. 22.05 (0.26) 25.85 (0.38) 0.867 (0.182) 3:42:47.38 35:23:21.34
WFLSB10-5 3. 22.25 (0.23) 24.17 (0.21) 1.017 (0.101) 3:36:57.19 35:50:11.40
IM3_7_LSB1 2. 22.31 (0.39) 25.29 (0.64) 1.132 (0.311) 3:36:45.93 35:55:27.19
IM3_7_LSB2 2. 22.31 (0.30) 25.56 (0.37) 1.022 (0.178) 3:36:54.99 35:56:39.84
WFLSB6-7 2.3 22.35 (0.15) 25.80 (0.28) 0.747 (0.137) 3:35:38.25 35:05:41.20
WFLSB10-9 2. 22.35 (0.34) 25.86 (0.60) 1.187 (0.291) 3:38:10.70 35:53:54.24
WFLSB7-4∗ 3. 22.38 (0.29) 25.41 (0.18) 0.002 (0.210) 3:41:46.77 35:30:56.95
WFLSB2-12 2.7 22.41 (0.37) 25.67 (0.38) 1.222 (0.186) 3:37:30.07 35:22:56.17
WFLSB1-11∗ 4. 22.42 (0.55) 25.73 (0.07) 1.012 (0.080) 3:39:19.84 35:32:13.27
IM3_3_LSB1 2. 22.60 (0.37) 25.36 (0.40) 1.542 (0.194) 3:37:47.22 35:44:44.23
WFLSB2-4 2.7 22.78 (0.38) 24.76 (0.39) 1.277 (0.190) 3:37:09.33 35:26:46.82