Stellar Structure of Irregular Galaxies. Edge-On Galaxies
N. A. Tikhonov
Special Astrophysical Observatory, Russian Academy of Sciences, Nizhnii Arkhyz, Karachai-Cherkessian Republic, 357147 Russia
Received July 13, 2005; in final form, November 14, 2005
Abstract
Stellar photometry obtained using the Hubble Space Telescope is used to study the distributions of the number densities of stars of various ages in 12 irregular and dwarf spiral galaxies viewed edge-on. Two subsystems can be distinguished in all the galaxies: a thin disk comprised of young stars and a thick disk containing a large fraction of the old stars (primarily red giants) in the system. Variations of the stellar number densities in the thin and thick disks in the Z direction perpendicular to the plane of the galaxy follow an exponential law. The size of the thin disk corresponds to the visible size of the galaxy at the /arcsec2, while the thick disk is a factor of two to three larger. In addition to a thick disk, the massive irregular galaxy M82 also has a more extended stellar halo that is flattened at the galactic poles. The results of our previous study of 12 face-on galaxies are used together with the new results presented here to construct an empirical model for the stellar structure of irregular galaxies.
1 INTRODUCTION
Studies of the spatial distribution of the number density of stars in the stellar subsystems of irregular galaxies requires analyses for a representative sample of galaxies, including galaxies viewed both edge-on and face-on. In [1], we presented results for 12 face-on galaxies, and concluded that these displayed an exponential drop in the radial number density of old (primarily red-giant) stars, with these stars being distributed, on average, to distances exceeding the radius of the galaxy at the /arcsec2 isophote by a factor of 2.5. However, we ran into logistical difficulties using the term ”thick disk” to describe the extended structures observed in the face-on irregular galaxies in [1]. The reason is that justification for the use of such a term requires a simultaneous consideration of the results for both the face-on and edge-on galaxies, which was not possible in [1]. We fill this gap here by presenting our results for 12 edge-on irregular or candidate dwarf-spiral galaxies.
Several stellar subsystems with different mean ages and metallicities are usually distinguished in spiral galaxies: the bulge, thin disk, thick disk, and halo. Although this nomenclature is accepted by most astronomers, there remain fundamental questions about the boundaries and sizes of these subsystems. Irregular galaxies have a simpler stellar morphology. For example, there is no bulge in dwarf galaxies, and the presence of a halo is debatable. In other words, only two stellar subsystems are actually observed in irregular galaxies: the thin and thick disks. We apply this nomenclature by analogy to spiral galaxies. As in spirals, the thin disk in an irregular galaxy is determined by the distribution of young stars, while the thick disk is determined by the distribution of the old stellar population, made up largely by red giants. The correctness of the use of these terms is demonstrated by the continuous observational transition in the morphology of the stellar structure from irregular to spiral galaxies. We thus use the traditional term ”irregular galaxies,” while bearing in mind that ”irregular” galaxies are simply low-mass disk galaxies.
2 GALAXY SAMPLE AND PHOTOMETRY
If we limit our consideration to bright supergiants, it is possible to resolve galaxies into stars using ground-based telescopes. However, the old stellar population–primarily red giants–is accessible using ground-based telescopes only in the nearest galaxies, placing severe limits on possible studies. There are now a large number of deep images with high angular resolution in the archive of the Hubble Space Telescope that can be used to study the spatial distributions of various types of stars in galaxies.
| Galaxy | Type | Apparent | Distance | Magnitude | i | Disk thickness,kpc | ||
|---|---|---|---|---|---|---|---|---|
| size | Mpc | thin disk | thick disk | |||||
| E381-018 | Irr | 1.2 0.7 | 4.94 | 15.8 | 13.7: | 65 | 0.4 | 1.0 |
| IC1574 | IB(s)m | 2.1 0.8 | 5.42 | 15.1 | 14.8 | 90 | 0.6 | 1.8 |
| IC3104 | IB(s)m | 3.8 1.8 | 2.30 | 13.6 | 15.7 | 82 | 0.3 | 1.6: |
| NGC1560 | SA(s)d | 11.7 1.9 | 3.48 | 12.2 | 18.1 | 90 | 0.6 | 1.7: |
| PGC1641 | dS0/Im | 1.1 0.7 | 2.07 | 15.6 | 11.8: | 90 | 0.2 | 0.5 |
| PGC9962 | Scd | 7.2 0.8 | 4.72 | 13.2 | 16.3 | 90 | 0.6 | 1.4 |
| PGC39032 | IBm | 1.4 0.6 | 3.19 | 15.2 | 13.4 | 90 | 0.4 | 1.0 |
| UGC1281 | Sdm | 5.8 0.7 | 5.11 | 12.9 | 16.9 | 90 | 0.4 | 1.2 |
| UGCA442 | SB(s)m | 6.4 0.9 | 4.61 | 13.6 | 15.6 | 90 | 0.8 | 2.0 |
| 7Zw403 | Pec | 1.4 0.8 | 4.35 | 14.5 | 14.6: | 54 | 0.6 | 1.7 |
| M82 | I0 | 11.2 4.3 | 3.90 | 9.3 | 19.3: | 87 | 1.5: | 2.9 |
As in our earlier paper [1], the criteria for selecting the galaxies for the study were their sizes (which are substantial for the HST WFPC2 camera) and rotational rates ( 100 km s-1; this indirectly determines the galaxy type). Since the inclinations of most irregular galaxies to the line of sight are known only with large uncertainty, we selected galaxies with probable large axial ratios , assuming that precisely such galaxies will likely be inclined to the line of sight by angles close to 90. Using the list of nearby galaxies in the Local Group [2], we determined that different types of galaxies have different mean axial ratios . The mean axial ratios for galaxies of types T = 7, 8, 9, and 10 are = 5.3, 2.9, 2.1, and 1.8. We can clearly see a tendency for decreasing a/b in the transition from obviously spiral to irregular galaxies. Among 225 nearby irregular galaxies (T = 10) with luminosities below , there are only seven with axial ratios . Two of these are located in regions of strong absorption in the Milky Way, and their morphologies are not clear. Among the remaining five galaxies, only UGC 5186 has a high axial ratio, = 4.3, while the other galaxies have . This suggests that the most flattened galaxies are more likely to be spirals than irregulars according to a Hubble classification, with the axial ratios of irregular galaxies being, as a rule, .
Understanding that applying too strict criteria for the selection of the galaxies will lead to a very small number of objects in the sample, and bearing in mind possible inaccuracies in the classification of galaxies, we left the two probable dwarf spiral galaxies NGC 1560 and UGC A442 in our list. The three galaxies NGC 1560, UGC 1281, and PGC 9962 have rotational rates that slightly exceed our adopted criterion (100 km s-1), however we left these galaxies in our list, in view of the absence of evident spiral structure in HST images.
A list of the galaxies studied is given in the table, which presents for each galaxy the visible size and morphological type from the NASA Extragalactic Database (NED), the inclination from the LEDA database (http://www-obs.univ-lion1.fr/hypercat/ search.html/), the integrated magnitude from the RC3 catalog, and the distance, absolute magnitude, and total thickness of the thin and thick disks in the direction derived by us. The three galaxies ESO 381-018, UGC 7242, and 7Zw403 have LEDA inclinations 60–65∘, but, as we indicated above, the uncertainties of such data can be quite high. For example, the bright part of 7Zw403 used to determine the inclination is compact. However, the thick disk of this galaxy, which is comprised of red giants and is visible only in HST images, is appreciably elongated, suggesting a high inclination of the galaxy to the line of sight.
We reduced the HST WFPC2 and ACS/WFC images using the MIDAS package. We did not perform the preliminary reduction, since this was done automatically when we requested the images from the HST archive. Cosmic-ray traces were removed using the standard FILTER/COSMIC program in MIDAS. We carried out photometry of the stars in the images using the DAOPHOT II [3] and HSTphot [4] programs.
HSTphot yields more accurate results, as can be seen from the decrease in the width of the red-giant and blue-giant branches in color–magnitude diagrams, but DAOPHOT II is able to photometrize weaker stars than HSTphot, which can sometimes be of crucial importance.
We applied the recommendations given in [5, 6] when carrying out the photometry and translating the instrumental magnitudes for the DAOPHOT II WFPC2 images to the standard VI Kron–Cousins system. The translation of the instrumental magnitudes for the ACS/WFC camera to the standard VI Kron–Cousins system was based on calibration relations obtained for stars in the irregular galaxy IC10, for which we performed photometry for the same stars using the ACS/WFC and WFPC2 images.
The photometry yielded tables with the coordinates and magnitudes of the stars, together with accompanying parameters enabling estimation of the photometric accuracy and deviations of the profile of a photometrized object from the standard stellar profile, making it possible to remove diffuse objects (distant galaxies) and pseudo-stars arising due to residual cosmic-ray traces from the final list of stars.
3 DISTRIBUTION OF THE NUMBER DENSITY OF STARS IN THE Z DIRECTION
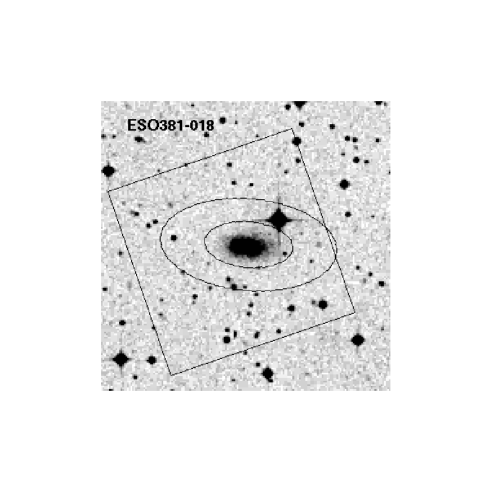
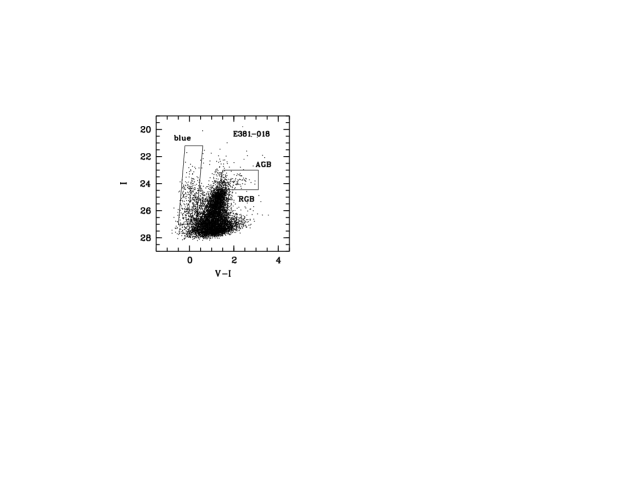
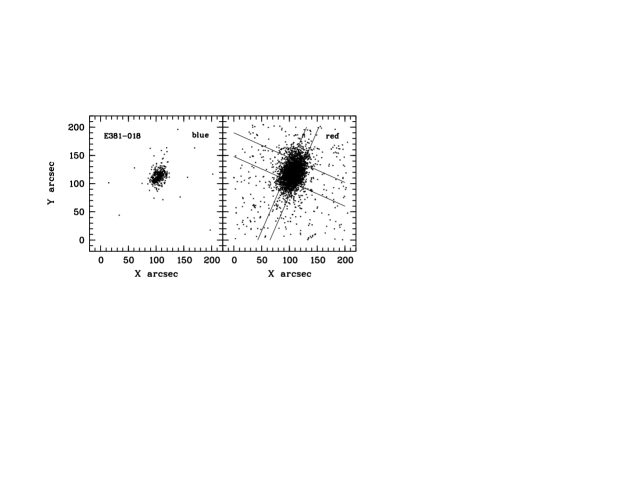
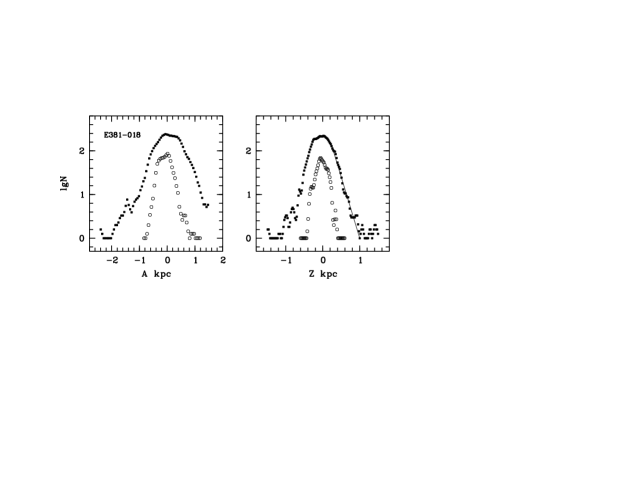
Using one galaxy as an example, let us consider the procedure used for our measurements. Figure 1 presents 5 images of the Digital Sky Survey (DSS) for the Southern galaxy ESO 381-018. The square marks the region imaged by the HST ACS/WFC. The ellipses indicate the boundaries of the distributions of young stars (thin disk) and old stars (thick disk) found by us. Figure 2 presents the results of stellar photometry of the ACS/WFC image in the form of a color–magnitude diagram (CMD). This diagram is an ordinary Hertzsprung–Russell diagram for irregular galaxies. The red-giant branch (RGB) and blue-supergiant branch (blue) are clearly distinguished. The red-supergiant branch and asymptotic giant branch (AGB) are less clearly visible due to their smaller populations. The regions whose stars were used to calculate the stellar number densities are indicated by lines. Figure 3 presents the distribution in the galaxy of the blue and red stars distinguished in this way. As in the face-on galaxies, the blue stars are concentrated toward the galactic center, while the red stars form a more extended subsystem. The parallel lines in Fig. 3 indicate bands within which the stellar number densities were calculated; the results are presented in Fig. 4, which shows the distributions of stars along both the major and minor () axes of the galaxy. We can see that the size of the galaxy corresponding to the distribution of red giants is 4 kpc 2 kpc or 3.0 , which exceeds the size of the galaxy given in the NED database by a factor of two. The blue supergiants form a subsystem 0.8 kpc 0.4 kpc in size, while the AGB stars form a subsystem with an intermediate size, which we do not present in view of the small number of AGB stars and associated large fluctuations in the stellar number density.
Since a red-giant branch can be distinguished in each galaxy, we used the ”Tip of the Red-Giant Branch” method to calculate the distance to each galaxy [7]. To simplify the calculations, although this yields a somewhat lower accuracy, we took the absolute magnitude of stars at the tip of the red-giant branch to be for all galaxies. This approach can worsen the accuracy in the distance modulus by up to 0.05m, but this is not important for the problem at hand. We used the extinctions of [8] when calculating each distance modulus.
We measured the number density of stars for the other galaxies in our list in the same way as for ESO 381-018; the results are shown in Fig. 5. In spite of some differences in the galactic morphologies, we can see that, in each of the 11 galaxies, the red giants form a subsystem that is a factor of two to three larger than the subsystem of young stars. We can see that the red giants display an exponential decrease in the number density of stars in the direction. The deviation from exponential behavior in the fall-off of the number density of red giants for NGC 1560 has a technical origin–a decrease in the area for the stellar counts due to an unfortunate positioning of the center of the WFPC2 image relative to the galaxy. The largest ratio of the sizes of the thick and thin disks is displayed by IC 3104 (type IB(s)m). However, the galaxy IC 1574, which has the same type, displays a completely normal ratio of these sizes.
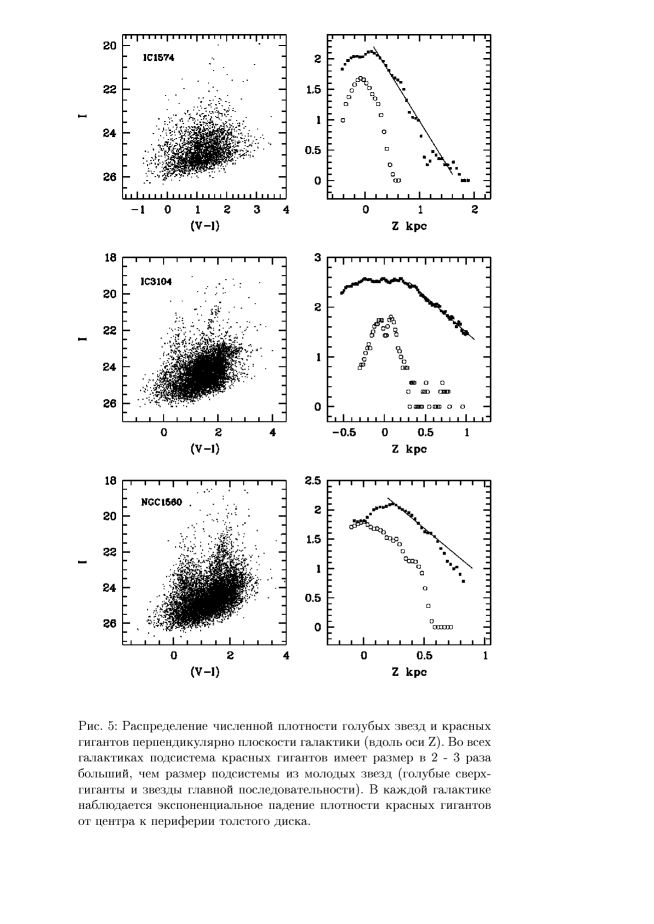
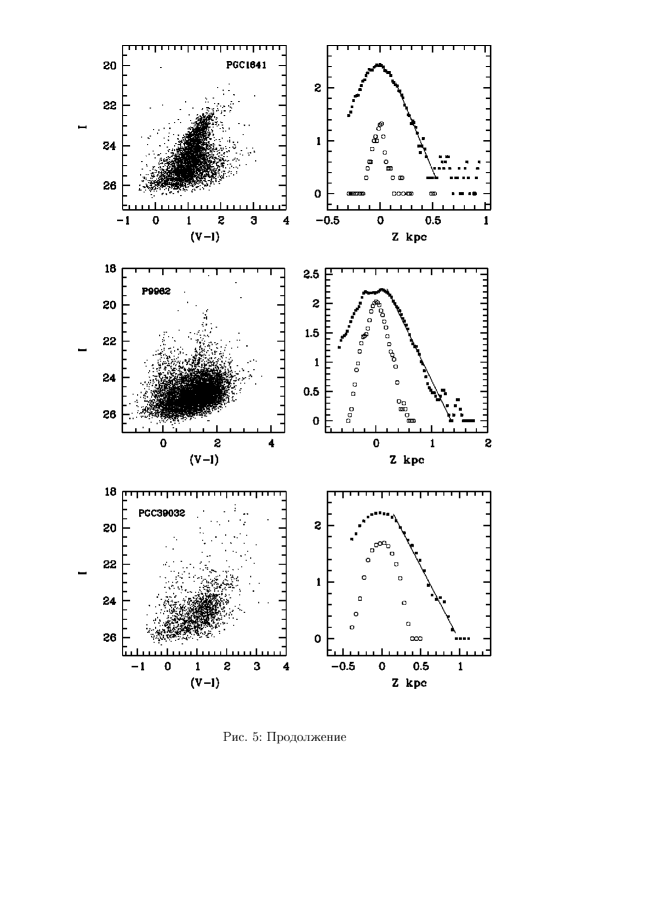
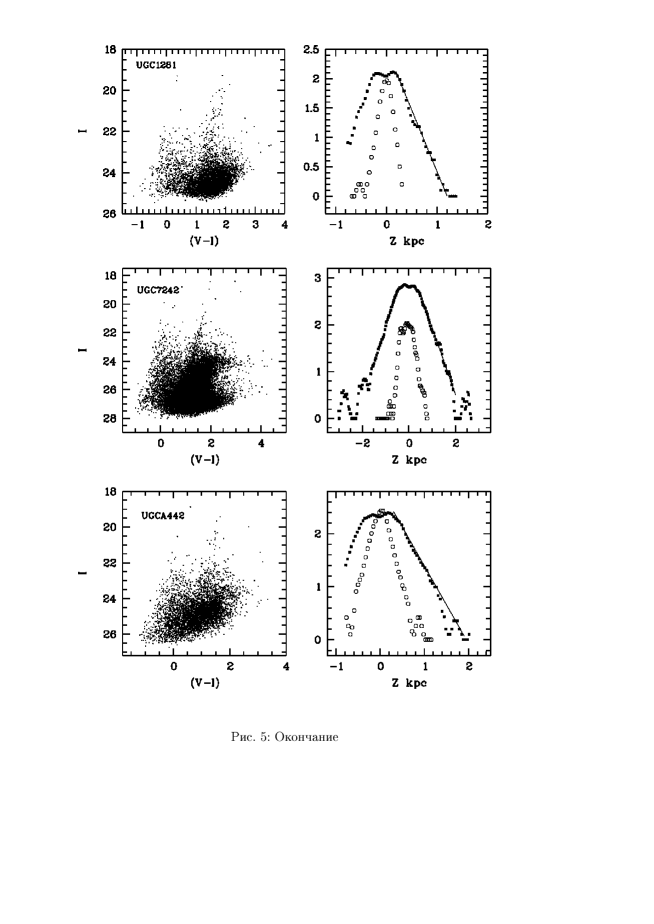
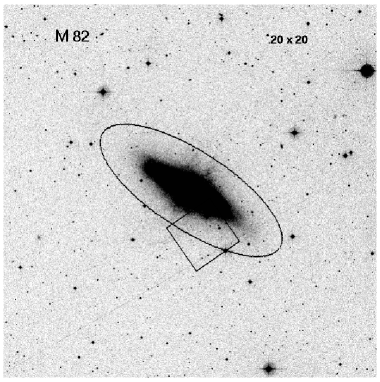
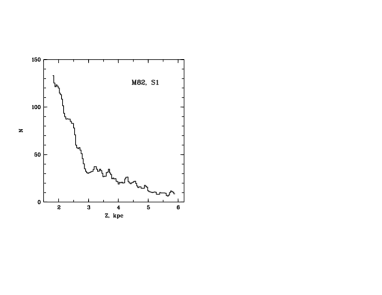
An elongated disk of red giants can be seen around the blue compact galaxy with intense central star formation 7Zw403, which has a typical ratio of thick-to-thin disk sizes, confirming that it is an irregular galaxy undergoing a burst of star formation. The galaxy M82 was comparatively recently considered to be a prototype Irr II irregular galaxy. It has now been firmly established that the anomalous colors of the galaxy are a consequence of absorption in extended gas–dust clouds. Although M82 has a high mass, no spiral structure is observed. The edges of the ACS/WFC image of this galaxy (Fig. 6) coincide with the boundary of the thick disk, beyond which a halo is clearly detected. M82 is one of only a few irregular galaxies in which an extended halo that is flattened at the galactic poles is observed, in addition to the thick disk (Fig. 6). Other irregular galaxies with halos include IC10 [9] and NGC 3077.
We expect the galaxy NGC 1560 to have a halo based on its brightness and morphology, but were not able to find images of regions far from the center of this galaxy in the HST archive. The young stars in the thin disk also display an exponential fall-off in their number density in the direction. This is most clearly visible in galaxies with a large number of young stars, since there can be substantial statistical fluctuations in the stellar number density if the number of stars is small.
As was noted above, not all of the galaxies considered have formal inclinations to the line of sight of 90. The results presented in the table show that the mean total sizes for the thin and thick disks in the Z direction are 1.2 and 3.2 kpc; i.e., they are not very thin. The possible importance of corrections to the galaxy inclinations can be estimated from the following example. For a galaxy with a ratio of its thickness to its diameter of 1 : 3, which approximately corresponds to the results for the irregular galaxies in the table, the correction to the size of the disk due to the galaxy having an inclination differing by 30∘ from the required value of 90 leads to an increase in the calculated size of the disk by only 10%, which is not important, given the other possible sources of measurement error. In other words, the sizes of the thin and thick disks in the table correspond to their true sizes, with only small corrections for the effects of inclination.
4 THE STRUCTURE OF IRREGULAR GALAXIES
Given the randomness of our selection of the studied galaxies, it is very likely that other irregular galaxies have a similar structure: a thin and thick disk, with a halo as well in massive galaxies. The thin disk is defined by the boundary in the distribution of young stars. Naturally, the lower the mass of the galaxy, the larger the fluctuations in the shape of the thin disk that can be introduced by bright star-forming regions. Although the mean distribution of young stars follows an exponential (or close to exponential) law in the direction, deviations from such a law are possible in some galaxies due to the presence of regions of star formation near the edge of a disk.
Since the thick disks of irregular galaxies consist of old stars, their distributions of the number density of stars should display monotonic properties. To all appearances, only external gravitational influences can distort the observed exponendial variation in the stellar number density for the thick disk in the direction, as is observed, for example, in the spiral galaxy NGC 4631 [10]. The size of the thick disk in the direction is a factor of two to three larger than the size of the thin disk, which corresponds within the uncertainties to the ratio of the radii of these disks for the face-on galaxies.
The relative dimensions of the halos of irregular galaxies remain uncertain due to the small-number statistics for our sample. A comparison of the stellar structures for edge-on irregular galaxies and spiral galaxies [10–12] indicates that the two types of galaxies are morphologically similar in terms of the relative sizes of their thin and thick disks. This suggests that the relative halo dimensions for irregular galaxies may likewise obey the same relations we found for spiral galaxies. Thus, the halos should be flattened at the galactic poles and extend in the Z direction to distances about twice as far as the thick disks.
The question of whether the cross sections of disk galaxies are elliptical or oval remains unresolved due to insufficient data. The difference between these shapes is not large enough to be able to distinguish between them in the presence of large fluctuations in the surface density of stars at the edge of the galaxy. Moreover, it is not ruled out that both elliptical and oval cross sectons could be present in a galaxy.
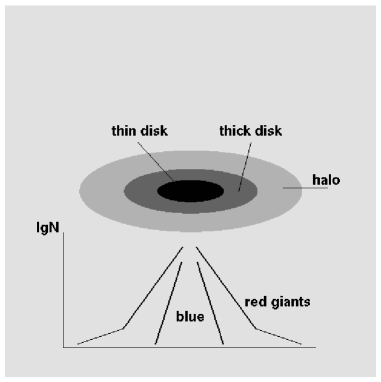
Based on our studies of 24 face-on and edge-on galaxies, we have constructed a simple empirical model for the stellar structures of irregular galaxies (Fig. 7). We cannot indicate an absolute scale in Fig. 7 because the sizes and degree of flattening vary from galaxy to galaxy, but the mean ratio of the sizes of the thick and thin disks is a fairly stable quantity, equal to 2.50.5.
5 DISCUSSION AND CONCLUSIONS
In our studies of irregular galaxies, we have used the young and old stellar populations to construct the stellar distributions in the thin and thick disks. The intermediate-age population (AGB stars) have remained unused for several reasons: (a) the small number of AGB stars in the galaxy peripheries makes any conclusions very uncertain, and (b) there are both relatively young, high-mass stars and comparatively old, low-mass stars within the region in Fig. 2 occupied by AGB stars. It is not possible to separate them out based on our photometry. Thus, results for the distribution of AGB stars will depend on ratios of the numbers of stars of various ages, but should, on average, correspond to the distribution of intermediateage stars (with ages between those for blue supergiants and red giants). This is indeed observed in the studied galaxies.
Our empirical model for the stellar structures of irregular galaxies is consistent with the results of other studies to date [13–18]. The only exception is the dwarf galaxy Leo A, for which both a thick disk and halo have been detected, in contradiction with our suggestion that halos should be observed for massive galaxies. Since the method of fitting ellipses was used to describe the distribution of the stellar number density for this galaxy, which differs from our method of using narrow bands or sectors, it may be that the appearance of the halo of this galaxy is associated with the use of different search methods. Indeed, although ellipse-fitting yields deeper results for star counts, it can lead to spurious variations in the gradient of the radial distribution when the isophote eccentricity varies with distance from the galactic center, which can easily be misinterpreted as the presence of a halo.
In summary, our studies of the stellar populations in 24 face-on and edge-on galaxies have yielded the following conclusions.
(1) The distributions of stars of various ages in the radial and directions follow exponential (or close to exponential) laws that correspond to the disk component of the galaxy.
(2) Young and old stars have different gradients for the fall-off of number density from the center to the edge of the galaxy.
(3) Young stars for the thin disk, whose size corresponds approximately to the visible size of the galaxy, while the old stars (red giants) form the thick disk, whose size is a factor of two to three larger than thin.
(4) A halo made up primarily of red giants is also observed in massive irregular galaxies, beyond the thick disk.
(5) Based on the measured number density of red giants, irregular galaxies have fairly sharp boundaries. The implied sizes of the galaxies exceed the sizes in catalogs such as the NASA Extragalactic Database by factors of two to three.
The derived characteristics of irregular galaxies indicate that the erroneous term ”irregular” is no more than a remnant of earlier work, since all these galaxies have a regular axially symmetrical structure; i.e., they are all low-mass disk galaxies. Moreover, there is no demarcation boundary between the morphologies of the stellar structures of irregular and spiral galaxies. They are all disk galaxies, and differ only in their masses, which leads over the time scale for their evolution to differing forms and appearances, such as evidence spiral structure.
ACKNOWLEDGMENTS This work was supported by the Russian Foundation for Basic Research (project no. 03–02–16344), and made use of the NASA/IPAC Extragalactic Database.
REFERENCES
1. N. Tikhonov, Astron. Zh. 82, 1 (2005) [Astron. Rep. 49, 501 (2005)].
2. I. Karachentsev, V. Karachentseva, W. Huchtmeier, et al., Astron. J. 127, 2031 (2004).
3. P. Stetson, User Manual for DAOPHOT II (1994).
4. A. Dolphin, Publ. Astron. Soc. Pac. 112, 1383 (2000).
5. J. Holtzman, J. Hester, S. Casertano, et al., Publ. Astron. Soc. Pac. 107, 156 (1995).
6. J. Holtzman, C. Burrows, S. Casertano, et al., Publ. Astron. Soc. Pac. 107, 1065 (1995).
7. M. Lee, W. Freedman, and B. Madore, Astrophys. J. 417, 553 (1993).
8. D. Schlegel, D. Finkbeiner, and M. Davis, Astrophys. J. 500, 523 (1998).
9. I. Drozdovsky, N. Tikhonov, and R. Schulte-Ladbeck, Rev. Mex. Astron. Astrofis. 17, 46 (2003).
10. N. Tikhonov, O. Galazutdinova, and I. Drozdovsky, Mon. Not. R. Astron. Soc. (2005, in press).
11. N. Tikhonov, O. Galazutdinova, and I. Drozdovsky, Astron. Astrophys. 431, 127 (2005).
12. N. Tikhonov and O. Galazutdinova, Astrophys. 48, 221 (2005); astro-ph/0503235 (2005).
13. D. Minniti and A. Zijlstra, Astrophys. J. Lett. 467, L13 (1996).
14. D. Minniti, A. Zijlstra, and M. Alonso, Astron. J. 117, 881 (1999).
15. S. Demers, P. Battinelli, and B. Letarte, Astron. Astrophys. 410, 795 (2003).
16. B. Letarte, S. Demers, P. Battinelli, and W. Kunkel, Astron. J. 123, 832 (2002).
17. R. Lynds, E. Tolstoy, E. J. O’Neil, and D. Hunter, Astron. J. 116, 146 (1998).
18. A. Aparicio and N. Tikhonov, Astron. J. 119, 2183 (2000).
19. V. Vansevicius, N. Arimoto, T. Hasegava, et al., Astrophys. J. Lett. 611, L93 (2004).