Also at ]Institut für Physik, Humboldt-Universität zu Berlin, Newtonstr. 15, D 12489 Berlin, Germany Also at ]European Associated Laboratory for Gamma-Ray Astronomy, jointly supported by CNRS and MPG Also at ]Landessternwarte, Königstuhl, D 69117 Heidelberg, Germany Also at ]Institut für Astronomie und Astrophysik, Universität Tübingen, Sand 1, 72076 Tübingen, Germany Also at ]Max-Planck-Institut für Kernphysik, P.O. Box 103980, D 69029 Heidelberg, Germany Now at ]Purdue University, Department of Physics, 525 Northwestern Avenue, West Lafayette, IN 47907-2036, USA Also at ]European Associated Laboratory for Gamma-Ray Astronomy, jointly supported by CNRS and MPG Also at ]European Associated Laboratory for Gamma-Ray Astronomy, jointly supported by CNRS and MPG Also at ]DAPNIA/DSM/CEA, CE Saclay, F-91191 Gif-sur-Yvette, Cedex, France Also at ]European Associated Laboratory for Gamma-Ray Astronomy, jointly supported by CNRS and MPG H.E.S.S. collaboration
H.E.S.S. observations of the Galactic Center region
and their possible dark matter interpretation
Abstract
The detection of -rays from the source HESS J1745290 in the Galactic Center (GC) region with the H.E.S.S. array of Cherenkov telescopes in 2004 is presented. After subtraction of the diffuse -ray emission from the GC ridge, the source is compatible with a point-source with spatial extent less than (95% CL). The measured energy spectrum above 160 GeV is compatible with a power-law with photon index of and no significant flux variation is detected. It is finally found that the bulk of the VHE emission must have non-dark-matter origin.
pacs:
98.70.Rz,98.35.Jk,95.35.+dI Introduction
Recently, the CANGAROO cangaroo , VERITAS veritas , H.E.S.S. hess and MAGIC magic collaborations have reported the detection of very high energy (VHE) -rays in the TeV energy range from the direction of the Galactic Center (GC). The nature of this source is still unknown. The main astrophysical explanations are based on particle acceleration in the region of the Sgr A East supernova remnant melia , in the vicinity of the supermassive black hole Sgr A∗ located at the center of our galaxy aharonian ; dermer , or in a recently detected plerion wang . Another widely discussed possibility concerns -ray emission from annihilation of dark matter (DM) particles dmreview .
Cosmological simulations of hierarchical structure formation dm_simulation1 ; dm_simulation2 predict that the DM particles form large scale structures in the Universe, and especially halos with a pronounced density cusp located at their center. Galaxies are predicted to be embedded in such DM halos. Particle physics and cosmology experiments constrain some characteristics of the new particles bertone : the new particles should be massive ( some GeV) and have weak interactions with ordinary matter of the order of the electro-weak cross sections.
Extensions of the standard model of particle physics provide new particle candidates
consistent with cosmological DM and are of main interest to solve both issues.
These models include supersymmetric theories
(e.g. MSSM111MSSM: Minimal Supersymmetric Standard Model. ellis
or AMSB222AMSB: Anomaly Mediated Supersymmetry Breaking.amsb )
or Kaluza-Klein (KK) scenarios with extra-dimensions servant .
All DM particle candidates have some common properties that can be used
to detect them indirectly, since their annihilation may give rise to -rays,
but also to neutrinos and cosmic-rays.
Their annihilation rate is proportional to the square density of DM.
It is thus enhanced in the dense DM regions at the center of DM halos.
Cuspy halos may therefore provide detectable fluxes
of VHE -rays (see bertone and references therein).
The centers of galaxies are indeed good candidates for indirect DM detection,
the closest candidate being the center of the Milky Way.
The -ray energy spectrum generated by DM annihilation is characterized by
a continuum ranging up to the mass of the DM particle,
and possibly faint -ray lines provided by two-body final
states dmreview ; ellis .
For annihilation of DM particles of mass accumulated in a spherical halo of mass density profile and particle density profile , the -ray flux is proportional to the line-of-sight-integrated squared particle density, multiplied by the velocity-weighted annihilation cross section and the number of photons generated per annihilation event darksusy . can be factored into a term depending on the halo parameters and a term depending on the particle physics model:
with . denotes the average of over the solid angle corresponding to the angular resolution of the instrument, normalized to the local DM density :
The shape of the measured -ray spectrum depends only on the particle properties,
embedded in the term , and especially on the -ray multiplicity .
The measured angular distribution of the -rays depends only on
.
The overall -ray flux depends on both terms.
Close to the GC, halo density profiles are predicted
to follow a power-law
with between 1 dm_simulation1 and 1.5 dm_simulation2 .
Recent N-body simulations dm_simulation3 suggest that
could monotonically decrease to zero towards the GC.
Values of lower than lead to an angular distribution
broader than the H.E.S.S. angular resolution and can thus be constrained.
In this letter, we present results on VHE -rays from the GC based on a dataset collected in 2004 with the complete H.E.S.S. array of imaging atmospheric Cherenkov telescopes (IACTs).
II The H.E.S.S. telescopes and the Galactic Center data set
H.E.S.S. is a system of four IACTs (see Crab and references therein) located in Namibia, close to the Tropic of Capricorn. The telescopes stand at the corners of a square of 120 m side. The Cherenkov light emitted by -induced air showers is imaged onto cameras of 960 photomultipliers, covering a field of view of in diameter. The large mirror area of 107 m2 per telescope results in an energy threshold of 100 GeV at Zenith Crab 333The energy threshold is defined as the peak of the differential reconstructed energy distribution for a -ray source with a power-law energy spectrum with photon index 2.6.. The stereoscopic imaging of air showers allows the precise reconstruction of the direction and energy of the -rays.
The previously published H.E.S.S. results on the GC hess were based on 17 h of data recorded with the first two telescopes in 2003. Here, we report on results obtained with the full four-telescope array, using 48.7 h (live time) of data collected between March 30th and September 4th, 2004. The full array provides higher detection rates than the 2003 data, as well as improved background rejection and angular resolution. The bulk of the data (33.5 h) were obtained in “wobble mode”, where the source region is displaced by typically from the optical axis of the system. An additional 15.2 h dataset was obtained from the Galactic plane survey galacticsurvey , within of Sgr A*.
Two different techniques for calibration and image analysis were applied Crab ; model and give identical results. Both methods provide a typical energy resolution of 15% and an angular resolution of above the analysis energy threshold. The results described in this paper are derived using the second technique.
III TeV -rays from the direction of the Galactic Center
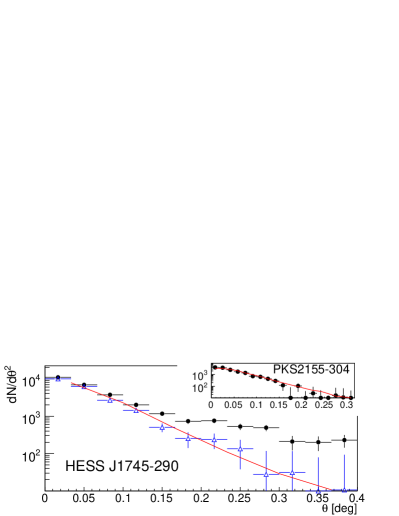
The data show an excess of 1863 -events from HESS J1745290 within from the GC (see Fig. 1 444 From a excess distribution, the y-values have been divided by ( being the bin center).). This excess is detected on top of a hadronic background of 1698 events, with a significance of 37.9 standard deviation above background, calculated according to lima .
Diffuse -ray emission extended along the galactic plane has been discovered in these data and was reported elsewhere GCdiffuse . It was shown that this emission likely originates in cosmic-ray interactions with giant molecular clouds and is thus proportional to the density of cosmic-rays and of target material. To study the shape and position of HESS J1745290, the diffuse emission has been modeled assuming a perfect correlation with the molecular cloud density from CS data Tsuboi . Cosmic-ray density was assumed to have a Gaussian dependence on distance to the GC with scale . The resulting emission model has been smeared with the H.E.S.S. PSF (point spread function, approximately Gaussian with a 68% containment radius of ). The H.E.S.S. central source has been fitted as a superposition of the diffuse component and either a point-like source, a Gaussian source or a DM halo shape. Likelihood fits of these different models to the -ray count-map within a radius of of Sgr A∗ were made with the flux normalisation of the diffuse emission model as a free parameter. Assuming a point source for HESS J1745290, folded with the H.E.S.S. PSF, the best fit location of the source is (, ) in Galactic coordinates or (, ) in equatorial coordinates (J2000.0), within from the putative supermassive black hole Sgr A∗. Improvements in the pointing accuracy may allow the systematic errors to be reduced in the future. No remaining contribution is found in the -ray map after subtraction of the fitted emission, indicating that this model is consistent with the data. The distribution of the angle between the -ray direction and the position of Sgr A* after subtraction of the fitted diffuse emission is shown in Fig. 1 and is consistent with the H.E.S.S. PSF. The diffuse emission is found to contribute to 16% of the total signal of HESS J1745290 within . Assuming a azimuthally symmetric Gaussian brightness distribution centered on the best fit position given above, folded by the H.E.S.S. PSF, an upper limit on the source size of 1.2’ (95% CL) was derived (including statistical errors only).
The compatibility of the spatial extension of HESS J1745290 with a DM halo centered on Sgr A* and with density following was also tested. Different values of the logarithmic slope were assumed. The diffuse component and the DM halo were both folded with the H.E.S.S. PSF. Leaving both normalisations free, the fit likelihood is compared to the point-like source hypothesis discussed above in order to derive a lower limit on the slope of 1.2 (95% CL).
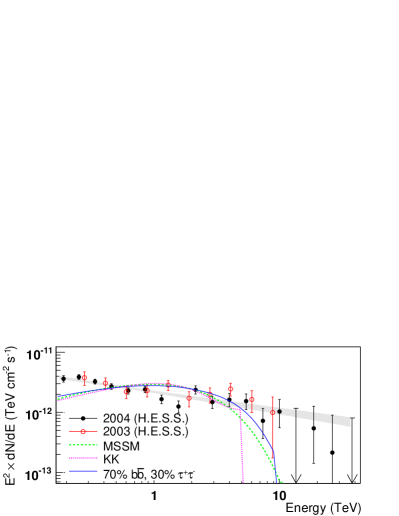
The spectral energy distribution (SED) of -rays of the GC source is determined using an integration radius and assuming a point source. As the flux contamination of the diffuse emission (16%) is of the same order as flux systematic errors, it is not subtracted in this analysis. Moreover, as the shape of the diffuse emission spectrum is compatible with that of the central source GCdiffuse , the measured spectral shape is not altered. The SED is shown in Fig. 2 (together with the spectrum derived from the H.E.S.S. 2003 data). Although a -ray excess is seen at energies as low as 100 GeV, the spectrum shown is calculated only above 160 GeV to eliminate systematic errors arising from an energy reconstruction bias close to threshold. Over the energy range the energy spectrum can be characterized by a power-law, with (with a fit probability of 39%). The 2003 and 2004 spectra are consistent in shape and normalization, with an integral flux above 1 TeV of cm-2s-1. There is no evidence for a cut-off in the spectrum and lower limits at 95% CL of 9 TeV and 7 TeV are derived assuming an exponential cut-off and a sharp cut-off 555 above the cut-off energy., respectively. The experimental spectrum has also been fitted as a sum of a free power-law and a monoenergetic -ray line 666The monoenergetic -ray line shape is estimated as the H.E.S.S. energy resolution. Its variation related to the line-energy, zenith angle, and position of the source in the field of view, are taken into account. whose energy and normalisation have been scanned. No indications of line emission are found.
There is no significant variation in flux between 2003 and 2004; data are consistent with a constant flux variability . Searches for variability or flares on time scales down to 10 min did not show statistically significant deviations from the mean flux. We note that approximately 20 min of data are required for a standard deviation detection of the source above background. A flare lasting for 10 min (30 min, 3 h, respectively) and with a 7-fold (4-fold, 2-fold, respectively) increase over the quiescent flux would be detected at the 99% CL. Data were also analyzed for periodic or quasi-periodic variations on scales between 1 mHz and 16 Hz, using the Lomb-Scargle method LombScargle . Again, no statistically significant periodicity was found. However, if the VHE emission is associated with Sgr A∗ and given its typical rate of X-ray flares of 1.2 per 24 h Chandra , the 48.7 h of H.E.S.S. data may simply not contain a flare event.
IV Dark-matter interpretation
The location of the TeV -ray signal and its temporal stability are consistent with a DM annihilation signal from a halo centered Sgr A∗.
In a first step, it is assumed that all -rays from HESS J1745-290 are due to DM annihilations. The hypothetical DM halo centered on Sgr A* was found in the previous section to be very cuspy, with a logarithmic slope higher than 1.2. This value is consistent with the DM halo shapes predicted by some structure formation simulations. The energy spectrum provides another crucial test concerning a possible DM origin for the detected VHE emission. The extension of the spectrum beyond 10 TeV requires masses of DM particles which are uncomfortably large MSSM. The annihilation spectra of phenomenological MSSM neutralinos depend on the gaugino/higgsino mixing, but all exhibit a curved spectrum, which in a representation rises for , plateaus at , and falls off approaching . AMSB models lead to similar spectra. Such a spectral shape is inconsistent with the measured power-law as seen in Fig. 2. H.E.S.S. data from 2003, with restricted energy range and lower statistics, were still marginally consistent with DM spectra astroph0408192 , but it appears impossible to generate a power-law extending over two decades from the quark and gluon fragmentation spectra of neutralino decays, also considering radiative effects bergstrom . As an alternative scenario, mixed , final states have been proposed Profumo , with DM masses in the TeV range, generating a flatter spectrum. Non-minimal SUSY models can be constructed which allow such decay branching ratios, combined with neutralino masses of tens of TeV. KK DM discussed in astroph0410359 also give harder spectra. PYTHIA 6.225pythia was used to compute the contributions from all annihilation channels 777 Comparison of different versions of PYTHIA has shown that there are systematic uncertainties of the order of 10% in the fluxes and the spectral shapes.. However, all the tested model spectra still deviate significantly from the observed power-law spectrum as shown in Fig. 2.
On the other hand, if the bulk of the VHE emission has non-DM origin,
there is still the possibility of a DM signal
hidden under an astrophysical spectrum.To search for such a contribution,
we fitted the experimental spectrum as the sum of a power-law with free
normalization and index, and a MSSM (or KK) spectrum. Leaving the normalisation
of the DM signal free, the range of is scanned.
For the MSSM, annihilation spectra
are used with three different sets of parameters,
one approximating the average annihilation spectrum ()
the other two ( and )
roughly encompassing the range of model spectra generated using Dark Susy darksusy
888DarkSUSY version 4.1..
No significant DM component is detected with this procedure,
the DM component flux upper limit being of the order of 10% of the source flux.
Assuming a NFW profile,
99% CL upper limits on the velocity-weighted annihilation cross section
are of the order of ,
above the predicted values of the order of .
These limits can vary by plus or minus three orders of magnitude if one assumes
other DM halo shapes.
In the case of adiabatic compression of DM due to the infall of baryons to the GC,
the flux could be boosted up to a factor Prada2004 .
The H.E.S.S. data might then start to exclude some values.
In conclusion, the power-law energy spectrum of the source HESS J1745-290 measured using the H.E.S.S. telescopes show that the observed VHE -ray emission is not compatible with the most conventional DM particle annihilation scenarios. It is thus likely that the bulk of the emission is provided by astrophysical non-DM processes. However, due to high density of candidate objects for non-thermal emission within the source region the nature of the source is not clear.
References
- (1) K. Tsuchiya et al. (CANGAROO Collaboration), ApJ 606, L115 (2004).
- (2) K. Kosack et al. (VERITAS Collaboration), ApJ 608, L97 (2004).
- (3) F. Aharonian et al.(HESS Collaboration), A&A 425, L13 (2004).
- (4) J. Albert et al. (MAGIC Collaboration), ApJ 638, L101 (2006).
- (5) R.M. Crocker et al., ApJ 622, 892 (2005).
- (6) F. Aharonian & A. Neronov, ApJ 619, 306 (2005).
- (7) A. Atoyan & C.D. Dermer, ApJ 617, L123 (2004).
- (8) Q.D. Wang, MNRAS 367, 937 (2006).
- (9) L. Bergström, Rep. Prog. Phys. 63, 793 (2000).
- (10) J.F. Navarro, C.S. Frenk & S.D.M. White, ApJ 490, 493 (1997).
- (11) B. Moore et al., MNRAS 310, 1147 (1999).
- (12) G. Bertone, D. Hooper & J. Silk, Phys. Rep. 405, 279 (2005).
- (13) J. Ellis et al., Eur. Phys. J. C24, 311 (2002).
- (14) S. Profumo & P. Ullio, JCAP 07, 006 (2004).
- (15) G. Servant & T.M. Tait, Nucl. Phys. B650, 391 (2003).
- (16) P. Gondolo et al., JCAP 07, 008 (2004).
- (17) J.F. Navarro et al., MNRAS 355, 794 (2004).
- (18) F. Aharonian et al., Astron. Astrophys. 457, 899 (2006).
- (19) F. Aharonian et al., Science 307, 1938 (2005).
- (20) L. Rolland & M. de Naurois, AIP Conf. Proc. 745, 715 (2004).
- (21) T. Li & Y. Ma, ApJ 272, 317 (1983).
- (22) F. Aharonian et al., Nature 439, 695 (2006).
- (23) M. Tsuboi, et al., ApJS 120, 1 (1999).
- (24) F. Aharonian et al., Astron. Astrophys. 442, 895 (2005).
- (25) L. Rolland et al., Proc. 29th ICRC, Pune (2005).
- (26) J.D. Scargle, ApJ 343, 874 (1989).
- (27) M.P. Muno et al., ApJ 589, 225 (2003).
- (28) D. Horns, Phys. Lett. B607, 225 (2005).
- (29) L. Bergström et al., Phys. Rev. Lett. 95, 241301 (2005).
- (30) S. Profumo, Phys. Rev. D72, 10352 (2005).
- (31) L. Bergström et al., Phys. Rev. Lett. 94, 131301 (2005).
- (32) T. Sjöstrand et al., Computer Phys. Commun. 135, 238 (2001).
- (33) F. Prada et al., Phys. Rev. Lett. 93, 241301 (2004).