Stellar Structure of Irregular Galaxies. I. Face-on Galaxies
N. A. Tikhonov
Special Astrophysical Observatory, Russian Academy of Sciences, Nizhnii Arkhyz, Karachai-Cherkessian Republic, 357147 Russia
Received January 29, 2004; in final form, February 17, 2005
Abstract
Stellar photometry of nearby irregular galaxies of the Local Group is used to identify and study the young and old stellar populations of these galaxies. An analysis of the spatial distributions of stars of different ages in face-on galaxies shows that the young stellar populations in irregular galaxies are concentrated toward the center, and form local inhomogeneities in star-forming regions, while the old stellar populations–red giants–form extended structures around the irregular galaxies. The sizes of these structures exceed the visible sizes of the galaxies at the 25m/arcsec2 isophote by a factor of two to three. The surface density of the red giants decreases exponentially from the center toward the edge, similar to the disk components in spiral galaxies.
1 INTRODUCTION
Dwarf irregular galaxies are the most numerous of all observed galaxies. Their absolute luminosities lie in the interval from to . Such galaxies usually have higher hydrogen contents than other types of dwarf galaxies, and are host to sometimes very intense star-forming processes. A very energetic burst of star formation may promote a galaxy to the class of blue compact dwarf galaxies. Many bright irregular galaxies exhibit signs of weak spiral arms, which are especially prominent in the distribution of neutral hydrogen, as is the case, e.g., in HoII [1] and IC 10 [2].
In this paper, we do not study normal spiral galaxies, which have higher masses and rotational velocities than irregular galaxies, although the dividing line between irregular and spiral galaxies is fairly arbitrary.
In his classification [3], Hubble introduced the class of irregular galaxies as a sort of a ”wastebasket” for all the objects that could not be classed as spirals, ellipticals, or lenticulars. As is clear from their name, irregular galaxies have no regular shape. However, much observational data has been collected since the Hubble classification of galaxies was first adopted, and many of the initial views about the morphology and physical parameters of galaxies have evolved.
Hodge and Hitchcock [4] were the first to suggest, based on measurements of the apparent sizes of 131 galaxies, that irregulars may have flattened shapes. Some authors had expressed similar ideas before [3], but produced no corroborative observational evidence. Later, radio observations established that irregular galaxies rotate, thereby putting them together with spiral galaxies in the group of axisymmetric objects. However, the spatial stellar structure of irregular galaxies remained unclear, since their images exhibited chaotically scattered regions of bright young supergiants, while the old stellar populations were detectable only near the telescope limits in Local-Group galaxies.
A new era in the study of galaxies began in the 1980s with the advent of new detectors with high quantum efficiency–CCDs. Surface photometry has established that irregular galaxies show exponential radial brightness decreases [5, 6] similar to those observed for the disk components in spiral galaxies, suggesting a similarity between spiral and irregular galaxies.
Photoelectric color measurements of galaxies of various types show that irregular galaxies become redder toward their edges. This was easy to understand, since it was already known even at the time of Baade [7] that the peripheral regions of irregular galaxies in the Local Group are populated by a considerable number of red giants, which are visible on the Palomar plates. This suggested that other irregular galaxies might have a similar structure. The distribution of red giants in irregular galaxies is often described using the term ”sheet,” introduced by Baade, or ”halo,” used in modern papers. The use of different terms leads to confusion in descriptions of galaxy morphology. Whereas the term ”sheet” means simply a stellar distribution with a low surface-density gradient, ”halo” implies a spherical distribution of stars around the associated galaxies.
We believe that the use of the term ”halo” for irregular galaxies is incorrect, because, as we show below, most irregular galaxies possess only an extended thick disk, which can be mistaken for a halo. Only massive galaxies have a genuine more extended halo in addition to the thick disk.
| N | Name | R.A. (2000.0) Dec. | Type | Size,(arcmin) | Magnitude |
|---|---|---|---|---|---|
| 1 | K52 | 08 23 56.0 71 01 46 | I ? | 1.3 0.7 | 16.5 |
| 2 | DDO53 | 08 34 07.2 66 10 54 | Im | 1.5 1.3 | 14.5 |
| 3 | K73 | 10 52 55.1 69 32 47 | Im | 0.6 0.4 | 14.9 |
| 4 | GR8 | 12 58 40.4 14 13 03 | ImV | 1.1 1.0 | 14.7 |
| 5 | HIPASS1321-31 | 13 21 08.2 31 31 45 | Im | 0.7 0.5 | 17.0 |
| 6 | DEEP1337-33 | 13 37 04.3 33 21 51 | Im | 0.3 0.3 | 16.8 |
| 7 | PGC48111 | 13 37 20.0 28 02 42 | Im | 1.3 1.0 | 15.0 |
| 8 | HIPASS1337-39 | 13 37 26.0 39 53 47 | Im | 0.6 0.5 | 16.1 |
| 9 | UGC8833 | 13 54 48.7 35 50 15 | Im | 0.9 0.8 | 16.5 |
| 10 | DDO187 | 14 15 56.5 23 03 19 | ImV | 1.7 1.3 | 14.4 |
| 11 | DDO190 | 14 24 43.4 44 31 33 | IAm | 1.8 1.8 | 13.2 |
| 12 | UGCA438 | 23 26 27.5 32 23 20 | IBm | 1.5 1.2 | 13.9 |
Deep images have been taken for all galaxies in the Local Group and a few dozen other nearby galaxies. These show both bright, young supergiants and fainter red giants. The spatial distribution of stars of various types has been studied in several irregular galaxies [8–14].
The most detailed of these studies showed that:
(a) The distribution of red giants extends well beyond the 25m/arcsec2 limit commonly used to define the galaxy sizes;
(b) In the few cases when the corresponding measurements were made, the density of red giants was found to decrease exponentially from the center of the galaxy towards the edge, similar to the disk components in spiral galaxies.
Minniti and Zijlstra [8, 12] interpreted the extended distributions of red giants in the galaxies WLM and NGC 3109 as evidence for halos, i.e., spheroidal distributions of stars. However, this conclusion is not justified, since they did not report the measured distribution of red giants along the major axis of the galaxy. Establishing the real spatial distribution of stars requires detailed studies of individual galaxies, and analyses of a representative sample of galaxies are needed to eliminate effects due to features associated with individual galaxies.
2 SELECTION OF OBJECTS AND OBSERVATIONS
Studies of the spatial structures of flat systems require observations of both edge-on and face-on galaxies of the same type. The shapes of edge-on galaxies in the direction can easily be determined, and the disk and halo, if any, identified. Moreover, in such galaxies the boundaries of the distributions of stars of various types are easier to determine, since they are projected onto a small area of sky.
Observations of face-on galaxies can be used to analyze the distribution of stars from the center to the periphery, which is not possible for edge-on galaxies. Thus, joint studies of galaxies viewed at different angles make it possible to study the spatial distributions of the constituent stars. Other criteria used to select our target objects included their rotational velocities ( km s-1), morphological types (Irr, Irr/Sph), distances ( Mpc), and sizes. We used the rotational velocities as a check for their morphological types; i.e., irregular galaxies are known to have relatively low rotational velocities. We compiled a list of galaxies meeting our criteria and cross-identified it with the HST archive. Resolving galaxies beyond the Local Group into stars is difficult for ground-based telescopes, except for the brightest supergiants, whereas this is easy with the high spatial resolution of the HST.
In addition to the images adopted from the archive of the Hubble Space Telescope, we used images of the three irregular Local-Group galaxies IC 10, IC 1613, and Pegasus obtained by us in 1999 with the 6-m telescope of the Special Astrophysical Observatory (SAO). In addition, the galaxies DDO 187, DDO 190, DDO 210, and SagDIG were observed in 1997 with the 2.5-m Nordic Optical Telescope (NOT).
Observations with the SAO 6-m telescope were made with a CCD with a 2.52 field of view for the image scale of 0.137′′/pixel. Observations at the NOT were made with the HiRAC camera equipped with a Loral CCD producing a 3.75 field of view for the image scale of 0.11′′/pixel. The HST field is 2.5′ in size and has an image scale of 0.1′′/pixel. For many galaxies, these fields of view are too small to enable photometry of stars in the entire galaxy, but the required data about the stellar structure can be derived by selecting small galaxies or galaxies with efficiently chosen fields at appropriate locations along the major and minor axes. Our final list included 12 face-on and 12 edge-on galaxies. In addition to the irregular galaxies, we also studied about twenty galaxies of other types, however, those results lie beyond the scope of this paper.
Because of the large amount of observational data analyzed, we restrict our analysis here to the face-on galaxies. The table lists these galaxies and their main parameters, adopted from the NED database. The results for the two additional galaxies IC 10 and IC 1613 can be found in [15, 16].
3 STELLAR PHOTOMETRY
Prior to carrying out photometry of individual stars, we performed a standard preliminary reduction of all the images, including dark-current subtraction, elimination of irregularities of the CCD sensitivity by dividing the image by a flat field taken at dusk, and removal of cosmic-ray traces and ”hot” pixels.
The images obtained from the HST archive did not require this procedure, which was performed automatically when we ordered the images from the archive. We extracted data for the stars and carried out the photometric measurements using the standard DAOPHOT II procedure in the MIDAS package [17]. To translate the instrumental magnitudes into the Kron–Cousins system, we carried out photometric observations of standard stars from the list of Landolt [18] on each night to derive the equations for the translation from the instrumental magnitudes to the system.
The photometric measurements produced a list of coordinates, magnitudes, and accompanying parameters for the stars, which could be used to assess the photometric accuracy and differences of the photometric profiles of the objects studied from a standard stellar profile.
4 MEASUREMENT OF THE SURFACE DENSITY OF STARS
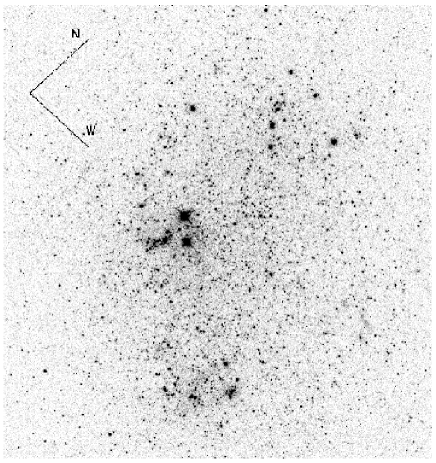
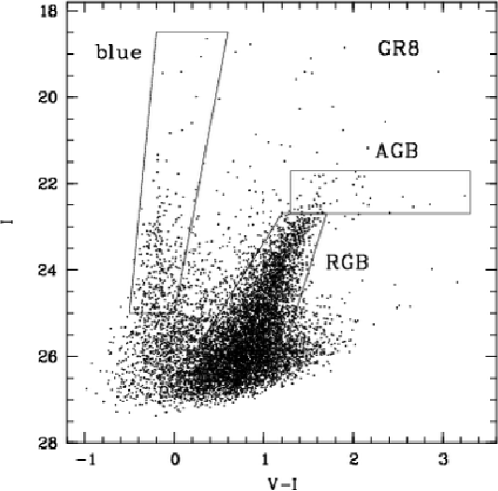
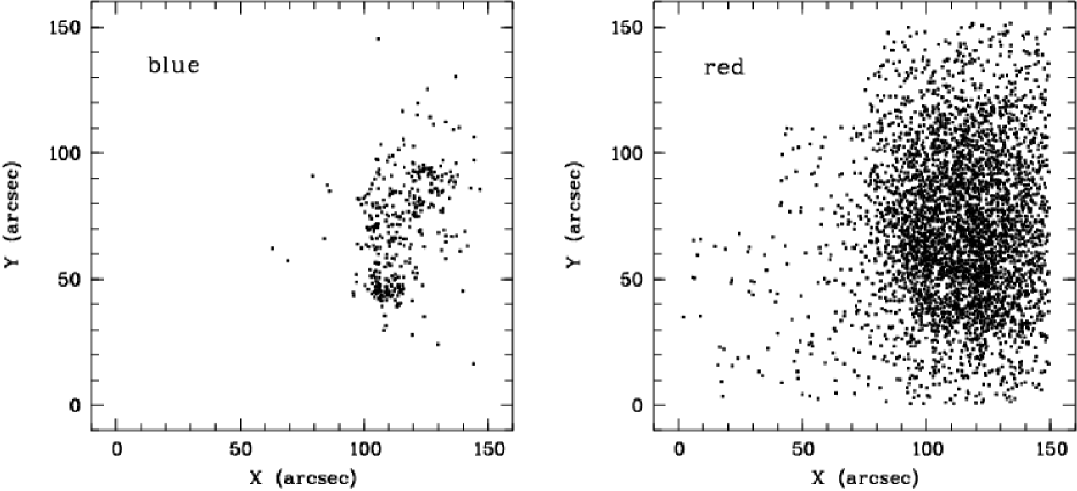
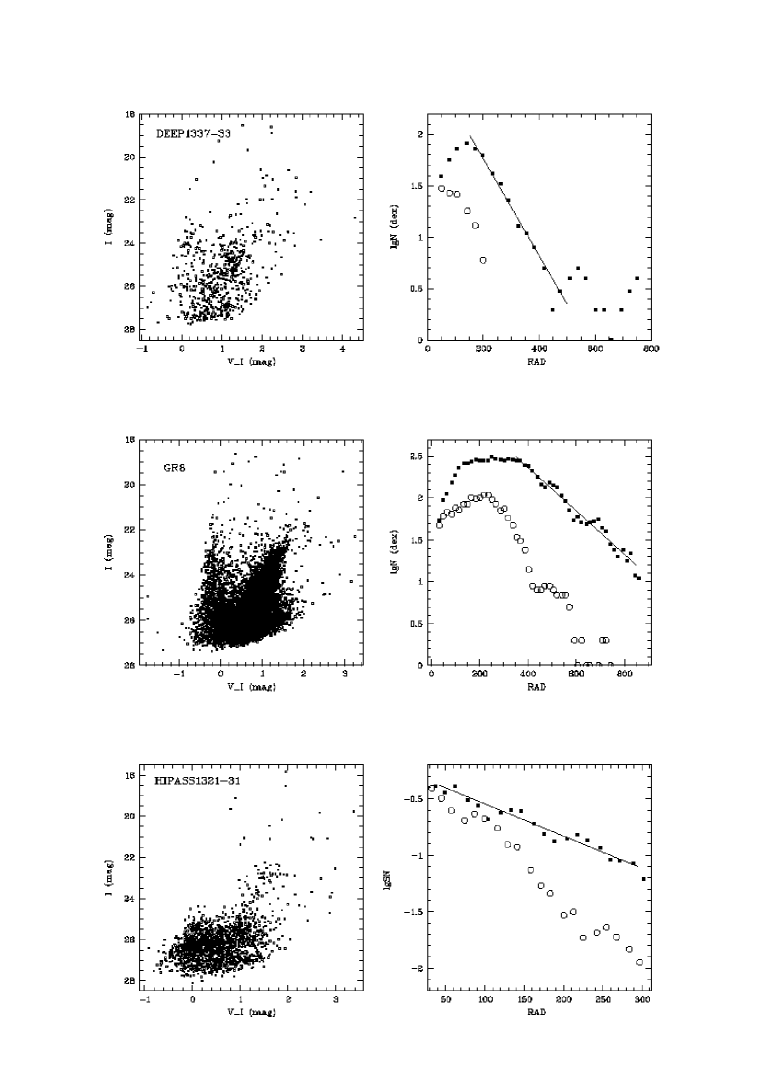
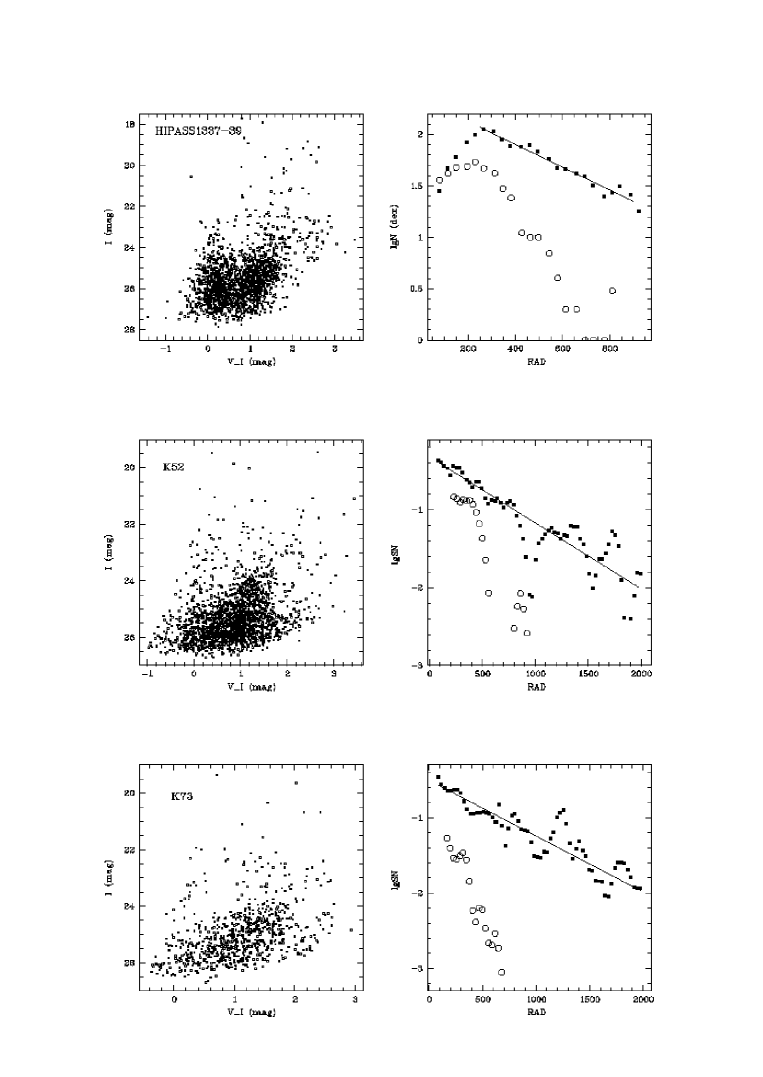
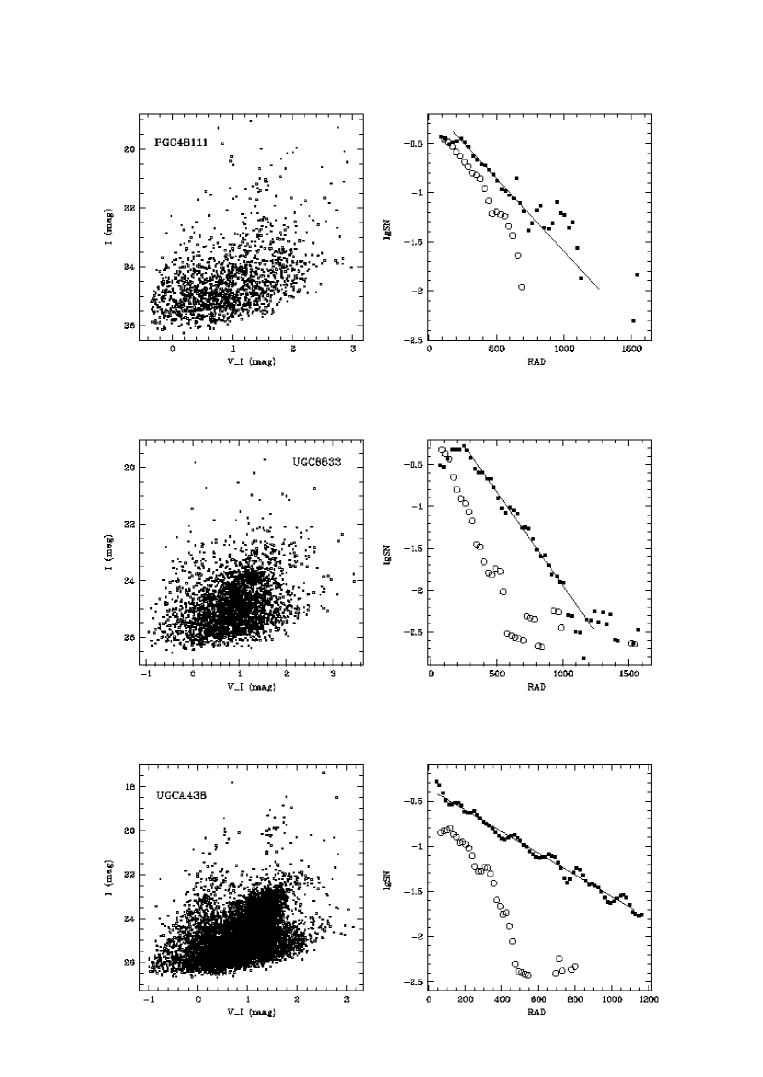
Figure 1 shows GR8, which is a typical irregular galaxy in our list. Figure 2 shows the Hertsprung–Russell diagram for this galaxy based on our stellar photometry, with regions occupied by different stellar types marked. We constructed distributions of various types of stars projected onto the plane of the galaxy (Fig. 3) and calculated the surface density of stars within annuli centered on the galaxy. We made the necessary corrections for the incompleteness of the stellar sample due to the asymmetric distribution of the four chips of the HST field relative to the center of the galaxy.
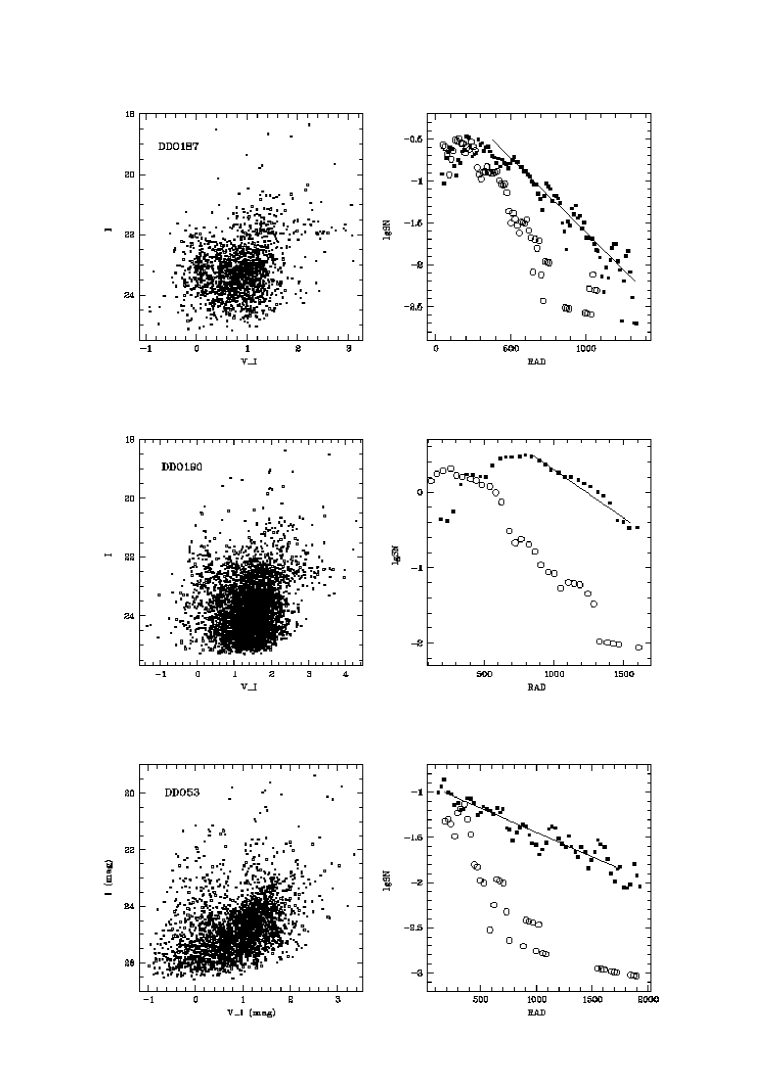
Figure 4 shows the results for the 12 galaxies in the form of plots of the density distributions for young (blue and red supergiants) and old (red giants) stars.
Star-forming processes that produce bright supergiants occur in all irregular galaxies. The presence of bright stars and the nonuniform background brightness distribution in star-forming regions hinder photometry of relatively faint stars, including red giants. As a result, the density of red giants is underestimated in the central regions of galaxies, as can seen in Fig. 4. Another effect that decreases the calculated stellar density in central regions of galaxies is the ”blending” of stellar images due to the extreme crowdedness of the stars in the central regions of galaxies. The DAOPHOT program for stellar photometry removes such images from the list, interpreting them as being nonstellar. This decreases both the completeness of the sample and the calculated surface density of the stars, especially in the central regions of galaxies. We were able to compensate for these effects using the standard procedure of artificial-star photometry. However, the statistical influence of these effects is insignificant for stars at the periphery, and we excluded the parameters of the stellar distributions near the galactic centers when deriving the parameters for the exponential radial decrease of the stellar density.
5 STRUCTURE OF THE IRREGULAR GALAXIES
The results shown in Fig. 4 demonstrate that, despite the seemingly chaotic nature of the distribution of star-forming regions, they are nonetheless appreciably concentrated toward the centers of their galaxies, as can be seen in the density distributions for the young stars. It is obvious from a comparison of the morphologies of galaxies with different masses that the star-forming regions in more massive galaxies begin to be concentrated into spiral-arm type structures, which, however, remain barely distinguishable.
While the young, blue stars are concentrated in star-forming regions, giving the galaxy its irregular appearance, the red giants have a smoother distribution. Their surface-density contours accurately indicate the center of the galaxy, and can be used to estimate its inclination to the line of sight.
In all the galaxies, the red supergiants extend much farther from the center than the blue giants (Fig. 4). The ratio of the sizes of the corresponding spatial structures can reach five (IC 10), but its mean value is 2.5–3.0. The domains occupied by red giants have fairly welldefined boundaries, with very few, mostly foreground, stars seen beyond them. An analysis of the density distribution of red giants in IC 10 revealed a thick disk with a sharp boundary [15]. An even larger structure extending beyond the thick disk has a different density gradient than the thick disk. Thus, this galaxy exhibits a complex structure consisting of a thick disk and halo, similar to the structure of spiral galaxies [19, 20]. IC 10 differs from the other irregular galaxies in our list only in its luminosity (mass), suggesting that it is a galaxy’s mass that determines whether it has a genuine halo. Although the small numbers of such galaxies prevent us from drawing firm conclusions, this observational fact can, nevertheless, be easily explained if there is an overall population of disk galaxies, whose low-mass and high-mass members have come to be known as irregulars and spirals, respectively.
The reality of such a unified scheme is supported by the continuous range of physical parameters for irregular and spiral galaxies. In this case, the presence of a halo around a galaxy is determined only by the mass of the galaxy, and not by its membership in some artificially defined class of irregular or spiral galaxy.
The stars at the peripheries of galaxies have stable orbits, implying that all evolved invisible stars should be located within the boundaries outlined by the current distribution of red giants. In other words, if the dark matter in galaxies consists of the remnants of stellar evolution, the boundaries of the distribution of this matter can be determined by analyzing the distribution of red giants.
6 CONCLUSIONS
Our analysis of the stellar populations in 12 irregular face-on galaxies has led to the following conclusions.
(1) The radial distributions of stars of different types in the galaxy show exponential decreases, similar to the behavior of a disk component.
The rate at which the stellar density in a given galaxy decreases depends on the age of the stars. Younger stars show more rapid density decreases toward the periphery than older stars.
(2) The stellar populations of galaxies have fairly sharp boundaries if these boundaries coincide with the cutoff of the disk formed by red giants.
(3) Our stellar density measurements show that old stars form disks that extend a factor of two to three further than the visible isophotal sizes at 25m/arcsec2.
(4) All these conclusions refer to dwarf galaxies. Our preliminary studies show that massive irregular galaxies may possess a more extended genuine halo, in addition to a thick disk, as is observed in IC 10.
ACKNOWLEDGMENTS This work was supported by the Russian Foundation for Basic Research (project nos. 00–02–16584 and 03–02–16344). Our work has made use of data from the NASA/IPAC Extragalactic Database.
REFERENCES
1. D. Pushe, D. Westphahl, et al., Astron. J. 103, 1841 (1992).
2. E. Wilcots and B. Miller, Astron. J. 116, 2363 (1998).
3. A. Sandage, The Hubble Atlas of Galaxies (Carnegie Inst., Washington, 1961).
4. P. Hodge and J. Hitchcock, Publ. Astron. Soc. Pac. 78, 79 (1966).
5. T. Bremens, B. Bingelli, and P. Prugniel, Astron. Astrophys., Suppl. Ser. 129, 313 (1998).
6. T. Bremens, B. Bingelli, and P. Prugniel, Astron. Astrophys., Suppl. Ser. 137, 337 (1998).
7. W. Baade, Evolution of Stars and Galaxies (Harvard Univ. Press, Cambridge, 1963).
8. D. Minniti and A. Zijlstra, Astron. J. 114, 147 (1997).
9. A. Aparicio, N. Tikhonov, and I. Karachentsev, Astron. J. 119, 177 (2000).
10. R. Lynds, E. Tolstoy, E. J. O’Neil, and D. Hunter, Astron. J. 116, 146 (1998).
11. D. Martinez-Delgado, K. Gallart, and A. Aparicio, Astron. J. 118, 862 (1999).
12. D. Minniti, A. Zijlstra, and V. Alonso, Astron. J. 117, 881 (1999).
13. A. Aparicio and N. Tikhonov, Astron. J. 119, 2183 (2000).
14. B. Letarte, S. Demers, P. Battinelli, and W. Kunkel, Astron. J. 123, 832 (2002).
15. N. A. Tikhonov, Doctoral Dissertation (St. Petersburg, 2002).
16. N. Tikhonov and O. Galazutdinova, Astron. Astrophys. 394, 33 (2002).
17. P. Stetson, Users Manual for DAOPHOTII (1994).
18. A. U. Landolt, Astron. J. 104, 340 (1992).
19. J. Guillandre, J. Lequeux, and L. Loinard, in IAU Symposium No. 192: The Stellar Content of Local Group Galaxies, Ed. by P. Whitelock and R. Cannon (1988), p. 27.
20. N. Tikhonov and O. Galazutdinova, Astron. Astrophys. (2004) (in press). Translated by A. Dambis