Infrared photometry of Cepheids in the LMC clusters NGC 1866 and NGC 2031††thanks: Based on observations collected at the Las Campanas Observatory of the Carnegie Institution of Washington, and at the European Southern Observatory, La Silla, Chile, using SOFI at the 3.5m NTT, within observing program 68.D-0287.
Abstract
Context. Near infrared (IR) studies of Cepheid variables in the LMC take advantage of the reduced light curve amplitude and metallicity dependence at these wavelengths. This work presents such photometry for two young clusters known to contain sizeable Cepheid populations: NGC 1866 and NGC 2031.
Aims. Our goal is to determine light curves and period-luminosity (PL) relations in the near-IR, to assess the similarity between cluster and field pulsators, and to examine the predictive capability of current pulsation models.
Methods. The light curves are obtained from multiwavelength broadband J,H,KS photometry of Cepheids in both clusters, with periods previously established from optical photometry.
Results. Mean magnitudes for the Cepheids are used to construct PL relations in the near-IR. The properties in the PL planes are compared with the behavior of field Cepheids in the LMC and with the predictions of recent pulsational models, both canonical and overluminous.
Conclusions. Cluster and field Cepheids are homogeneous and the inclusion of the cluster Cepheids in the field sample extends nicely the PL relation. The slope of the PL relation is constant over the whole period range and does not show – at least in the adopted IR bands – the break in slope at reported by some authors. A comparison with the predictions of pulsation models allows an estimate for the distance moduli of NGC 1866 and NGC 2031. The two clusters are found to lie at essentially the same distance. Fitting of theoretical models to the data gives, for the K filter, (m-M)0 = 18.620.10 mag if canonical models are used and (m-M)0 = 18.420.10 mag if overluminous models are used. On the basis of this result, some considerations on the relationship between the clusters and the internal structure of the LMC are presented.
Key Words.:
Cepheids - Magellanic Clouds - globular clusters: individual: NGC 1866 - globular clusters: individual: NGC 2031 - Stars: distances1 Introduction
Cepheid variables are one of the cornerstones upon which the extragalactic distance scale is based. Since the pioneering work by Henrietta Leavitt in 1912 (Harvard College Observatory, Circ. No. 173), their importance has grown to the point that they are considered one of the most important distance indicators for galaxies within, and beyond, the Local Group. Recent HST studies have made use of Cepheids to measure the distances of galaxies beyond the Local Group (e.g. the Extragalactic Cepheid project Freedman et al., 2001) and to thereby calibrate a variety of secondary distance indicators. In this regard, the Magellanic Clouds (MCs) — and, in particular, the Large Magellanic Cloud (LMC) — offer a unique laboratory for testing the Cepheid distance scale, being among the closest extragalactic environments with a resolved stellar population. Since LMC Cepheids lie very nearly at the same distance from the Sun, they offer an attractive way of sidestepping the problem of relative distance errors that plague studies of the Period-Luminosity (PL) relation slope using Galactic samples. For these reasons, the LMC has long been an important first step in establishing the Cepheid distance ladder: i.e., the calibration of the period-luminosity (PL) relation in distant galaxies often relies on an assumed LMC distance modulus (DM). For instance, in the Extragalactic Cepheid project, a DM of mag was adopted for the LMC Freedman et al. (2001).
Among the most pressing issues to be considered when dealing with the Cepheid PL relation is its dependence on the metallicity, which has been questioned in a number of past works. From an observational perspective, some authors (e.g. Kennicutt et al., 1998; Sakai et al., 2004; Tammann et al., 2003; Romaniello et al., 2005) argue that such a dependence is indeed present, while others (e.g. Gieren et al., 2005) suggest that any effect is small, perhaps ill-defined (e.g. Groenewegen & Salaris, 2003; Storm et al., 2005). On the theoretical side, some authors again find a mild dependence (if any) from linear nonadiabatic pulsation models (see e.g. Saio & Gautschy, 1998; Alibert et al., 1999), whereas nonlinear convective pulsation models predict a significant dependence on both metal content and helium abundance (see Fiorentino et al., 2002; Marconi et al., 2005, and references therein).
A determination of the PL relation presents different challenges in different wavelength intervals. In the optical bandpasses, the relation shows non-negligible scatter and the use of a color is required to reduce the dispersion (i.e., a Period-Luminosity-Color relation, or PLC). Moreover, the light curve amplitude is large so the measurement of the mean magnitude, on which both the PL and PLC relations are based, requires accurate photometry and well sampled light curves (although the large amplitude allows a better determination of the period because it is less sensitive to small scatter in the measurements). By contrast, the light curve amplitude is much smaller at near-IR wavelengths and the determination of the mean magnitude correspondingly easier. Moreover, the dependence on both the reddening and the color extension of the instability strip is strongly reduced leading to a narrower PL relation than in the optical case. On the other hand, the reduced pulsation amplitude makes the period determination more difficult. In this work, in fact, we make use of periods already available from a variety of literature sources.
Theoretical predictions based on nonlinear convective models confirm the great advantage of using near-IR filters to construct PL relations. As the wavelength increases from optical to near-IR bands, PL relations become linear over the full period range spanned by the observed pulsators and their dependence on metallicity and the instrinsic width of the instability strip decreases significantly (see, e.g. Bono et al., 1999a; Caputo et al., 2000).
In this context, classical Cepheids belonging to young stellar clusters play a particularly relevant role. In fact, not only they are at the same distance but are also characterized by the same age and chemical composition, thus offering a unique opportunity to investigate the uncertainties affecting both empirical approaches and theoretical scenarios. For the present study, we selected two young clusters having the largest known Cepheid population among LMC clusters: NGC 1866 and NGC 2031.
The first is the most massive young cluster in the age range 100–200 Myr. It has been the subject of a very large number of papers in the past, beginning with those by Arp & Thackeray (1967) and Robertson (1974). Subsequent authors focused on studying the cluster either as a testbed of stellar evolution theory (e.g. Brocato et al., 1989; Chiosi et al., 1989; Brocato et al., 1994; Testa et al., 1999; Walker et al., 2001; Barmina et al., 2002; Brocato et al., 2003), as a Cepheid host (Welch et al., 1991; Welch & Stetson, 1993; Gieren et al., 1994; Walker, 1995; Gieren et al., 2000; Storm et al., 2005), or as a dynamical laboratory (Fischer et al., 1992). It has also been the subject of a strong debate over the presence of convective overshooting in intermediate-age stellar models, and on the fraction of binaries on the main sequence. Because the cluster lies in the outskirts of the LMC, field contamination is not severe. NGC 2031, on the other hand, is an order of magnitude smaller in mass and is located in the LMC bar, resulting in a high contamination of its stellar population. As an added complication, the surrounding field has an age comparable to the cluster (as is apparent in the CMD shown in Fig. 1). Despite its large Cepheid population, it has not been extensively studied in the past, except for an analysis of the CMD by Mould et al. (1993) who quote an age of 140 Myr, very close to that of NGC 1866.
The metallicity of NGC 1866 has been estimated by various investigators, with the spectroscopic determination of Hill et al. (2000), confirming the photometric determination of Hilker et al. (1995), . The first — and, to our knowledge, only — spectroscopic determination of the metallicity of NGC 2031 by Dirsch et al. (2000) yielded , indistinguishable from NGC 1866. Moreover, both clusters have a fairly populated AGB that is clearly defined as a narrow sequence in the near-IR CMD (see Fig. 1), and the most luminous stars have been subject of a spectroscopic study (Maceroni et al., 2002) that confirms the evolutionary status of thermally-pulsing AGB stars at the tip of the AGB sequence. Taken together, these properties suggest that NGC 2031 can be considered a low-mass analogue of NGC 1866.
The paper is structured as follows: the observations and reductions are described in Sect. 2; Sect. 3 deals with the presentations of the photometric sample of the Cepheids; in Sect. 4, IR light-curves and PL relations are presented along with a comparison to previous results and to the predictions of theoretical models; we conclude with a summary of our results in Sect. 5.
2 Observations, Reductions and Calibrations
2.1 Observations
Data were collected over four observing runs spanning an interval of nine years. Although the phase sampling is sparse and quite random, we show later that is not a serious issue in the near-IR. The log of observations is given in Table 1. Despite the different telescopes and instrumentation used in this study, the observation strategy was the same for all the runs, following the standard procedure of taking dithered frames of the target to subtract the sky. The field size was 22′ for the first three runs, for which a 2562 pixel NICMOS3 array was employed. When using the 10242 pixels camera SOFI at the ESO-NTT telescope (run #4), the field of view was 55′. In Table 1, columns record the telescopes and instruments used in each run, the total duration of the run, and the number of measurements for each cluster (last column: no. meas.). Note that, despite its five-night length, only a single point for the two clusters was obtained in run #4, as this was a survey program on LMC clusters (see. Mucciarelli et al. (2006)).
| Run Id. | Dates | Site | Tel. | Instr. | pix.sz | field size | no. meas. |
|---|---|---|---|---|---|---|---|
| 1 | 02-08 Dec 1992 | LCO | Swope 1m | IR camera | 0.53′′ | 136 136′′ | 5 |
| 2 | 12-16 Jan 1993 | ESO | MPI 2.2m | IRAC2b | 0.49′′ | 125 125′′ | 3 |
| 3 | 01-08 Nov 1993 | LCO | Swope 1m | IR camera | 0.53′′ | 136 136′′ | 5 |
| 4 | 27-31 Dec 2001 | ESO | NTT | SOFI | 0.29′′ | 295 295′′ | 1 |
2.2 Reductions
In order to check the relative consistency of all the data-sets, two widely used packages have been used to generate object lists and magnitudes, namely DAOPHOT (Stetson, 1987) and DOPHOT (Schechter et al., 1993). The detailed reduction strategy was slightly different for the various runs. For runs #1 and #2, sky flat-fields were taken during evening twilight; for run #3, dome-flats were taken using the ESO-MPI 2.2m telescope dome; and for run #4, dome-flats taken in the ESO-NTT dome were used together with screen-corrected images, as recommended in the SOFI manual. For all runs, dithered images were observed adopting off-source skies, taken some arcminutes away from the cluster center, and subtracting the sky frames to the single cluster images, before reconstructing the final scientific images by re-aligning the dithered source images.
Bad pixel masks were used, whenever possible, by taking advantage of the dithering technique to remove bad pixels from the final images. In practice, this technique did not always work very well, especially for the LCO runs, when the chip had a fairly large number of dead pixels. However, these artifacts yield measurements that were easily identifiable from their large photometric errors.
Photometry was performed with two different packages, in order to check for systematic differences due to the software, a strategy adopted in the HST Cepheid distance scale projectFreedman et al. (2001). It should be noted that these two packages differ fundamentally in approach: DAOPHOT carries out multi-profile PSF fitting on a group of objects whose PSFs interact with each other, while DOPHOT adopts a single-profile fitting starting from the brightest source of the list, then subtracting the measured object from the image and proceeding in order of decreasing brightness.
When running DAOPHOT for all runs, all nights and all groups of three-filters (J, H, KS) observations, a master list of candidates was built by carefully aligning and summing the three images, then running daofind on the summed image. When running DOPHOT, the program was applied to the single images and the output lists cross-checked a-posteriori. However, within the internal fitting error, measurements were fully consistent for high-S/N sources. For fainter sources, differences were found to be somewhat larger, but always within 3 of the (larger) internal error. Calibration errors and aperture correction errors have been added to the internal errors to obtain the total photometric errors.
2.3 Calibrations
During runs #1, #2 and #3, standard stars were observed to obtain a primary calibration of the data. However, although the nights appeared to be photometric, a careful analysis of the calibrating standards revealed some inconsistencies that prevented us from obtaining a well calibrated sample. For this reason a further set of observations was taken during run #4, when conditions were photometric. In order to check the calibration, we cross-checked the output magnitudes against 500 stars from the 2MASS point-source catalog and with the photometry of Mucciarelli et al. (2006), based on the same data, and found the values to be consistent in both cases. The other runs were then transformed to that photometry of run #4 by applying a secondary calibration that, in all cases, consisted of a zero point term and a negligible color term. The magnitudes were then transformed to the LCO system, for consistency with Persson et al. (2004). The relations used were obtained from Carpenter (2001):
3 The Photometric Sample
Photometry lists for all runs and all nights were cross-matched in order to obtain: (1) a master list of the photometry; and (2) for each object, the list of measurements in all the images. In total, we obtained 14 photometric points, that were then averaged with a -clipping rejection algorithm to obtain the final photometry list of each cluster. Cluster Cepheids were then identified and their magnitudes extracted to construct the light curves. Image coordinates were transformed onto the system of run #4, for which an astrometric calibration was obtained from a subset of objects in the 2MASS catalog in common with those from our own catalog. The IR color-magnitude diagrams (CMDs) of NGC 1866 and NGC 2031 have been presented and discussed elsewhere (Mucciarelli et al., 2006), although a preliminary version was published in Maceroni et al. (2002), in order to identify the candidate TP-AGB stars for a spectroscopic study presented in that paper. Here, for the sake of completeness, we show the CMDs for the two clusters in Fig. 1, in which our program Cepheids are identified by the filled squares.

3.1 The Cepheids
The Cepheids for NGC 1866 were selected from the lists of Welch et al. (1991) and Welch & Stetson (1993), using the finding charts in those papers. For NGC 2031, the sample was obtained from Mateo (1992) and from our own unpublished lists. Since our frames covered the central 22′ of the cluster (with the exception of the SOFI field), the outermost Cepheids of NGC 1866 were not included in our IR list, but we identified all the variables in the cluster core. Of the 15 Cepheids of our sample, 8 are confirmed radial velocity members (see Welch et al., 1991). The fact that the outermost variables of NGC 1866 are not part of the presented sample prevents comparisons with some of the best-studied Cepheids, like the ones in Storm et al. (2005) — with which we have only a single object in common (HV 12202) — but the inclusion of the inner variables increases considerably the overall sample. We compared the J and K magnitudes of HV12202 with the values reported in Storm et al. (2005), finding a good agreement. Hence, rather than using single point photometry from run #4 for these objects, we preferred to use the more precise mean values published by Storm et al. (2005).
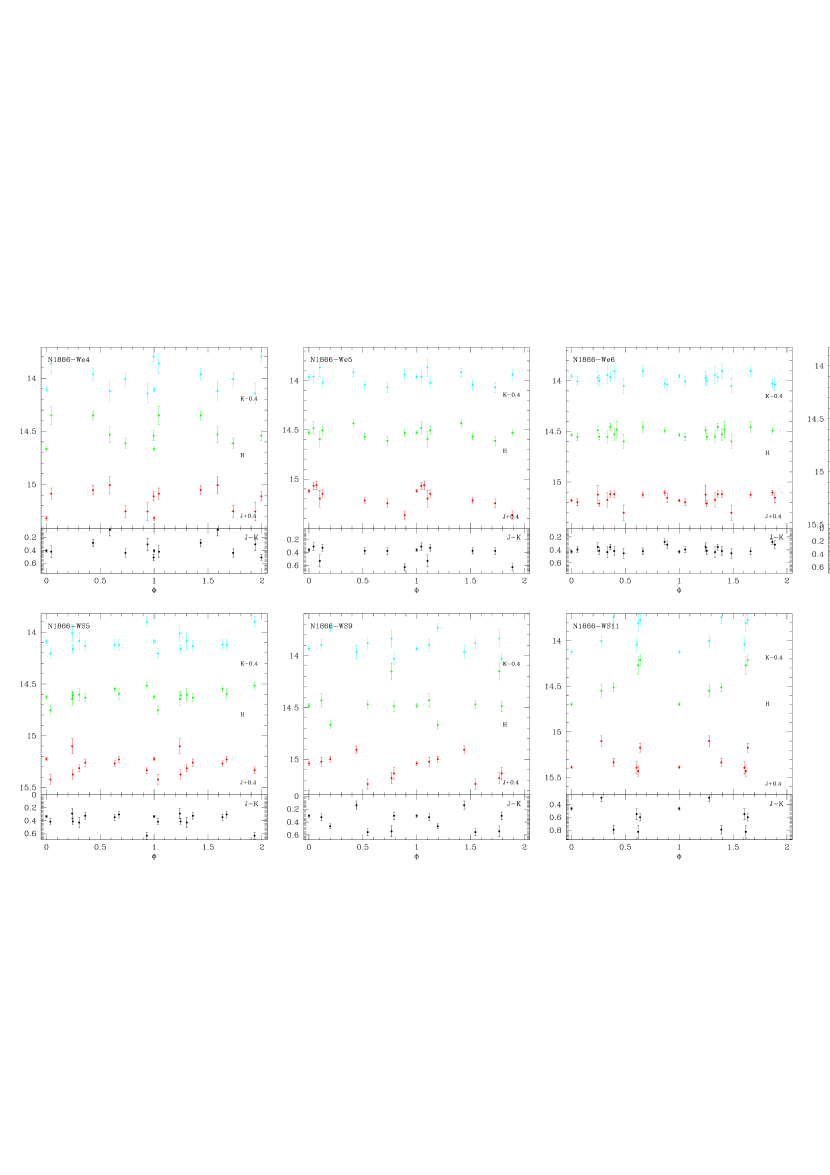
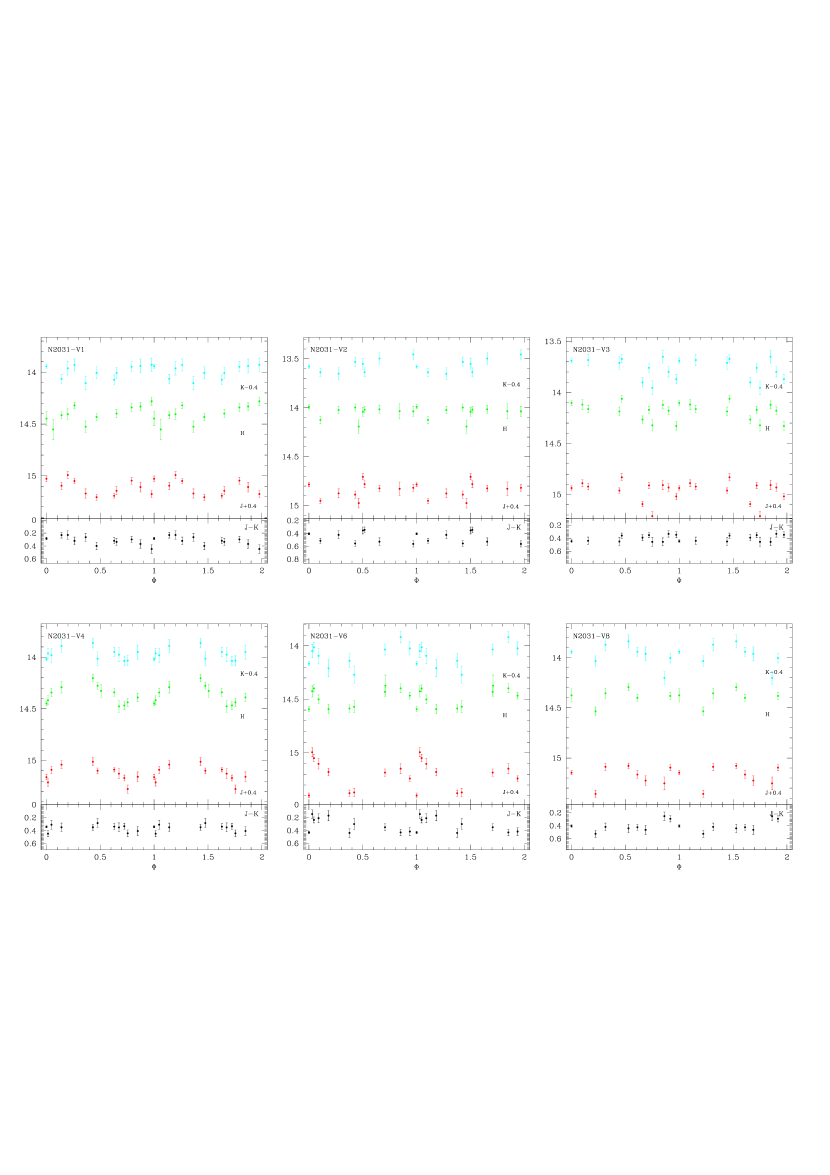
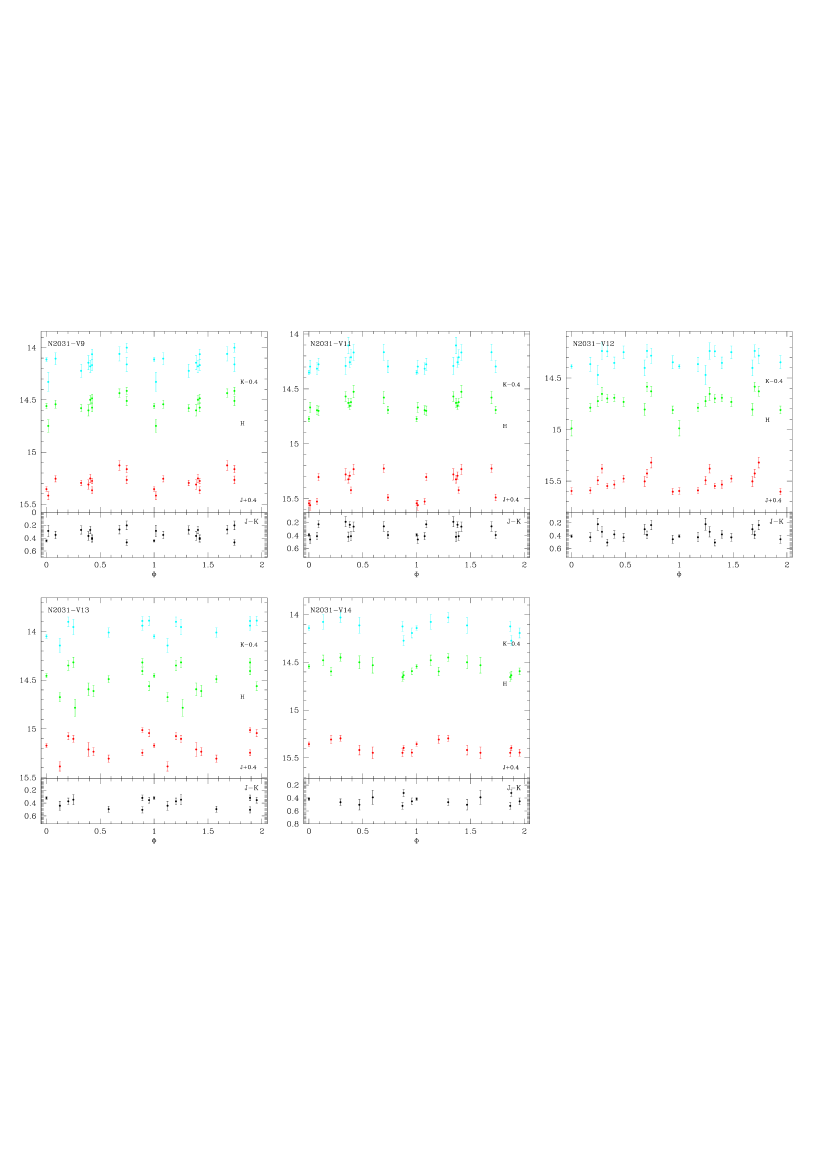
Because NGC 2031 is more compact, all the known objects fall within our fields with the exception of variables V5 and V7 that are not present in the current sample. Their periods are, however, less precisely determined than the ones for NGC 1866. Indeed, as can be seen in Table 3, the periods have a typical precision of 0.01d, which likely explains the overall poorer quality of NGC 2031 light curves.
| Name | P (days) | J | J | H | H | K | K |
|---|---|---|---|---|---|---|---|
| V4 | 3.3157 | 14.77 | 0.05 | 14.51 | 0.03 | 14.37 | 0.04 |
| We8 | 3.043 | 14.86 | 0.07 | 14.67 | 0.05 | 14.51 | 0.06 |
| V6 (ov) | 1.9433 | 14.97 | 0.04 | 14.74 | 0.05 | 14.60 | 0.05 |
| V8 (ov) | 2.0088 | 14.93 | 0.06 | 14.68 | 0.03 | 14.55 | 0.04 |
| V7 | 3.453 | 14.70 | 0.06 | 14.44 | 0.04 | 14.31 | 0.04 |
| HV12200 | 2.7248 | 14.96 | 0.08 | 14.71 | 0.06 | 14.53 | 0.09 |
| HV12202 | 3.10112 | 14.80 | 0.09 | 14.60 | 0.06 | 14.44 | 0.04 |
| We2 | 3.054 | 14.87 | 0.09 | 14.58 | 0.09 | 14.41 | 0.08 |
| We3 | 3.045 | 14.78 | 0.06 | 14.56 | 0.08 | 14.42 | 0.10 |
| We4 | 2.8604 | 14.83 | 0.13 | 14.58 | 0.13 | 14.46 | 0.12 |
| We5 | 3.1763 | 14.75 | 0.08 | 14.53 | 0.05 | 14.38 | 0.10 |
| We6 | 3.289 | 14.76 | 0.04 | 14.52 | 0.04 | 14.37 | 0.04 |
| WS5 | 2.895 | 14.87 | 0.06 | 14.61 | 0.07 | 14.50 | 0.07 |
| WS9 | 3.071 | 14.64 | 0.09 | 14.49 | 0.10 | 14.30 | 0.09 |
| WS11 | 3.0544 | 14.95 | 0.10 | 14.62 | 0.17 | 14.42 | 0.16 |
| Name | P (days) | J | J | H | H | K | K |
|---|---|---|---|---|---|---|---|
| V1 | 3.07 | 14.71 | 0.08 | 14.38 | 0.07 | 14.38 | 0.06 |
| V2 | 4.43 | 14.43 | 0.08 | 14.03 | 0.05 | 13.98 | 0.05 |
| V3 | 3.96 | 14.56 | 0.09 | 14.16 | 0.08 | 14.14 | 0.09 |
| V4 | 3.43 | 14.73 | 0.07 | 14.37 | 0.09 | 14.39 | 0.05 |
| V5 | 3.32 | 14.68 | 0.12 | 14.32 | 0.12 | 14.31 | 0.12 |
| V6 | 3.03 | 14.85 | 0.14 | 14.50 | 0.08 | 14.51 | 0.09 |
| V7 | 3.13 | 14.94 | 0.08 | 14.56 | 0.08 | 14.58 | 0.09 |
| V8 | 3.27 | 14.75 | 0.08 | 14.39 | 0.08 | 14.36 | 0.08 |
| V9 | 2.95 | 14.89 | 0.07 | 14.53 | 0.08 | 14.52 | 0.06 |
| V11 | 2.82 | 15.01 | 0.12 | 14.67 | 0.07 | 14.70 | 0.07 |
| V12 (ov) | 1.84 | 15.12 | 0.08 | 14.73 | 0.09 | 14.74 | 0.07 |
| V13 | 3.20 | 14.75 | 0.11 | 14.47 | 0.11 | 14.40 | 0.08 |
| V14 | 2.97 | 14.97 | 0.05 | 14.56 | 0.06 | 14.54 | 0.06 |
4 Light Curves and PL Relations
4.1 Light Curves and Mean Magnitudes
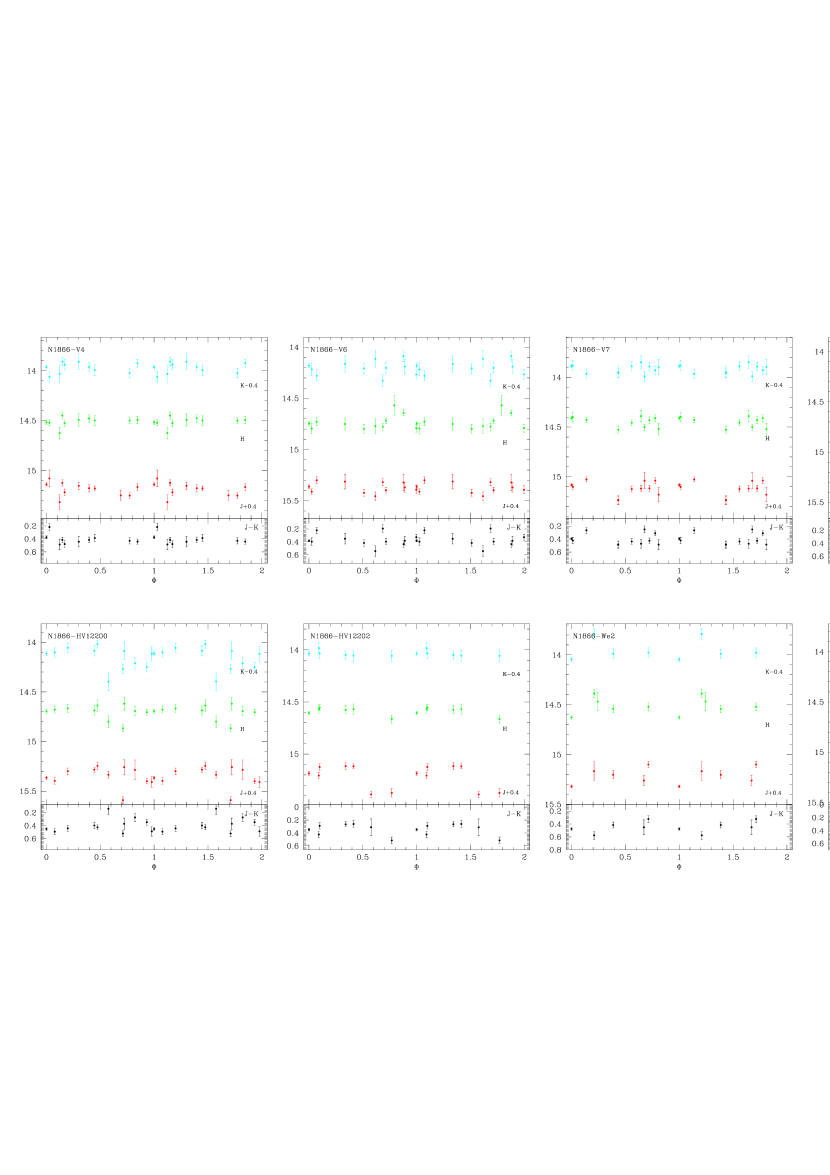
The adopted periods for NGC 1866 are taken from Welch et al. (1991) and Welch & Stetson (1993). For a few Cepheids, periods have been re-determined by Musella et al. (2006) and show no sign of significant changes between the two epochs. The periods of the NGC 2031 Cepheids have been taken from Mateo (1992) and from our own list. We folded the data using the adopted periods obtaining light curves in all the three bands and the color curves in . Light and color curves are shown in Fig. 2 for NGC 1866, and in Fig. 2b for NGC 2031. No shift has been applied to the phases in order to have the zero of the phase as first point, as is usually done, since this has been found to be unimportant for the determination of mean magnitudes. Note that variables V5 and V7 in NGC 2031 have only one measurement and do not appear in the light curve plots. As can be seen in the figures, the sampling is far from optimal and, in some cases, the scatter is relatively large. Nevertheless, the periodic shape is almost always clearly defined, with the exception of a few outliers that usually have larger magnitude errors. For these, we checked the images to verify the presence of glitches or problems and we found that always, in these cases, there was either a problem of crowding, especially in the J filter, combined with a larger FWHM and/or patches of cosmic rays or dead pixels that affected the measurement. In fact, the points that are more scattered around the fiducial light curve are invariably from runs #1 and #3, when the Las Campanas 1m IR camera had poor cosmetic properties (namely a large patch of bad pixels in the right part of the chip). The points with the largest errors have been removed while we kept the others for the determination of the mean megnitude.
As expected, the global amplitude of the oscillations is of the order of a few tenths of magnitude. We calculated mean magnitudes by averaging the data, rather than fitting a template to the light curves. This method is preferred for its higher speed with respect to the classical, more accurate, template curve fitting, because the amplitudes of the Cepheids’ light curves are relatively small and our data provide a sparse but relatively uniform phase coverage. The different uncertainties from variable to variable are mostly due to the scatter along the light curve and to individual nonuniformities in period sampling. Objects having light curves with the poorest sampling suffer from a larger uncertainty in the mean magnitude. Moreover, since the light curve sampling is sparse, fitting to a template light curve does not reduce significantly the error on the mean magnitude. In order to reduce the effect of outliers and obtain a robust estimate, an algorithm based on a biweight location estimate has been used. The biweight location is a robust estimator of the “mean” which uses weights defined as a function of the deviation from the median and calculated in an iterative way. In this context, robustness means that its sensitivity to single outliers is strongly reduced with respect to classic estimators. For a detailed description of the method (see, e.g. Mosteller & Tukey, 1977). The average error on the mean magnitude is of the order of the error on the single measurement and slightly larger than that expected from a template fitting of a well sampled light curve. Table 2 records mean magnitudes in the three bands for 15 Cepheids of NGC 1866. Data for the 13 Cepheids in NGC 2031 are given in Table 3.
4.2 Period-Luminosity Relation
In order to construct PL relations in all the near-IR bands, we first need to adopt values for the cluster reddenings. The case of NGC 1866 has been widely discussed in the past. A value of mag has recently been proposed in Groenewegen & Salaris (2003) from the Wesenheit function, but this value was questioned by Storm et al. (2005) based on an IR surface brightness analysis. We therefore use the canonical value of mag for this cluster (see Storm et al., 2005, and references therein). It should be pointed out that, by adopting , , (see Cardelli et al., 1989), the difference in using one value or the other values is of the order of 0.04 mag in , and 0.02 mag in . By contrast, NGC 2031 lies in a crowded region close to the LMC bar, so its reddening is correspondingly higher. Here we adopt a value of Mould et al. (1993) mag, leading to correction terms of: mag, mag, mag.
Given the small range of periods covered by our program Cepheids, a fit of the PL relation to these objects only is of limited use, due to the large uncertainties on the derived coefficients. As an example, the PL fit in the K band for NGC 1886 gives: .
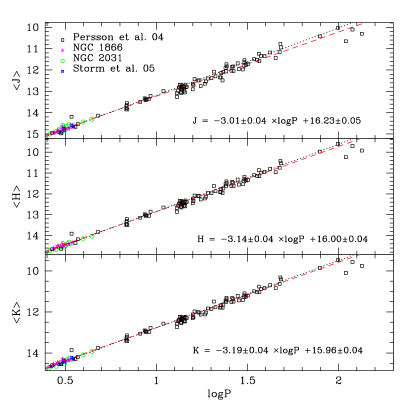
Our sample can instead be used for a comparison with field Cepheids, namely the sample of Persson et al. (2004) in which Cepheids with period shorter than 3 days are absent. This comparison has two goals: (1) to check if the cluster and field Cepheids obey the same relation and, if so, to derive an overall PL relation extending over an enhanced period range; and (2) to check if the break in the slope of the PL relation at about , discussed by Ngeow et al. (2005); Kanbur & Ngeow (2006) is present in our sample. Figure 4 shows PL relations for the sample discussed in this work, the Storm et al. (2005) variables not included in our sample, and the sample of Persson et al. (2004). Cluster Cepheids appear in the plot, as expected, as a extension of the sequence of Persson et al. (2004) and seem to describe the same PL relation, as was previously noted by Storm et al. (2005) (see their Fig. 15).
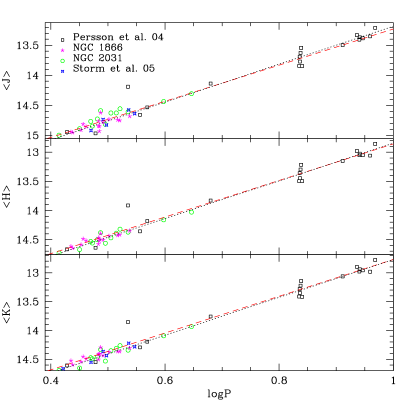
Figure 5 is a magnification of the previous figure at which shows this fact more clearly. Note that two of the variables in the NGC 2031 sample have longer period than the bulk of the cluster Cepheids and are likely field variables. If confirmed, this would provide further evidence that field and cluster Cepheids describe the same relation.
In addition, Keller & Wood (2006) report a mean metallicity of for their field sample, which is quite close to the metallicities of our two target clusters. Of course, the effect of metallicity on the PL relation — if such a dependence does indeed exist — is greatly reduced in the near-IR, especially in the K band. Thus, the fact that our cluster Cepheids extend the tight relation of Persson et al. (2004) toward short periods is perhaps not surprising.
A new fit of the PL relation using the entire sample has been performed in each of the three IR bands, and the results compared with Persson et al. (2004). The output is shown in Fig. 5 as the red dashed line. The derived coefficients (see Fig. 4) are essentially identical to the ones found by Persson et al. (2004).
There is an ongoing debate over possible non-linearities in the PL relation of LMC Cepheids. Ngeow et al. (2005); Kanbur & Ngeow (2006) and Sandage et al. (2004) reported that the PL relation of the LMC Cepheids shows evidence for a change in slope at about days. This effect is most apparent in the optical (i.e, V-, R- and I-band) PL relations, while Ngeow et al. (2005); Kanbur & Ngeow (2006) show that, at least in the J and H bands, it is present also in the IR. On the other hand, Gieren et al. (2005), by using IR surface brightness technique, found a constant slope, in agreement with the trend for Galactic Cepheids. From Figures 4 and 5, it can be seen that the slope looks essentially constant in all the three IR bands. In fact, by adding the short-period cluster Cepheids to the Persson sample, the slope is virtually unchanged, if not slightly flatter than the original Persson fit. Hence, the new fit with the extended period range seems to confirm the hypothesis of constant slope in the LMC Cepheids.
We have also made a comparison with the predicted PL relations from nonlinear convective pulsation models, for metallicities and period ranges appropriate for our sample (see Brocato et al., 2004; Bono et al., 1999b, 2002, and references therein). The theoretical PL relations in J and K have similar values for the slope,
with intrinsic dispersions of 0.15 mag and 0.13 mag, respectively. Comparison of theoretical and observed relations yields an estimate for the DM of LMC: mag for J and mag for K, that is slightly higher than the most recent estimates for the DM of the LMC obtained from comparison with theoretical models (18.54 mag Marconi & Clementini, 2005; Keller & Wood, 2006) or with observational methods (18.52 mag Clementini et al., 2003), (18.56 mag Gieren et al., 2005). In particular, Alves (2004) has reviewed a series of distance measurements, finding an average DM of 18.50 0.02 mag.
The zeropoints of theoretical PL relations depend on both the physical and numerical assumptions required for the construction of the pulsation models. If over the same period range, mildly overluminous pulsation models (see Bono et al., 1999b; Brocato et al., 2004) are adopted instead of the canonical ones (following recent suggestions that Cepheid masses should be smaller than the values predicted on the basis of the canonical evolutionary scenario; see, e.g., Brocato et al. 2004,Caputo et al. 2005), then the theoretical fundamental PL relations become
with an instrinsic dispersion of 0.19 mag and 0.15 mag. By applying these relations to the fundamental Cepheid data for NGC1866 we obtain the mean apparent distance moduli mag in J and mag for K, in better agreement with the short distance scale. Note that these are random errors that include all the observational and theoretical source of random uncertainty but do not take into account possible systematics due to physics used in the models. These include uncertainties arising from the treatment of convection (i.e., the mixing length parameter), the mass-luminosity relation and the atmospheric models used to obtain observed values from theoretical luminosity and temperature. The effect of the equation of state is negligible, and varying the opacity does not produce effects on the models, provided that one uses the most recent compilations ((see Petroni et al., 2003, for a discussion of this dependence). The effects of mixing length is under investigation (Marconi et al., in preparation) and preliminary results indicate that by increasing from 1.5 to 1.8, the PL relation slope becomes slightly steeper. Such a change is expected to have a relatively minor impact on the PL relations derived above.
5 Discussion and Summary
We have presented IR light and color curves for 15 and 13 Cepheids in the young LMC clusters NGC 1866 and NGC 2031, respectively. The light curves are of sufficient quality to derive mean J, H, and KS magnitudes, allowing us to compare our results on cluster Cepheids with the analogous study done on field Cepheids by Persson et al. (2004), with theoretical models by Bono et al. (1999b); Brocato et al. (2004) and, for NGC 1866, with previous studies from the literature.
The good agreement we find with field Cepheids has allowed us to extend the PL relation of Persson et al. (2004) to shorter periods. A redetermination of the PL relation yields slopes that are in agreement with recent theoretical models. To obtain agreement with recent determinations of the LMC DM that give the same value (i.e., ) for both RR Lyrae (Marconi & Clementini, 2005) and with Cepheids (Keller & Wood, 2006) would require overluminous models. In this case, whether the overluminosity is due to convective core overshooting or mass-loss is still a point of active debate.
A comparison of results obtained on NGC 1866 by different authors and different methods shows that some authors favour canonical models with the presence of binaries, while others conclude a certain amount of core overshooting is required. For example, Walker et al. (2001) use MS fitting on HST data to derive a DM of by using the observed Hyades sequence and theoretical models to take into account metallicity differences. Ground-based studies by Testa et al. (1999) and Barmina et al. (2002) used essentially the same data but yielded the opposite conclusion about the overshooting issue. The only point of accordance seem to be the presence of binaries at the tip of the MS. A later redetermination by Salaris et al. (2003) seems to confirm the DM of NGC 1866 found by Walker et al. (2001) and finds that the surrounding field has a longer DM of (i.e., presumably due to the tilt of the LMC intermediate-age disk).
In this work, the PL relations for the two clusters give essentially the same results, indicating that the two clusters have nearly the same DM. The structure of the young LMC — where by “young” we mean the sample of Cepheids analyzed in Persson et al. (2004) — may be described as a tilted disk, (see, e.g., the discussion in Alves, 2004) with the north-east quadrant closer to the Earth, and with some amount of thickness (van der Marel et al., 2002). The fact that the two clusters share essentially the same DM is consistent with NGC 1866 lying behind the disk and at the same distance of the bar where NGC 2031 is located. Although our data cannot solve this important dilemma, it is worth emphasizing some outstanding issues that need to be resolved. Probably the most crucial point is the reddening — a better determination of this important parameter is clearly needed. On the other hand, metallicity has a less dramatic effect, particularly at near-IR wavelengths.
New models have recently made some progress towards resolving the longstanding discrepancy between evolutionary and pulsational masses; in fact, the same models are applied to cluster and field Cepheids. Finally, since the largest uncertainties seem to arise from the current observational material, the ultimate solution to the LMC distance problem will almost certainly require increased samples that include Cepheids in additional LMC clusters.
Acknowledgements.
It’s a pleasure to thank Giuseppe Bono for many useful discussions on this paper. This publication makes use of data products from the Two Micron All Sky Survey, which is a joint project of the University of Massachusetts and the Infrared Processing and Analysis Center/California Institute of Technology, funded by the National Aeronautics and Space Administration and the National Science Foundation. We would like to thank the referee, Dr. W.P. Gieren, for his useful comments and suggestions that greatly improved the paper.References
- Alibert et al. (1999) Alibert, Y., Baraffe, I., Hauschildt, P., & Allard, F. 1999, A&A, 344, 551
- Alves (2004) Alves, D. R. 2004, New Astronomy Review, 48, 659
- Arp & Thackeray (1967) Arp, H. & Thackeray, A. D. 1967, ApJ, 149, 73
- Barmina et al. (2002) Barmina, R., Girardi, L., & Chiosi, C. 2002, A&A, 385, 847
- Bono et al. (1999a) Bono, G., Caputo, F., Castellani, V., & Marconi, M. 1999a, ApJ, 512, 711
- Bono et al. (2002) Bono, G., Castellani, V., & Marconi, M. 2002, ApJ, 565, L83
- Bono et al. (1999b) Bono, G., Marconi, M., & Stellingwerf, R. F. 1999b, ApJS, 122, 167
- Brocato et al. (1989) Brocato, E., Buonanno, R., Castellani, V., & Walker, A. R. 1989, ApJS, 71, 25
- Brocato et al. (2004) Brocato, E., Caputo, F., Castellani, V., Marconi, M., & Musella, I. 2004, AJ, 128, 1597
- Brocato et al. (2003) Brocato, E., Castellani, V., Di Carlo, E., Raimondo, G., & Walker, A. R. 2003, AJ, 125, 3111
- Brocato et al. (1994) Brocato, E., Castellani, V., & Piersimoni, A. M. 1994, A&A, 290, 59
- Caputo et al. (2000) Caputo, F., Marconi, M., & Musella, I. 2000, A&A, 354, 610
- Cardelli et al. (1989) Cardelli, J. A., Clayton, G. C., & Mathis, J. S. 1989, ApJ, 345, 245
- Carpenter (2001) Carpenter, J. M. 2001, AJ, 121, 2851
- Chiosi et al. (1989) Chiosi, C., Bertelli, G., Meylan, G., & Ortolani, S. 1989, A&A, 219, 167
- Clementini et al. (2003) Clementini, G., Gratton, R., Bragaglia, A., et al. 2003, AJ, 125, 1309
- Dirsch et al. (2000) Dirsch, B., Richtler, T., Gieren, W. P., & Hilker, M. 2000, A&A, 360, 133
- Fiorentino et al. (2002) Fiorentino, G., Caputo, F., Marconi, M., & Musella, I. 2002, ApJ, 576, 402
- Fischer et al. (1992) Fischer, P., Welch, D. L., Cote, P., Mateo, M., & Madore, B. F. 1992, AJ, 103, 857
- Freedman et al. (2001) Freedman, W. L., Madore, B. F., Gibson, B. K., et al. 2001, ApJ, 553, 47
- Gieren et al. (2005) Gieren, W., Storm, J., Barnes, III, T. G., et al. 2005, ApJ, 627, 224
- Gieren et al. (2000) Gieren, W. P., Gómez, M., Storm, J., et al. 2000, ApJS, 129, 111
- Gieren et al. (1994) Gieren, W. P., Richtler, T., & Hilker, M. 1994, ApJ, 433, L73
- Groenewegen & Salaris (2003) Groenewegen, M. A. T. & Salaris, M. 2003, A&A, 410, 887
- Hilker et al. (1995) Hilker, M., Richtler, T., & Gieren, W. 1995, A&A, 294, 648
- Hill et al. (2000) Hill, V., François, P., Spite, M., Primas, F., & Spite, F. 2000, A&A, 364, L19
- Kanbur & Ngeow (2006) Kanbur, S. M. & Ngeow, C.-C. 2006, MNRAS, 369, 705
- Keller & Wood (2006) Keller, S. C. & Wood, P. R. 2006, ApJ, 642, 834
- Kennicutt et al. (1998) Kennicutt, Jr., R. C., Stetson, P. B., Saha, A., et al. 1998, ApJ, 498, 181
- Maceroni et al. (2002) Maceroni, C., Testa, V., Plez, B., García Lario, P., & D’Antona, F. 2002, A&A, 395, 179
- Marconi & Clementini (2005) Marconi, M. & Clementini, G. 2005, AJ, 129, 2257
- Marconi et al. (2005) Marconi, M., Musella, I., & Fiorentino, G. 2005, ApJ, 632, 590
- Mateo (1992) Mateo, M. 1992, PASP, 104, 824
- Mosteller & Tukey (1977) Mosteller, F. & Tukey, J. W. 1977, Data analysis and regression. A second course in statistics (Addison-Wesley Series in Behavioral Science: Quantitative Methods, Reading, Mass.: Addison-Wesley, 1977)
- Mould et al. (1993) Mould, J. R., Xystus, D. A., & Da Costa, G. S. 1993, ApJ, 408, 108
- Mucciarelli et al. (2006) Mucciarelli, A., Ferraro, F. R., Origlia, L., Maraston, C., & Testa, V. 2006, ApJ, in press, astro
- Musella et al. (2006) Musella, I., Ripepi, V., Brocato, E., et al. 2006, Memorie della Societa Astronomica Italiana, 77, 291
- Ngeow et al. (2005) Ngeow, C.-C., Kanbur, S. M., Nikolaev, S., et al. 2005, MNRAS, 363, 831
- Persson et al. (2004) Persson, S. E., Madore, B. F., Krzemiński, W., et al. 2004, AJ, 128, 2239
- Petroni et al. (2003) Petroni, S., Bono, G., Marconi, M., & Stellingwerf, R. F. 2003, ApJ, 599, 522
- Robertson (1974) Robertson, J. W. 1974, A&AS, 15, 261
- Romaniello et al. (2005) Romaniello, M., Primas, F., Mottini, M., et al. 2005, A&A, 429, L37
- Saio & Gautschy (1998) Saio, H. & Gautschy, A. 1998, ApJ, 498, 360
- Sakai et al. (2004) Sakai, S., Ferrarese, L., Kennicutt, Jr., R. C., & Saha, A. 2004, ApJ, 608, 42
- Salaris et al. (2003) Salaris, M., Percival, S., Brocato, E., Raimondo, G., & Walker, A. R. 2003, ApJ, 588, 801
- Sandage et al. (2004) Sandage, A., Tammann, G. A., & Reindl, B. 2004, A&A, 424, 43
- Schechter et al. (1993) Schechter, P. L., Mateo, M., & Saha, A. 1993, PASP, 105, 1342
- Stetson (1987) Stetson, P. B. 1987, PASP, 99, 191
- Storm et al. (2005) Storm, J., Gieren, W. P., Fouqué, P., Barnes, T. G., & Gómez, M. 2005, A&A, 440, 487
- Tammann et al. (2003) Tammann, G. A., Sandage, A., & Reindl, B. 2003, A&A, 404, 423
- Testa et al. (1999) Testa, V., Ferraro, F. R., Chieffi, A., et al. 1999, AJ, 118, 2839
- van der Marel et al. (2002) van der Marel, R. P., Alves, D. R., Hardy, E., & Suntzeff, N. B. 2002, AJ, 124, 2639
- Walker (1995) Walker, A. R. 1995, AJ, 110, 638
- Walker et al. (2001) Walker, A. R., Raimondo, G., Di Carlo, E., et al. 2001, ApJ, 560, L139
- Welch et al. (1991) Welch, D. L., Cote, P., Fischer, P., Mateo, M., & Madore, B. F. 1991, AJ, 101, 490
- Welch & Stetson (1993) Welch, D. L. & Stetson, P. B. 1993, AJ, 105, 1813