INAF — Osservatorio Astronomico di Roma, Monteporzio Catone (Roma), Italy \PACSes \PACSit95.55.Kacosmology-observations \PACSit98.70.Rz-ray sources; -ray bursts
Short GRBs: Rates & luminosity function implications
Abstract
We compare the luminosity function and rate inferred from the BATSE short hard bursts (SHBs) peak flux distribution with the redshift and luminosity distributions of SHBs observed by Swift/HETE II. The Swift/HETE II SHB sample is incompatible with SHB population that follows the star formation rate. However, it is compatible with a distribution of delay times after the SFR. This would be the case if SHBs are associated with the mergers of double neutron star (DNS) systems. DNS may be “primordial” or can form dynamically by binary exchange interaction in globular clusters during core collapse. The implied SHB rates that we find range from to Gpc-3yr-1. This rate is a much higher than what was previously estimated and, when beaming is taken into account, it is comparable to the rate of neutron star mergers estimated from statistics of binary pulsars. If GRBs are produced in mergers the implied rate practically guarantees detection by LIGO II and possibly even by LIGO I.
1 Introduction
In 1993 Koveliotou [1] noticed that the GRB distribution can be divided into two subsets of long and short bursts with a dividing duration of 2sec. As short bursts are also harder than long ones [2, 3], they are denoted as Short Hard Bursts (SHBs).
The luminosity function (LF) and rate are fundamental quantities to understand the nature of these objects. Guetta & Piran (2005) (GP05) [4] have shown how these quantities can be constrained by the observed peak flux distribution which is a convolution of these two unknown functions.
Afterglows of SHB have only recently been observed by Swift [5, 6, 7] and this has lead to the first identification of SHB host galaxies and redshift determination. In table 1 we report the redshifts and luminosities of these bursts. As we can see from this table, the average redshift of the short bursts is much smaller than the average z of the long GRBs detected by Swift .
As BATSE is less sensitive to short bursts than to long ones [8], even an intrinsic SHB distribution that follows the star formation rate (SFR) gives rise to an observed distribution that is nearer to us. However the different sensitivity is not enough to explain the different -distribution (-DF) between long and short GRBs [9]. Therefore it is possible that SHBs do not follow SFR as the long bursts and that they are linked to the merger of double neutron star systems (DNS) [10]. In this case the SHB rate is given by the convolution of the star formation rate with the distribution of the merging time delays of the binary system. These delays reflect the time it takes to the system to merge due to emission of gravitational radiation.
A delayed SFR distribution (that is intrinsically nearer) gives rise to an observed distribution that is nearer to us and that can explain the data for some choices of . We consider two formation mechanisms. If two massive stars are born as a binary system, and the system remains bound after the super nova (SN) explosion of both components, a DNS is formed (“primordial” DNS). Another possibility is that at the moment of star formation the neutron stars (NSs) are not in the same binary system, but one of the NSs is in a binary with a low mass main sequence (MS) star. In globular clusters (GCs), such binaries are likely to have an exchange interaction with a single neutron star (see [11] and references within). A significant fraction () of all NS mergers in the Universe may stem from such dynamically formed systems [11].
We show that the predicted -DF is different for the two models, so that future z-observations may determine which formation channel (if any) is dominant.
| GRB | 050509b | 050709 | 050724 | 050813 | 051221 |
|---|---|---|---|---|---|
| z | 0.22 | 0.16 | 0.257 | 0.7 or 1.80 | 0.5465 |
| erg/sec | 0.14 | 1.1 | 0.17 | 1.9 | 3 |
2 The luminosity function of the BATSE SHB sample
Our data set and methodology follow [12, 4, 9]. We consider all the SHBs detected while the BATSE onboard trigger [13] was set for 5.5 over background in at least two detectors in the energy range 50-300keV. These constitute a group of 194 bursts. We assume the functional form of the rate of bursts (but not the amplitude). We then search for a best fit LF. Using this LF we calculate the expected distribution of observed redshifts and we compare it with the present data. We consider the following cosmological rates:
-
•
(i) A rate that follows the SFR (We do not expect that this reflects the rate of SHBs but we include this case for comparison.).
-
•
(ii) A rate that follows the “primordial” DNs merger rate. This rate depends on the formation rate of NS binaries, that one can safely assume follows the SFR, and on the distribution of merging time delays, . This, in turn, depends on the distribution of initial orbital separation between the two stars () and on the distribution of initial eccentricities. Both are unknown. From the coalescence time distribution of six double neutron star binaries [14] it seems that const, implying ,[15]. Therefore, our best guess scenario is a SBH rate that follows the SFR with a logarithmic time delay distribution.
-
•
(iii) A rate that follows the SFR with a delay distribution const.
-
•
(iv) A constant rate (which is independent of redshift).
For the SFR we employ of Porciani & Madau [16]: In models (ii) and (iii) the rate of SHBs is given by:
| (1) |
| Rate(z=0) | ||||||
|---|---|---|---|---|---|---|
| erg/sec | (z=0.7) | (z=1.8) | ||||
| i | ||||||
| ii | 0.05 | 0.06 | ||||
| iiσ | 0.1 | 0.22 | 0.25 | |||
| iii | 0.91 | 0.91 | ||||
| iv | 0.41 | 0.41 |
Following Schmidt [17] (see also [12, 4]) we consider a broken power law peak LF with lower and upper limits, and , with power law indeces, , and luminosity break .
We use [4]. In [9] (denoted GP06 hereafter) we show that both limits are chosen in such a way that a very small fraction (less than 1%) of the observed bursts are outside these range. Hence one cannot infer anything from the observations on the LF in this range. Comparing the predicted distribution with the one observed by BATSE we obtain, the best fit parameters of each model and their standard deviation. The results are shown in table 2 and in figs 1 and 2 of GP06.
3 A Comparison with the current Swift-HETE II SHB sample
We can derive now the expected -DF of the observed bursts’ population in the different models.
We assume that the minimal peak flux for detection for Swift is ph/cm2/sec like BATSE (note the different spectral windows of both detectors which makes Swift relatively less sensitive to short bursts).
Fig.1 (left panel) depicts the expected observed integrated -DF of SHBs in the different models. As expected, a distribution that follows the SFR, (i), is ruled out by a KS test with the current five bursts (%). This is not surprising as other indications, such as the association of some SHBs with elliptical galaxies suggest that SHBs are not associated with young stellar populations.
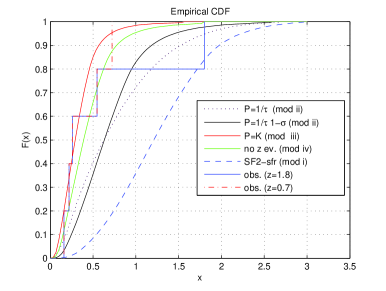
A distribution that follows the SFR with a constant logarithmic delay distribution, (ii), is marginally consistent with the data (%). The observed bursts are nearer (lower redshift) than expected from this distribution. If we use the Rowan-Robinson SFR [4], rather than SF2 of Porciani-Madau, the situation is even more promising % (for either z=0.7 or z-1.8). When we move to a distribution that is 1 away from the best fit distribution we find % and even higher for the RR SFR. Thus the suggestion [18] that the observed sample rules out the NS merger model (with a logarithmic merger time distribution) was somewhat premature. Note however, that the local rate with this model (iiσ) is sixteen times larger than the rate of the best fit model, (ii). This reflects the large flexibility in modeling the peak flux distribution.
To demonstrate the flexibility of the data we have considered two other time delay distributions. A uniform time delay distribution (iii) and an overall constant SHB rate (iv). Both models are compatible with the BATSE SHB distribution and with the sample of SHBs with a known redshift ( 80% and 40% respectively.). This result is not surprising. The BATSE peak flux distribution depends on two unknown functions, the rate and the LF. There is enough freedom to chose one function (the rate) and fit for the other.
In all models compatible with the five bursts with a known redshift, the intrinsic SHB rate is pushed towards lower redshifts. The inferred present rates, , and Gpc-3yr-1 for models (iii), (iv) and (iiσ) respectively, are larger by a factor ten to fifty than those estimates earlier (assuming that SBHs follow the SFR with a logarithmic delay with the best fit parameters GP05). The corresponding “typical” luminosities, , ranges from 0.1 to 0.7 erg/sec.
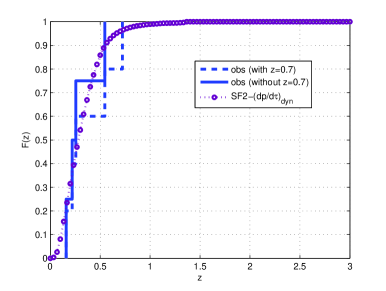
Let us consider now the possibility that short bursts come from dynamically formed DNS [19]. In this case, the delay time is a sum of the time until the dynamical formation of a DNS during core-collapse, and the time until the DNS merges. The resulting delay function of dynamically formed DNSs is given by [19]
| (2) |
The resulting delay function is shown in Fig.2 of [19]. Fig.1 (right panel) shows the comparison between the expected and observed integrates -DF. Our model for dynamical mergers fits the observed SHBs distribution much better () than the model for primordial distribution with () .
4 Conclusions and Implications
We have repeated the analysis of fitting the BATSE SHB data to a model of the luminosities and rates distributions. Our best fit logarithmic distribution model is similar to the best fit logarithmic model presented in GP05. A main new ingredient of this work is the fact that we consider several other models. We confirm our earlier finding that the BATSE data allows a lot of flexibility in the combination of the rates and luminosities.
A second new ingredient of this work is the comparison of the best fit models to the small sample of five Swift/HETE II SHBs. The Swift/HETE II data gives a new constraint. This constraint favors a population of SHBs with a lower intrinsic luminosity and hence a nearer observed -DF. It implies a significantly higher local SHB rate - a factor of ten to fifty higher than earlier estimates. The new observations of Swift show that the SHBs are nearer than what was expected before and therefore, their luminosity is lower and their local rate is higher. We stress that this new result was within the 1 error of the model presented in GP05, which had a very large range of allowed local rates and typical luminosities.
Provided that the basic model is correct and we are not mislead by statistical (small numbers), observational (selection effects and threshold estimates) of intrinsic (two SHB population) factors we can proceed and compare the inferred SHB rate with the observationally inferred rate of NS-NS mergers in our galaxy [20]. This rate was recently reevaluated with the discovery of PSR J0373-3039 to be rather large as /Myr. Although the estimate contains a fair amount of uncertainty [21]. If we assume that this rate is typical and that the number density of galaxies is /Mpc3, we find a merger rate of /Gpc3/yr. Using a beaming factor of 30-50 for short bursts [7] this rate implies a total merger rate of /Gpc3/yr for the three cases (iii), (iv) and (iiσ). The agreement between the completely different estimates is surprising and could be completely coincidental as both estimates are based on very few events.
If correct these estimates are excellent news for gravitational radiation searches, for which neutron star mergers are prime targets. They imply that the recently updates high merger rate, that depends mostly on one object, PSR J0737+3039, is valid. These estimate implies one merger event within Mpc per year and one merger accompanied with a SHB within Mpc. These ranges are almost within the capability of LIGO I and certainly within the capability of LIGO II. If correct these estimates of the rate are excellent news for gravitational radiation searches, for which neutron star mergers are prime targets.
We have considered also the possibility that the DN system is formed dynamically and we have shown that the -DF of short GRBs expected from dynamical formation and subsequent merger of DNSs is markedly different from that expected from primordial DNS mergers (under the assumption that the distribution of delay times for primordial DNSs follows ). The large time for core collapse shifts the distribution of dynamically formed DNS mergers to low redshift. The observed -DF of short GRBs is consistent with that expected for mergers of dynamically formed DNSs, and appears to be inconsistent with that expected for primordial DNS mergers if the best fit parameters are considered We note, however, that current data do not allow to rule out a -DF consistent with that expected for primordial DNS mergers, since redshifts were obtained only for a minority of the detected short GRBs. This may be due to a bias against obtaining redshift information for high redshift (faint) short GRBs (see Fig.4, table 1 and discussion at the end of §3.3 of [19]). Future observations should allow to better constrain the -DF of short GRBs, and thus to differentiate between models. For example, detection of only a few high redshift () short GRBs would severely constrain the contribution of dynamically formed DNSs.
To conclude we stress that we have assumed that the luminosity function has a lower limit of . This was just because even if such a limit does not exists weaker bursts would be barely detected. The current peak flux distribution of BATSE burst cannot confirm (or rule out) the existence of such population (note however, that Tanvir et al., [22] suggest that such a population exists on the basis of the angular distribution of BATSE SHBs). If such weak bursts exist then, of course, the overall merger rate will be much larger [23]. Such events will provide such a high rate that soon LIGO I will begin to constrain this possibility.
References
- [1] \BYKouveliotou C. et al., \INAstrophysical Journal4131993L101.
- [2] \BYDezalay J. P. et al., \INAstrophysical Journal4711996L27.
- [3] \BYKouveliotou C. et al., 1996, in Gamma-ray bursts, Proceedings of the 3rd Huntsville Symposium. AIP Conference proceedings series, 1996, vol. 384, edited by Kouveliotou et al., ISBN: 156966859, p.42.
- [4] \BYGuetta D. & Piran T. \INAstronomy & Astrophysics4352005421
- [5] \BYGehrels N. et al. \INNature4372005851
- [6] \BYFox D. B. et al. \INNature4372005845
- [7] \BYBerger E. et al. \INNature4382005988
- [8] \BYMao S., Narayan R. & Piran T. \INAstrophysical Journal4201994171.
- [9] \BYGuetta D. & Piran T. \INAstronomy & Astrophysics4532006823
- [10] \BYEichler D., Livio M., Piran T. & Schramm D. \INNature3401989126
- [11] \BYGrindlay J., Portegies Zwart S. F. & McMillan S. \INNature Physics22006116
- [12] \BYGuetta D., Piran T. & Waxman E. \INAstrophysical Journal6192005412.
- [13] \BYPaciesas W.S. et al. \INAstrophysical Journal Supplement1221999465.
- [14] \BYChampion D.J. et al. \INMountly Notices RAS3502004L61.
- [15] \BYPiran T. \INAstrophysical Journal3891992L83.
- [16] \BYPorciani C. & Madau P. \INAstrophysical Journal5482001522.
- [17] \BYSchmidt M. \INAstrophysical Journal5592001L79.
- [18] \BYGal-Yam A. et al. astro-ph/0509891.
- [19] \BYHopman C., Guetta D., Waxman E. & Portegies Zwart S. \INAstrophysical Journal6432006L91
- [20] \BYNarayan R., Piran T. & Shemi A. \INAstrophysical Journal3791991L17.
- [21] \BYKalogera V. et al. \INAstrophysical Journal6142004L137
- [22] \BYTanvir N. et al. \INNature4382005991
- [23] \BYNakar E., Gal Yam. A. & Fox D. astro-ph/0511254