Radio recombination lines from the largest bound atoms in space
Abstract
In this paper, we report the detection of a series of radio recombination lines (RRLs) in absorption near 26 MHz arising from the largest bound carbon atoms detected in space. These atoms, which are more than a million times larger than the ground state atoms are undergoing delta transitions (, ) in the cool tenuous medium located in the Perseus arm in front of the supernova remnant, Cassiopeia A. Theoretical estimates had shown that atoms which recombined in tenuous media are stable up to quantum levels . Our data indicates that we have detected radiation from atoms in states very close to this theoretical limit. We also report high signal-to-noise detections of , and transitions in carbon atoms arising in the same clouds. In these data, we find that the increase in line widths with quantum number () due to pressure and radiation broadening of lines is much gentler than expected from existing models which assume a power law background radiation field. This discrepancy had also been noted earlier. The model line widths had been overestimated since the turnover in radiation field of Cassiopeia A at low frequencies had been ignored. In this paper, we show that, once the spectral turnover is included in the modeling, the slower increase in line width with quantum number is naturally explained.
keywords:
ISM: clouds – atoms – radio lines: ISM.1 Introduction
Over the forty years after their first detection, RRLs have become an important probe for interstellar plasma investigations (Gordon M.A. & Sorochenko R.L., 2002). The detection (Konovalenko A.A. & Sodin L.G., 1980; , 1980; Konovalenko A.A. & Sodin L.G., 1981) of the low frequency RRLs of carbon in absorption towards the strong supernova remnant Cassiopeia A (Cas A) in 1980 opened new ways to study the tenuous and cool interstellar medium (ISM). Theoretically, bound atoms with (Shaver P.A., 1975) are expected to exist in tenuous media. Alkali and alkaline earth metals like potassium and barium have been excited to high quantum levels (up to in the laboratory by using tunable dye lasers and reducing the Stark effect by minimizing local electric field (Connerade, J.-P, 1998). Naturally, the question arose - could such large atoms be observed with radio astronomical methods? Since atoms in such high quantum states trace entirely different ionized regions compared to HII regions, they are also important for studying physical processes in the ISM. RRL observations till date (, 1998; Konovalenko A.A., Stepkin S.V. & Shalunov D.V., 2002; Payne H.E., Anantharamaiah K.R. & Erickson W.C., 1989; Sorochenko R.L. & Walmsley C.M., 1991) cover the range from n=166 to n=868 towards Cas A with the highest bound state of near 20 MHz observed by (Konovalenko A.A., Stepkin S.V. & Shalunov D.V., 2002) using the UTR-2 telescope near Kharkov in Ukraine. At such low radio frequencies, terrestrial radio frequency interference has to be excised and data collected over many days to obtain a high signal to noise detection of any feature since the system temperature is fairly high due to the non-thermal nature of the background radiation field. In addition, the lines broaden due to non-LTE (local thermodynamical equilibrium) effects and the frequency separation between features () reduces at low frequencies making the observations difficult.
In spite of all these difficulties, low frequency RRLs are being observed in many Galactic regions. In this paper, we report the detection of the largest bound atom in space with transitions near near 26 MHz towards Cas A.
While lines at frequencies above 110 MHz are observed in emission, which implies the importance of stimulated emission (Payne H.E., Anantharamaiah K.R. & Erickson W.C., 1989), the lower frequency features appear in absorption against the radiation field of Cas A. Since RRLs have been detected at a range of frequencies from the clouds in the Perseus arm in front of Cas A, these have been extensively used to model and understand the physical conditions in the line forming clouds. Since Cas A dominates the system temperature at all these frequencies, it has been easy to use data from widely different telescopes. It is now widely believed that these low frequency RRLs arise in clouds associated with the HI component of the interstellar medium with temperatures of K (, 1998; Payne H.E., Anantharamaiah K.R. & Erickson W.C., 1994; Sorochenko R.L. & Walmsley C.M., 1991). However, most of the models which well explain the variation in the line optical depth with quantum numbers, overestimate the line widths at low frequencies.
In this paper, we explain the discrepancy between the observations and the existing models used to derive the line widths. In section 2 we elaborate on the observations, data analysis and present the spectra. In section 3, we discuss our results and the width discrepancy and in section 4 we present the conclusions of our study.
2 Observations
The RRL observations towards Cas A were conducted using the biggest decametre wavelength radio telescope UTR-2 situated in Ukraine (Braude et al., 1978). UTR-2 is a T-shaped antenna consisting of 2040 fat dipoles. It has an effective collecting area of about 100,000 m2 which results in a signal from Cas A which is dB higher than the Galactic background at 26 MHz. The telescope has an electronic steering capability which can track upto about the zenith.
The observations were carried out between 2000 and 2004 for approximately 100 days. A 4096-channel autocorrelometer operating with a bandwidth of about 1.2 MHz served as the backend.
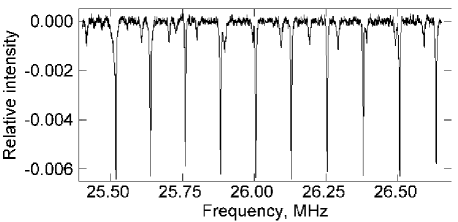
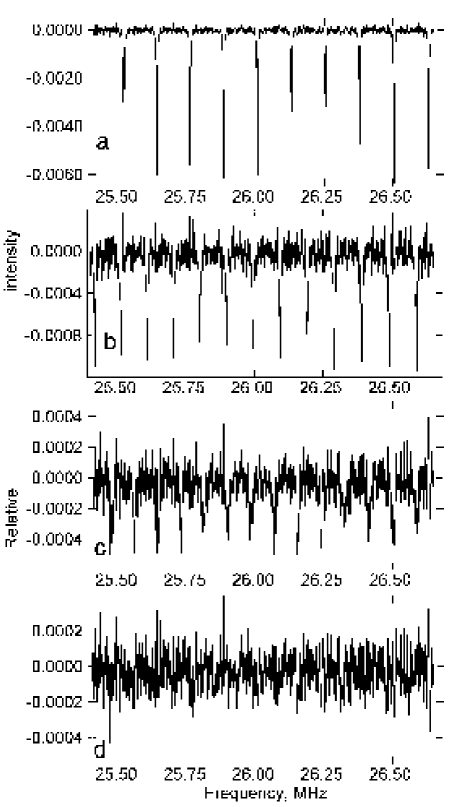
In our case of very high atom quantum states the condition of prevails and hence adjacent features were considered to be equivalent. Thus, we could fold individual transitions and improve measurement sensitivity considerably. Moreover, such an approach provides more reliable line parameters because different transitions were observed simultaneously with the same antenna and ambient medium conditions. Fig.1 shows the resulting spectrum measured in the direction of Cas A in the frequency band around 26 MHz with UTR-2. The integration time is 504 h. In the result obtained from each individual session, four-minute frames were cleared from interferences by subtracting from the measured autocorrelation function, cosine functions whose parameters correspond to hindering signals revealed in the power spectrum. Most often their numbers were between 4-8. Frames with wide-band interferences (which were rare) were excluded from analysis. Base line correction was carried out using splines of the third order. Unblended and features were used to obtain the initial models of the corresponding line profiles. After removing of and lines from the initial spectrum and new base line correction we obtained the lines and were able to build the corresponding model. After this, all obtained models (, , and ones) were again subtracted from the initial spectrum and base line correction repeated. Models of the features were built by fitting Voigt profiles to folded transitions using Levenberg - Marquardt method. The line model was obtained similarly to the one. For and profile fitting the two component model with central radial velocities (comparatively to the local standard of rest) of -1.6 and -47.2 km was used. The , and features were fitted with one component profile (at -47.2 km). The values of central radial velocities as well as the value of Doppler width of 15.8 km were obtained by two Voigt profiles fitting to the folded line and were fixed when modeling the other features. The procedure described above was carried out several times until the fitted parameters were stabilized. The whole numbers of these steps came to six. The Voigt models were used as the radiative and pressure mechanisms lead to Lorentzian profile and the Doppler thermal broadening to a Gaussian. The resulting line shape is described by the Voigt function which is the convolution of the above mentioned curves. Fig.2 reveals series of , , , and features. They were obtained as a consequent of subtracting the corresponding model profiles of RRLs from the original spectrum (see Fig. 1).
The individual transitions in Fig. 2 are folded to obtain the averaged , , and RRLs of carbon shown in Fig.3
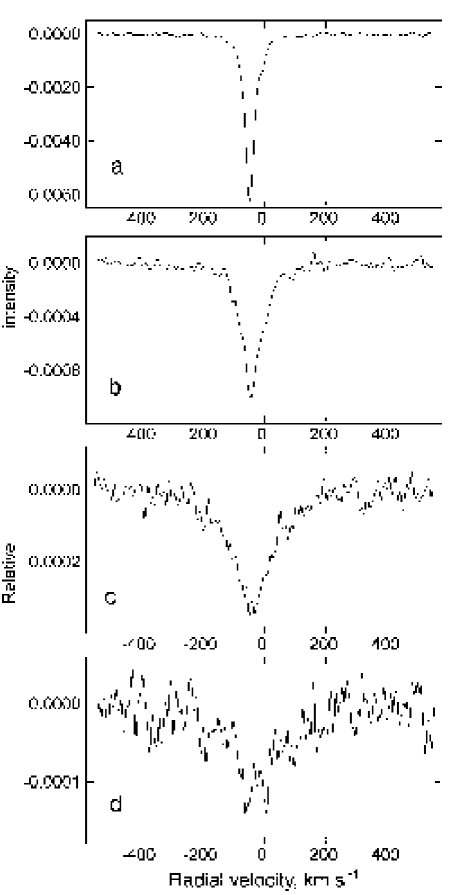
The feature near km s-1 is due to gas in the Perseus arm. In the -line spectrum the spectral feature near 0 km/s corresponds to the medium in the Orion arm. It is blended with the line arising in the Perseus arm and is not the topic of consideration in this paper. The effective integration time for transition is 5040 h and radial velocity resolution is 9.2 .
The Voigt fitting parameters of lines arising in the Perseus and Orion arms are presented in Table 1 (for Orion arm features ).
| Galactic arm | Lines | / | I | ||
|---|---|---|---|---|---|
| Perseus | (627-636) | ||||
| (790-802) | |||||
| (904-917) | |||||
| (994-1009) | |||||
| Orion | (627-636) | ||||
| (790-802) |
Symbols used: = ratio of line temperature to that of background (relative intensity); = Lorentzian line width (km ); = total profile line width (km ); I = integral intensity (Hz).
3 Discussion
Previously, the physical models of the medium in the direction of Cas A where low frequency carbon spectral lines arise have been built based on the analysis of the multi frequency data of transitions because corresponding features are the most intensive and easy to observe (Payne H.E., Anantharamaiah K.R. & Erickson W.C., 1994; , 1998). The model which best fits the data has an electron temperature =75 K, electron concentration cm-3 and a background radiation field K at 100 MHz (spectral index ). Dielectronic-like recombination (Walmsley C.M. & Watson W.D., 1982) and the boundary condition that the departure coefficient as (Salem M. & Brocklehurst M., 1979) was used for the modeling.
In order to obtain the maximum excitation level of an atom which can be studied with the radio astronomical methods, we have to analyse the problem of low frequency RRLs broadening. This is also important for explanation of line parameter behaviour. Pressure and radiative mechanisms are responsible for the effect along with the Doppler thermal broadening. The Lorentzian line width has two components
| (1) |
where and are the pressure and the radiation broadening correspondingly. Towards Cas A radiation broadening is caused by influence of the Galactic background with temperature and non-thermal radiation of Cas A with ( is dilution factor) and is the temperature of Cas A radiation, i.e
| (2) |
The theoretical behaviours of these phenomena have already been studied (Shaver P.A., 1975). The radiation broadening is determined by
| (3) |
where is intensity of background radiation and is Einstein coefficient of induced emission, is light velocity in km s-1 and is the observation frequency in Hz (Gordon M.A. & Sorochenko R.L., 2002; Shaver P.A., 1975).
All models till date have used a power law of index to derive the background temperature. In this case
| (4) |
where and is the radiation temperature of the background emission at 100 MHz (spectral index ) (Shaver P.A., 1975). When calculating the Lorentzian line width (, 1998) the total temperature leading to the radiation broadening was taken as at 100 MHz () with spectral index -2.6. This, we believe, is not correct for quantum numbers or so. Such models give a large discrepancy between calculated values and experimental data. We resolve the problem as follows. Cas A has a known turnover point in its spectrum at frequencies less than 20 MHz. The flux density drops (Braude et al., 1978) from 58,000 Jy at 20 MHz to 26,000 Jy at 10 MHz and hence instead of increasing with a decrease in frequency, the flux density decreases. Earlier models had not taken into account this turnover in the spectrum of CasA and hence overestimated the line widths at lower frequencies. Here we also have taken when calculating the contribution of Galactic background to the total line width. In order to determine the contribution of Cas A at the low frequencies under study here we have used the experimental data for frequency range of 10 - 20 MHz (Braude et al., 1978) and extrapolated them up to 5 MHz. The dependence of flux density and temperature (taking into account the dilution factor) can be approximated with good accuracy in this range by
| (5) |
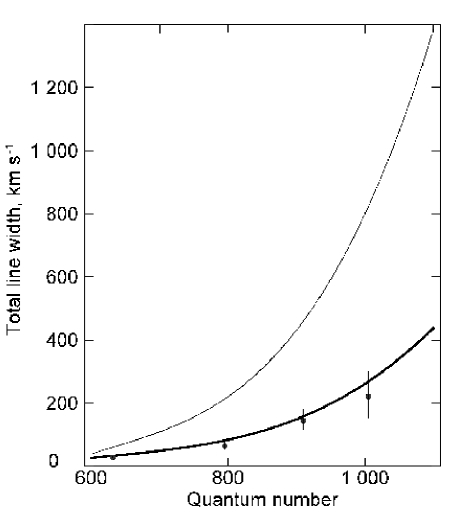
To evaluate the we have used the measurement result for n around 630 ( around 26 MHz). Then we calculated numerically the values of for other frequencies according to (3). In Fig. 4 this result is graphically presented. The dependence of line width against quantum level using our algorithm (thick line) and earlier models (thin line) along with the experimental data are presented. The parameters are taken as the following: =75 K, cm-3, the temperature of the Galactic non-thermal background radiation Tbg= 27,000 K at 26 MHz with spectral index and corresponding dilution factor =1 (the drop of Galactic background is expected to be at MHz), and the term determining contribution of Cas A emission to radiative line broadening is estimated as 12,000 K at 26 MHz (which is comparable to the influence of Galactic background).
The pressure broadening (Shaver P.A., 1975) can be calculated using
| (6) |
Correspondence between the curve predicted by our arguments and measured parameters is good, whereas the older models overestimate the line widths. When we take into account the typical conditions of the ISM in the Galaxy, the fundamental limit of the highest bound state of a Rydberg atom is near n=1,700. These are arrived at by estimating the quantum level at which the rate of depopulation exceeds the orbital frequency of the electron (Shaver P.A., 1975; Brocklehurst M. & Seaton M.J., 1972). Our detection of the highest bound level at n=1,005 (1,009) is thus well within this range and close to the value quoted earlier (Shaver P.A., 1975). This carbon atom is expected to have a classical diameter of about 108 ( 0.1 mm). Compare this with the Bohr diameter 0.000106 . The carbon atom in this tenuous nebula is larger by a factor of compared to the ground state atom. Taking into consideration the obtained data and criterion that the distance between adjacent lines have to be more than half the line width, we can expect that it will be possible to observe the space atoms with n=1,100 - 1,200 in the frequency range 15 - 20 MHz. Line blending is expected at larger n because of the decreasing distance between the lines in correspondence with the expression:
| (7) |
where is the Rydberg constant for carbon and Z is the charge of an ion.
4 Conclusions
In this paper, we have reported the detection of the largest bound atom in space, which has recombined to quantum levels of . The final spectrum presented here shows the presence of , , and lines. This spectrum near 26 MHz was obtained by integrating data towards Cas A obtained using UTR-2 telescope in Ukraine.
At such low frequencies, the line widths are expected to increase steeply () due to radiation and pressure broadening which strongly dominate over thermal Doppler broadening. However, we find that the observed increase is much slower than predicted. We believe that this slow increase is due to the decrease in the background radiation field at low frequencies due to the spectral turnover in the non-thermal spectra of Cas A. After incorporating this in the model, we find an excellent fit to the line widths of our observed data. Thus, we suggest that this decrease in the field should be incorporated in any model which explains the RRL data towards Cas A.
Presently investigations of low frequency RRLs with UTR-2 are continuing for many galactic objects and data processing is progressing. It is clear that RRLs studies will be important part of the scientific programs of future giant low frequency instruments such as LOFAR.
Acknowledgments
We acknowledge the efforts of late Prof. K.R. Anantharamaiah who played a seminal role in initiating the joint Indo-Ukrainian project which were funded by the Department of Science and Technology, India and Ministry of Education and Science, Ukraine. We thank Prof. W. Erickson for supplying the observatory UTR-2 with elements necessary to build the 4096-channel correlometer. We thank Prof. D. P. Dewangan for bringing to our view the laboratory work on Rydberg atoms. The works were carried out with partial support of the grant INTAS 03-5727.
References
- (1) Blake D.H., Crutcher R.M., Watson W.D., 1980, Nat., 287, 707
- Braude et al. (1978) Braude S.Ya., Megn A.V., Ryabov B.P., Sharykin N.K., Zhouk I.N., 1978, Astrophysics and Space Science, 54, 3
- Brocklehurst M. & Seaton M.J. (1972) Brocklehurst M., Seaton M.J., 1972, MNRAS, 157, 179
- Connerade, J.-P (1998) Connerade, J.-P., 1998, Highly Excited Atoms. Cambridge Univ. Press, Cambridge
- Gordon M.A. & Sorochenko R.L. (2002) Gordon M.A., Sorochenko R.L., 2002,Radio Recombination Lines: Their Physics and Astronomical Application. Kluwer, Dordrecht
- (6) Kantharia N.G., Anantharamaiah K.R., Payne H.E., 1998, ApJ, 506,758
- Konovalenko A.A. & Sodin L.G. (1980) Konovalenko A.A., Sodin L.G., 1980, Nat., 283, 360
- Konovalenko A.A. & Sodin L.G. (1981) Konovalenko A.A., Sodin L.G., 1981, Nat., 294, 135
- Konovalenko A.A., Stepkin S.V. & Shalunov D.V. (2002) Konovalenko A.A., Stepkin S.V., Shalunov D.V., 2002, in Pramesh Rao A., Swarup G., Gopal-Krishna eds, Proc. IAU Symp.199, The Universe at Low Radio Frequencies. Astron. Soc. Pac., Pune, India, p. 349
- Payne H.E., Anantharamaiah K.R. & Erickson W.C. (1989) Payne H.E., Anantharamaiah K.R., Erickson W.C., 1989, ApJ, 341, 689
- Payne H.E., Anantharamaiah K.R. & Erickson W.C. (1994) Payne H.E., Anantharamaiah K.R., Erickson W.C., 1994, ApJ, 430, 690
- Salem M. & Brocklehurst M. (1979) Salem M., Brocklehurst M., 1979, ApJS, 39, 633
- Shaver P.A. (1975) Shaver P.A., 1975, Theoretical intensities of low frequency recombination lines. Pramana 5, 1
- Sorochenko R.L. & Walmsley C.M. (1991) Sorochenko R.L., Walmsley C.M., 1991, Astronomy Astrophysics Transactions, 1, 31
- Walmsley C.M. & Watson W.D. (1982) Walmsley C. M., Watson W. D., 1982, ApJ, 260, 317