11email: vittoria.caloi@iasf-roma.inaf.it 22institutetext: INAF - Osservatorio Astronomico di Roma, INAF, via Frascati 33, 00040 Monte Porzio, Italy
22email: dantona@oa-roma.inaf.it
NGC 6441: another indication for a very high helium content in Globular Cluster stars.
Abstract
Context. The metal-rich bulge globular cluster NGC 6441 shows a well developed blue horizontal branch (Rich et al.), together with a strong slope upward from the red clump to the blue of the RR Lyrae region. Both features, the former corresponding to the well-known second parameter problem, are not explained by conventional evolutionary models.
Aims. Helium self-enrichment is proposed as a possible solution to both questions, a mechanism already invoked for the interpretation of the peculiarities in NGC 2808 and M13.
Methods. We make use of horizontal branch simulations, covering a wide range in main sequence helium abundance, to investigate whether the main features of NGC 6441 horizontal branch population, including the RR Lyrae variables period, can be reproduced.
Results. To describe the horizontal branch of NGC 6441, the helium content Y in the red clump must reach at least 0.35; values up to Y0.37 are necessary to populate the RR Lyr region, reproducing also the observed mean long periods; depending on the dispersion in mass loss assumed in the simulations, values up to Y0.38–0.40 are necessary to populate the blue HB. The total self–enriched population amounts to 60% of the whole stellar content.
Conclusions. Self-enrichment and multiple star formation episodes in the early evolution of globular clusters appear more and more able to account for many of the chemical and population peculiarities observed in these systems. The very large helium abundances (Y0.35) required for 14% of the horizontal branch population pose some problem on the enrichment mechanisms.
Key Words.:
Globular Clusters:individual:NGC 6441–stars:evolution–stars:horizontal branch–globular clusters:general1 Introduction
In the last few years, some of the (by now) well known abundance anomalies in globular cluster (GC) star composition have been observed in unevolved cluster members (f.e., the anticorrelation between Na and O abundances; Gratton et al. 2001, Ramirez & Cohen 2003, Cohen & Melendez 2005, Carretta et al. 2006). These observations have focused attention on the early stages of GC formation and evolution, since it appears necessary that the abundance deviations from that of the pristine material have taken place before the formation of the stars in which they are observed.
A model which can explain all the chemical anomalies is not yet available, but some aspects of the problem begin to be understood, while others are still obscure. A clear step forward was made when it was recognized the link between the chemical anomalies and the horizontal branch (HB) morphology of the clusters: if the chemical anomalies, and in particular the Na–O anticorrelation, is interpreted in terms of a second generation of stars born from the ejecta of the massive asymptotic giant branch (AGB) stars of the first stellar generation, there must also be a helium discontinuity between the two samples of stars. In fact the AGB ejecta from which the second generation is born are all helium enriched111The masses of the AGBs involved must be 4M⊙, otherwhise the second generation would show evolutionary signatures of a prolonged phase of third dredge up, namely the sum of CNO abundances would not be costant, and there would be s– process elements enhancement. The helium content of the ejecta of a 4 M⊙ AGB star is Y0.27 for Z=0.001. (D’Antona et al., 2002) and consequently the second star generation evolving along the HB have bluer locations with respect to the first generation HB stars. This model was able to produce a detailed explanation of the anomalous morphology of the HB of the cluster NGC 2808 (D’Antona & Caloi, 2004); besides, observations have confirmed the existence of a Na–O anticorrelation in the cluster (Carretta et al., 2006).
An intriguing problem concerning at the moment only NGC 2808 and the “cluster” Cen is the presence of a well defined second main sequence (MS), bluer than the main one. In terms of standard MS models, this feature is a helium rich sequence in which the helium mass fraction must be Y0.4 (see for Cen Norris 2004; Piotto et al. 2005 and for NGC 2808 D’Antona et al. 2005). AGB models do not predict such a large helium abundance in the ejecta, the maximum computed value being Y0.36 in Lattanzio et al. (2004), obtained from the evolution of a 6M⊙ with Z=0.004. Ventura et al. (2002) quote values up to Y0.31 and Ventura & D’Antona (2005b) estimate Y=0.32 for their most massive models (6.5 M⊙) for metallicity Z=0.001. Although this value can be considered conservative, as these models do not include any kind of overshooting, a preliminary exploration of the second dredge up does not increase Y beyond (Ventura 2006, private communication). The episodes of third dredge up may help to increase the helium content in some models (Ventura & D’Antona, 2005a), but too many episodes in the end do not preserve the constancy of C+N+O. Inclusion of the results from these computation in a code for computing the chemical evolution of helium confirms the conclusion that present AGB models cannot explain the extreme helium enhancements (Karakas et al., 2006). The role of super–AGBs, the stars which ignite Carbon in semidegenerate conditions and may evolve through a AGB phase, ending up their life as O–Ne–Mg white dwarfs, has not yet been explored for the metallicities of GCs. Siess (2006) finds Y 0.38 for these stars after the second dredge up, but this result may be affected by the initial value of the helium content, as his models refer to solar metallicity.
From D’Antona et al. (2005), the extreme helium enhancement, derived both from the blue MS and from the extreme HB blue tails EBT2 and EBT3 (as defined in Bedin et al. 2000), concerns only 15% of the stars in NGC 2808, and a similar fraction of stars is involved in the bluer MS in Cen.
We remind that the extreme value of the helium content, obtained from the MS fit, is rather uncertain. On the basis of our present understanding, extreme helium enhancements (Y 0.35) may derive either from the high mass tail of AGBs (for which at present we do not yet have models, see above) or from the wind ejecta of the massive stars of the first stellar generation (Piotto et al., 2005; Prantzos & Charbonnel, 2006; Smith, 2006). This latter suggestion would complicate even more the picture of star formation in the “simple” stellar population such as GC stars were considered until a few years ago. It is then important to ascertain whether there are any other GC in which there is a clear indication for an extreme helium rich (Y0.35) component. In the absence of new information coming from other main sequences, we considered modelling the peculiar HB of the cluster NGC 6441, whose morphology and RR Lyr population (Rich et al. 1997, Layden et al 1999, Pritzl et al. 2000) are both a clear indication of the presence of helium enrichment, as already suggested by Sweigart & Catelan (1998); D’Antona et al. (2002); D’Antona & Caloi (2004). The results obtained from this analysis can be extended to the cluster NGC 6388, very similar to NGC 6441 in metallicity and peculiar HB morphology and RR Lyr periods.
We shall proceed as follows: §2 presents the observational data for NGC 6441 and the related problems; the theoretical background is given in §3, while §4 describes the comparison with the observations with a possible solution to the questions in §2; some aspects of the given solution are examined in §5, and §6 gives the final discussion.
2 The horizontal branch in NGC 6441
NGC 6441 belongs to the metal rich group of GCs (Z 0.004). All these clusters have a HB confined to the red side of the RR Lyr region, with the exception of NGC 6441 itself and of its “twin cluster” NGC 6388 (Rich et al. 1997).
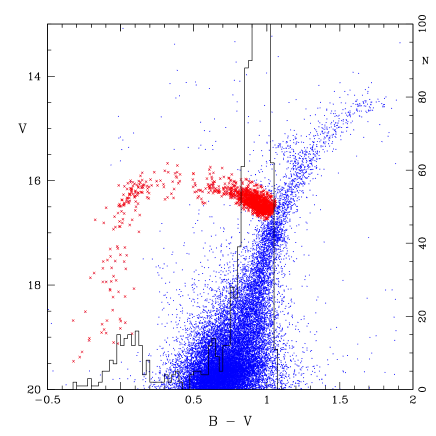
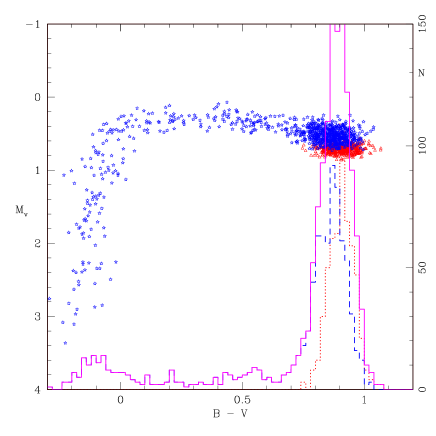
The CM diagram of NGC 6441 is shown in Fig. 1 (data from Piotto et al. 2002, dereddened by E(B–V)=0.44). The red clump has a strong slope upward, which continues in the RR Lyrae and blue HB regions, with a difference of at least 0.6 mag between the top of the blue HB and the bottom of the red clump. The features to be explained are: a) the presence of HB stars hotter than the red clump ones; b) the strong tilt in luminosity, much larger than expected on the basis of evolutionary models (f.e., Raimondo et al. 2002); c) the very long average period of the RR Lyr variables, unexpected on the basis of the metal content (Z 0.006; Layden et al. 1999, Pritzl et al. 2001, 2003); d) the presence of an extended blue tail down to a magnitude V 19.5, corresponding to Mv 3.5 mag.
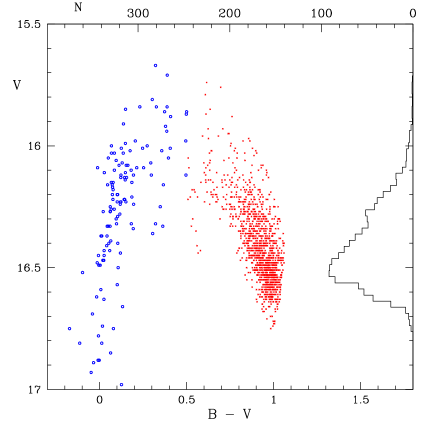
In Fig. 1 our choice of the HB members is indicated (crosses). The numbers turn out to be: a total of 1452 members, out of which 1278 form a red clump ((B–V)0 0.5). For our simulations we assumed therefore a total of 1452 stars, to be distributed according to observations. Also in Fig. 1 the histogram of the number of HB stars with respect to B–V is shown; in Fig. 2 the histogram with respect to V mag is shown, considering only stars with (B–V)0 0.5 (crosses).
3 The evolutionary and synthetic HB models
The computation of HB models and of the synthetic HBs follows the prescription in D’Antona & Caloi (2004). We will model the HB by assuming cluster members to be a mixture of stars with different helium abundances, as we did for NGC 2808 and M13. Previous simulations for the HB of NGC 6441 have been performed by Sweigart & Catelan (1998), who also considered models with high Y, but not a mixture of helium contents.
The scheme of our modelling will be the following. We consider a first group of stars with a fixed helium abundance Y, close to the cosmological value Y= 0.25, which represents the first stellar generation. A second (or more) generation(s) are added, with a helium content variable from Y to Y0.40. The number vs. helium distribution will be chosen in order to comply with the relevant HB features mentioned in Sect. 2
3.1 HB structures
We computed evolutionary sequences from the main sequence to the red giant tip for a heavy element content of Z = 0.006 and Y = 0.24, 0.26, 0.30 and 0.40. Having an estimate of the helium core masses at the flash, we obtained HB evolutionary sequences with the appropriate core masses and atmospheric helium abundances (after the first dredge–up). The theoretical tracks were transformed into Johnson magnitudes B and V by means of Bessell, Castelli, & Plez (1998). The clump colours correspond nicely to the colours of the transformed tracks. Nevertheless, we do not emphasize this correspondence as a proof of a good choice of metallicity, as we could have shifted the observed colors within the uncertainties of the reddening ( according to Layden et al. (1999)). Such an uncertainty has no influence upon our comparisons, based quantitatively on luminosity differences and periods and only qualitatively on the color extension of the HB, which greatly exceeds the reddening error. On this basis, HB simulations were computed in V, B–V, assuming a gaussian error on magnitudes and colours. A standard deviation of 0.05 mag has been chosen on the basis of the HB data from Piotto et al. (2002).
3.2 The main parameters in the simulations
We assumed as the basic parameter describing the HB distribution the ratio R of the number of blue ((B–V)0 0.5) HB members to the total number of HB stars. This ratio (174/1452 with the numbers above) is R = 0.12 0.01. The other constraints to be satisfied by the simulations are the agreement with the histogram in Fig. 2, the extension in magnitude of the blue tail and the mean RR Lyr period.
With regard to the RR Lyr variables, for every simulation we evaluated the mean period of the artificial RR Lyrae variables by means of van Albada & Baker (1973) formulation; the limits of the RR Lyr region were taken from logTeff = 3.79 to 3.875. This is a standard interval for the more metal poor GCs, and may not correspond exactly to the present conditions of high Z and high luminosity. The properties of the RR Lyraes in NGC 6441 appear extreme when compared with those of the whole family of GCs (see, f.e., Fig.10 in Pritzl et al. 2001), but still within the limits of current interpretation. So we are confident that the order of magnitude of the estimated period is adequate. The observational mean period is built by averaging the observed periods, taking care to “fundamentalize” the periods of the RRc variables by adding 0.128 to the logarithm of their periods (van Albada & Baker, 1973).
4 The simulations and the comparison with the data
Two features, one observational and the other theoretical, affect strongly the comparison between observations and simulations:
-
1.
the fact that the RR Lyrae variables and the blue component in NGC 6441 are only a tail of the red clump distribution, covering slighly more than 10% of the total HB population;
-
2.
the behaviour in the HR diagram of HB models rich in helium.
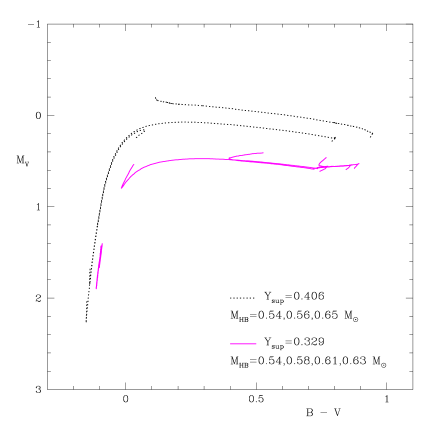
The evolutionary path of the helium rich models may be confined in the red clump region, or may perform long loops, reaching very blue colours, for a difference in total mass of the order of 0.02 M⊙: a well known fact, see, f.e., Sweigart & Gross (1976). This is shown also in Fig. 3. Both these features conspire to vary noticeably the RR Lyr number and mean period, even by only varying the random extraction. Consequently, we will try to fit first of all the observed fraction of stars at B–V0.5 mag, and will impose the extension of the blue tail down to Mv 3 mag. In any case, we will not accept for the RR Lyrs a mean period smaller than 0.66 d.
4.1 Age, helium distribution and mass loss
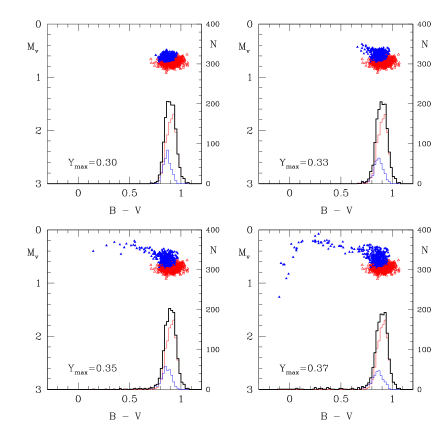
We assumed a reference age of 11 Gyr. Coeval populations with the same metallicity but different helium content will have turnoff masses inversely proportional to Y. Therefore, the progeny of the helium rich, lower mass evolving red giants will be located, on the average, at larger temperatures (due to the smaller evolving masses) and larger luminosity (due to the higher efficiency of the hydrogen shell burning) than the structures with lower helium. To illustrate this basic fact, we show in Fig. 4 the behaviour of two groups of stars, in one of which the maximum helium content is progressively increased. As expected, the evolutionary paths, confined within the red clump for lower Y, as it happens for the cosmological helium population, reach farther and farther into the bluer HB regions when increasing the maximum Y.
For an age of 11 Gyr, we chose as mass loss during the red giant evolution M=0.165 M⊙ with =0.02. With this amount it was easy to obtain the desired behaviour of the clump luminosity, when varying the helium content in the helium enriched population(s). A larger mass loss would cause an excessive loss of clump members (increasing the fraction of stars at B–V0.5 mag beyond the allowed values), a lower one would have the opposite effect. Of course the value of 0.165 M⊙ is related to the chosen age: for 13 Gyr, a mass loss of 0.13 M⊙ would have given similar results.
The faintest blue HB stars in Fig. 1 – about 3.5 mag less luminous than the RR Lyrs – correspond to a HB mass 0.5 M⊙. For Y = 0.40 and an age of 11 Gyr the evolving red giant has a mass of 0.72 M⊙, which would require a mass loss 0.22 M⊙; larger mass losses would be necessary for lower Y, up to 0.45 M⊙ for Y=0.25. We have therefore considered models with Y up to 0.40, but even at this large helium content the very faint magnitudes are statistically difficult to obtain. So we took into account the possibility of an increase in the mass loss rate with the decrease of the red giant mass, according to Reimers (1977) mass loss relation (see also Lee et al. 1994). But this is not an automatic solution to the problem; the progression in mass loss used in Lee et al. (1994) would not allow any HB progeny to red giants of 11 Gyr with the assumed Z, helium content 0.40 and a basic mass loss of 0.165 M⊙ (for the case Y=0.25), so we assume a milder dependence of the mass loss on the evolving red giant mass. Another constraint is given by the necessity of keeping the required number of stars within the red clump (and with the observed distribution in luminosity), since, with increasing mass loss, the evolutionary tracks tend to shift to the blue (see Fig. 3).
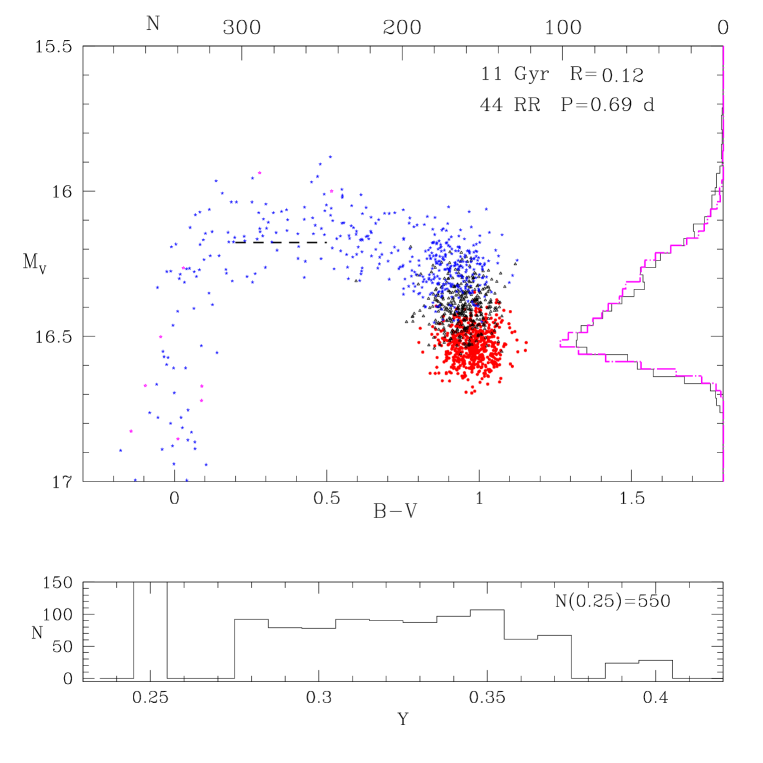
In Fig. 5 and Fig. 6 we give an example of a synthetic HR diagram and of its detailed behaviour in the clump region. In addition to the parameters specified above—age 11 Gyr, M=0.165 M⊙, =0.02—, the extra mass loss included takes the form . Here we discuss the main features of these diagrams.
To reproduce the strong upward tilt in the red clump, it is necessary to consider objects with helium content up to Y 0.35. In Fig. 10 the typical relation of B–V with Y is shown. To get B–V 0.5 mag, one needs stars with Y 0.33, while the main body of clump stars (B–V 0.5) have a Y content up to 0.37; to find (almost) exclusively blue stars we have to attain Y 0.37.
In order to have, on the one side, blue HB stars at least 3 mag less luminous than the HB luminosity peak, and on the other, the expected number of red clump members, it is necessary to assume a non uniform Y distribution for the second star generation. Otherwise, it is not possible to obtain a blue tail without remaining with too few red stars (B–V 0.5).
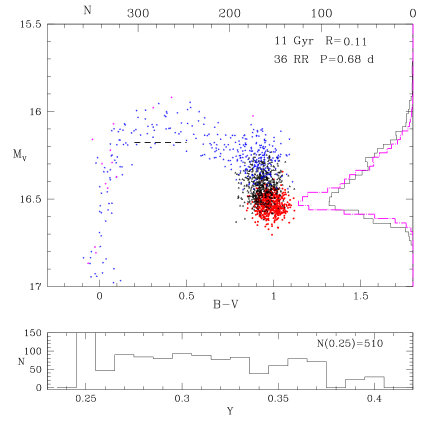
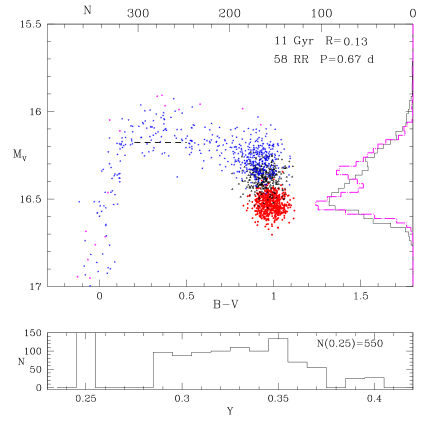
The difference in helium content between the first and the second generations has to be 0.02 (a gap in Y from 0.25 to 0.27), in order not to increase the peak in the clump distribution (Fig. 7). At the same time, the gap cannot be larger than 0.03 (Y from 0.25 to 0.28), otherwise the clump distribution would show (always) two well defined peaks (Fig. 8).
The importance of the assumed error on V ,B–V is exemplified in Fig. 9, where the same simulation of Fig. 6 is shown with an error on V ,B–V reduced from 0.05 to 0.03 mag: the clump appears clearly separated in two groups. This illustrates the relevance of improving the photometric precision in order to understand better the population stratification in GCs.
4.2 Metallicity
The adopted metallicity Z=0.006 falls on the lower side of the values acceptable for the cluster under exam (e.g. Clementini et al., 2005). In fact, it corresponds to the value in the Carretta & Gratton (1997) scale, if we do not consider –enhancement. On the other hand, this metal rich cluster seems to be also –enhanced (Carretta, private communication). Should Z be larger, all the estimated helium values would be pushed towards even larger values.
4.3 “The best solution”
We consider a satisfactory result the one given by the simulation in Fig. 5 and Fig. 6. The helium distribution in shown in the lower panel in Fig. 6; an extra mass loss of has been assumed, beside the standard M=0.165 M⊙ mentioned before. The simulation has the correct value of the fraction of stars at B–V 0.5 mag within the errors, a number of RR Lyr variables close to the estimated one (45 in the sample in Piotto et al., as mentioned before) with a mean period of 0.69 d close to the observed fundamentalized period of 0.67 d. As for the very blue stars, three stars are found at Mv 3.0 mag in Fig. 5.
We stress again that variables and BHB stars are only a tail of the cluster star distribution, and that a small fluctuation in the clump number ( and in the number of stars which leave the clump at a luminosity slightly lower than the average, changes noticeably the number of RR Lyraes and their mean period.
4.4 Dispersion in mass loss and maximum helium content
In the simulations we adopt a widely used value in the relevant literature (Lee, Demarque, & Zinn (1994); Catelan et al. (2001)). With this assumption, it is necessary to include stars with Y up to 0.40. It is important to see whether such extreme values of Y can be avoided, since current models for possible self–enrichment in helium in globular clusters do not predict valus larger than Y. We performed simulations with larger values for : while it is possible to achieve the end of the blue tail with Y0.4, the mean RR Lyr period requires the presence of stars with Y up to . These stars in fact have the (large) luminosity necessary to obtain the long observed periods.
4.5 The number vs. helium distribution
The number of stars as function of Y assumed in the simulations is given in the bottom panels of Fig. 6, 7 and 8. For our “best solution” we see that only 550/145238% of stars belong to the first stellar generation with “normal” helium Y=0.25. Anoher important feature is made evident by Fig. 10. Stars with Y 0.33 are necessary to achieve B–V 0.5 mag, but a large fraction of these objects remains in the red clump, due to the large excursions in colour of helium rich structures (see Fig. 3). Besides, the presence of structures with Y up to 0.37 is required by the luminosity distribution of the clump itself (Fig. 6). This means that we must have a substantial amount of stars with Y 0.33 in the cluster. In fact, in our “best solution” (§4.3 and Fig. 5), we have 38% of stars with Y = 0.25, 33% of stars with 0.2750.33, and 29% of stars with Y 0.33. About 15% of stars have Y 0.35. In this last group are included the objects with Y = 0.39 – 0.40 (3.6%), which are the only ones to remain (almost) always at B–V 0.0.
The exact numbers may be debated, as they depend in part on the age and mass loss along the RGB, and the extreme range Y = 0.39 – 0.40 can be avoided with a mass dispersion 0.04 M⊙, but surely a substantial fraction ( 30%) has Y 0.33.
5 The R parameter and the bump location
The ratio R of the number of HB stars to the number of red giants above the HB level has been a powerful indicator of the helium content in cluster stars, as first suggested by Iben (1968a), when the aim was to discriminate the helium mass fraction in the oldest stars of the Galaxy between values close to Y=0.1 or to Y=0.3. For NGC 6441, Salaris et al. (2004) find a value R=, consistent with the theoretical expectation by the same authors for the cluster metallicity. On the contrary, the simulations by Sweigart & Catelan (1998) predicted values as large as 3.4 – 3.9, when they assumed main sequence helium abundances of Y=0.38 and Y=0.43 for all the cluster stars. For these values, the level of luminosity of the HB clump is highly enhanced and thus the number of red giants to be considered reduced. This in fact is also predicted by the simple interpolation formula by Buzzoni et al. (1983)
| (1) |
We do not explicitly compute the value of R from our simulations, because it is easy to understand that we would find a “normal” value for R, due to the fact that the HB level in the R definition is the zero age value, which in this cluster is determined by the stars having the normally adopted value of Y=0.25. These are the lowest luminosity stars in the red clump and so the number of red giants to be considered remains the same as in the case with constant Y=0.25. In addition, there is only a small percentage of very hot stars with very high helium, whose HB lifetimes would exceed the Y=0.25 lifetimes, so that the correction to R due to these stars would turn out to be small. Therefore, the argument by Layden et al. (1999) based on the R parameter can not be considered a proof against a high helium content as explanation of the RR Lyr long periods.
Raimondo et al. (2002) notice that a uniform high helium abundance of the cluster stars predicts a wrong location of the red giant branch bump (Thomas, 1967; Iben, 1968b) with respect to the HB. Also in this case, our modeling is consistent with this latter parameter: a prominent RGB bump will occur at the luminosity predicted by models with Y=0.25, which is the abundance of 40% of the stars. The stars having larger Y will produce smaller bumps, spread along the RGB at increasing luminosities, according to the number vs. Y distribution. Notice also that the prominence of the bump decreases with increasing Y. Further, the HB reference luminosity level in our simulations, as mentioned above, corresponds to the Y=0.25 level. Therefore, the quoted difficulty with a high helium population by Raimondo et al. (2002) does not apply to our model.
6 Discussion
The interpretation of the HB morphology of NGC 6441 in terms of a helium rich population has provided a coherent interpretation of the main features of the anomalous HB of this cluster, namely, the thick extension in luminosity of the red clump, the very long mean period of the RR Lyrs for a cluster of high metallicity, the extension into the blue of the HB. Modellization shows that a continuous distribution of helium content above Y=0.25 is not consistent with the luminosity distribution of stars in the red clump, and that a helium discontinuity must be present, from Y=0.25 to a minimum value of Y0.27, like in the cluster NGC 2808. We suggest that a more precise photometry of the HB would put into evidence a double peak in the luminosity distribution of the red clump stars.
While it had been long suspected that the blue HB and the high RR Lyr luminosity in this cluster —and in its twin NGC 6388— could be easily attributed to a high helium content in the small fraction of stars –%– constituting the blue HB (Sweigart & Catelan, 1998; D’Antona & Caloi, 2004), it comes as a surprise of these detailed simulations that a much more important fraction of stars has a very large Y: 29% have Y 0.33 and 14% have Y 0.35. This latter figure is similar to the percentage of stars with Y 0.4 found from the analysis of the main sequence in NGC 2808 (D’Antona et al., 2005). In this respect, we conclude that both NGC 6441 and NGC 2808 were able to form about the same fraction of very high helium stars, whatever their origin.
The difference between the two clusters resides in the intermediate helium population, which for NGC 2808 contains 35% of stars, and covers only the range between 0.26 and 0.29 (D’Antona et al., 2005). In NGC 6441, this fraction is 48% and covers a helium content from 0.27 to 0.35. Thus, any dynamical and chemical evolution model for these clusters must also explain the difference in this intermediate population. We suggest that it is due to the different metallicities of the two clusters: in NGC 2808 (Z ) the maximum mass for AGB type evolution is smaller than in NGC 6441 (Z ). Therefore, the range of progenitor masses for the second stellar generation in NGC 6441 contains stars of larger mass which also have larger helium content (Ventura, D’Antona, & Mazzitelli, 2002).
One of the motivations to pursue the present work was to investigate whether an “extreme” high helium population is present in other clusters beside NGC 2808 and Cen. We found this extreme helium population in NGC 6441 (and this must also exist in the very similar cluster NGC 6388), and we also discovered that more than 60% of the cluster stars belong to the second stellar generation, having .
The interpretation of the HB morphology of NGC 6441 makes it even more cogent to understand better which is the origin of these extreme helium rich stars.
Acknowledgements.
We thank dr. Anna Marenzi for help in the preparation of the paper and prof. G. Piotto for providing the database of NGC 6441.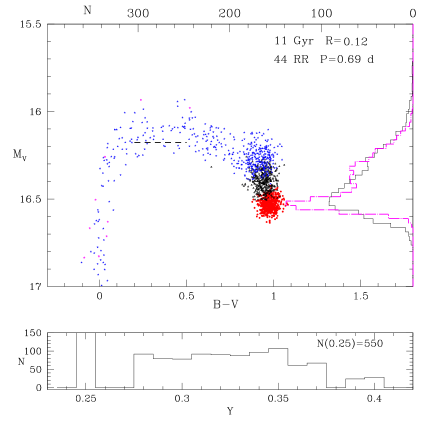

References
- Bedin et al. (2000) Bedin, L. R., Piotto, G., Zoccali, M., Stetson, P. B., Saviane, I., Cassisi, S., & Bono, G. 2000, A&A, 363, 159
- Bessell, Castelli, & Plez (1998) Bessell, M. S., Castelli, F., & Plez, B. 1998, A&A, 333, 231
- Buzzoni et al. (1983) Buzzoni, A., Pecci, F. F., Buonanno, R., & Corsi, C. E. 1983, A&A, 128, 94
- Carretta et al. (2006) Carretta, E., Bragaglia, A., Gratton, R. G., Leone, F., Recio-Blanco, A., & Lucatello, S. 2006, A&A, 450, 523
- Carretta & Gratton (1997) Carretta, E., & Gratton, R. G. 1997, A&AS, 121, 95
- Catelan et al. (2001) Catelan, M., Ferraro, F. R., & Rood, R. T. 2001, ApJ, 560, 970
- Clementini et al. (2005) Clementini, G., Gratton, R. G., Bragaglia, A., Ripepi, V., Fiorenzano, A. F. M., Held, E. V., & Carretta, E. 2005, ApJ, 630, L145
- Cohen & Meléndez (2005) Cohen, J. G., & Meléndez, J. 2005, AJ, 129, 303
- D’Antona et al. (2002) D’Antona, F., Caloi, V., Montalbán, J., Ventura, P., & Gratton, R. 2002, A&A, 395, 69
- D’Antona & Caloi (2004) D’Antona, F., & Caloi, V. 2004, ApJ, 611, 871
- D’Antona et al. (2005) D’Antona, F., Bellazzini, M., Caloi, V., Fusi Pecci, F., Galleti, S., & Rood, R. T. 2005, ApJ, 631, 868
- Gratton et al. (2001) Gratton, R. G. et al. 2001, A&A, 369, 87
- Iben (1968a) Iben, I., Jr. 1968a, Nature, 220, 143
- Iben (1968b) Iben, I., Jr. 1968b, ApJ, 154, 581
- Karakas et al. (2006) Karakas, A., Fenner, Y., Sills, A., Campbell, S., & Lattanzio, J. 2006, ArXiv Astrophysics e-prints, arXiv:astro-ph/0605540
- Lattanzio et al. (2004) Lattanzio, J., Karakas, A., Campbell, S., Elliott, L., & Chieffi, A. 2004, Memorie della Societa Astronomica Italiana, 75, 322
- Layden et al. (1999) Layden, A. C., Ritter, L. A., Welch, D. L., & Webb, T. M. A. 1999, AJ, 117, 1313
- Lee, Demarque, & Zinn (1994) Lee, Y., Demarque, P., & Zinn, R. 1994, ApJ, 423, 248
- Norris (2004) Norris, J. E. 2004, ApJ, 612, L25
- Piotto et al. (2002) Piotto, G., et al. 2002, A&A, 391, 945
- Piotto et al. (2005) Piotto, G., et al. 2005, ApJ, 621, 777
- Prantzos & Charbonnel (2006) Prantzos, N., & Charbonnel, C. 2006, astro-ph/0606112
- Pritzl et al. (2000) Pritzl, B., Smith, H. A., Catelan, M., & Sweigart, A. V. 2000, ApJ, 530, L41
- Pritzl et al. (2001) Pritzl, B. J., Smith, H. A., Catelan, M., & Sweigart, A. V. 2001, AJ, 122, 2600
- Pritzl et al. (2003) Pritzl, B. J., Smith, H. A., Stetson, P. B., Catelan, M., Sweigart, A. V., Layden, A. C., & Rich, R. M. 2003, AJ, 126, 1381
- Raimondo et al. (2002) Raimondo, G., Castellani, V., Cassisi, S., Brocato, E., & Piotto, G. 2002, ApJ, 569, 975
- Ramírez & Cohen (2003) Ramírez, S. V., & Cohen, J. G. 2003, AJ, 125, 224
- Reimers (1977) Reimers, D. 1977, A&A, 61, 217
- Rich et al. (1997) Rich, R. M. et al. 1997, ApJ, 484, L25
- Salaris et al. (2004) Salaris, M., Riello, M., Cassisi, S., & Piotto, G. 2004, A&A, 420, 911
- Siess (2006) Siess, L. 2006, A&A, 448, 717
- Smith (2006) Smith, G. 2006, AJ, submitted
- Sweigart & Gross (1976) Sweigart, A. V., & Gross, P. G. 1976, ApJS, 32, 367
- Sweigart & Catelan (1998) Sweigart, A. V., & Catelan, M. 1998, ApJ, 501, L63
- Thomas (1967) Thomas, H.-C. 1967, Zeitschrift fur Astrophysik, 67, 420
- van Albada & Baker (1973) van Albada, T. S., & Baker, N. 1973, ApJ, 185, 477
- Ventura et al. (2001) Ventura, P., D’Antona, F., Mazzitelli, I., & Gratton, R. 2001, ApJ, 550, L65
- Ventura, D’Antona, & Mazzitelli (2002) Ventura, P., D’Antona, F., & Mazzitelli, I. 2002, A&A, 393, 215
- Ventura & D’Antona (2005a) Ventura, P., & D’Antona, F. 2005a, A&A, 431, 279
- Ventura & D’Antona (2005b) Ventura, P., & D’Antona, F. 2005b, ApJ, 635, L149