The Spitzer View of Low-Metallicity Star Formation: I. Haro 3
Abstract
We present Spitzer observations of the blue compact dwarf galaxy (BCD) Haro 3, with an oxygen abundance of 12log(O/H) = 8.32. These data are part of a larger study of star formation and dust in low-metallicity environments. The IRS spectrum of Haro 3 shows strong narrow Polycyclic Aromatic Hydrocarbon (PAH) emission, with high equivalent widths. Gaseous nebular fine-structure lines are also seen. Despite the absence of optical high-excitation lines, a faint high-ionization [O iv] line at 25.89 µm indicates the presence of radiation as hard as 54.9 eV. A CLOUDY model suggests that the MIR lines originate in two regions: a low-extinction optically-emitting region, and an optically invisible one with much higher extinction. The morphology of Haro 3 changes with wavelength. IRAC 4.5 µm traces extended stellar photospheric emission from the body of the galaxy and hot dust continuum coming mainly from star-forming regions; 8 µm probes extended PAH emission coming mainly from the general ISM; MIPS 24 and 70 µm images map compact small-grain warm dust emission associated with active star formation, and 160 µm reflects cooler extended dust associated with older stellar populations. We have derived the optical-to-radio spectral energy distribution (SED) of the brightest star-forming region A in Haro 3. The best-fit DUSTY model of the SED gives a total luminosity of 2.8109 L☉ and a mass of 2.8106 M☉ for the ionizing clusters. We infer an extinction AV3, intermediate between the optical AV 0.5 and the radio AV 8, consistent with the picture that longer wavelength observations probe more deeply into star-forming regions.
1 Introduction
ISO, together with COBE and SCUBA, has shown convincingly that dusty star formation plays a key role in the early universe. ISOCAM has identified a significant population of dusty active starburst galaxies, the ultraluminous infrared (IR) galaxies (ULIRG), at , which account respectively for 30% and 10% of the far-IR (FIR) and submm backgrounds (Genzel & Cesarsky, 2000), which in turn account for half of the total extragalactic background. Submm observations (e.g., SCUBA, Hughes et al., 1998) suggest that the remaining fractions are also due to ULIRGs, but at higher redshifts (). That dust plays such an important role in the high-redshift universe may appear surprising, as it is usually thought that in the early stages of galaxy formation, when the gas is still relatively metal-free, dust was virtually absent. This assumption however has been challenged by mid-IR (MIR) observations of one of the most metal-poor star-forming galaxies known, SBS 0335052 E (Thuan, Sauvage, & Madden, 1999; Plante & Sauvage, 2002; Houck et al., 2004b). In this local blue compact dwarf galaxy (BCD) at a distance of 54 Mpc and with a nebular heavy element abundance of only 12log(O/H) = 7.3, a large amount of dust ( ) hides most ( 75%) of the current star-forming activity from view (Hunt, Vanzi, & Thuan, 2001; Plante & Sauvage, 2002; Houck et al., 2004b).
Thus, to interpret the spectra of high-redshift galaxies, it is crucial to understand how and when this ubiquitous dust component is formed and how it affects the spectral energy distribution (SED) of galaxies by redistributing the ultraviolet-optical energy radiated by the young stars in the star-forming regions to MIR and FIR wavelengths. Such an understanding is needed if we are to use these SEDs to derive photometric redshifts and the star formation rate as a function of cosmic epoch. Indeed, the optical-radio SEDs of seven nearby BCDs show several significant deviations from the standard templates of the evolved and massive starbursts (e.g., M 82 and Arp 220) frequently used to derive photometric redshifts of submm/mm sources (Hunt et al., 2005). First, the location of the infrared bump implies generally warmer dust temperatures, with SBS 0335052 E being the most extreme case of short-wavelength turnover (Houck et al., 2004b; Hunt et al., 2005). Second, the mid-IR spectra of BCDs show very weak or no Aromatic Features in Emission (e.g., PAHs), in contrast to the strong PAH features seen in the spectra of normal starburst galaxies (see also Wu et al., 2006). There is evidence that these characteristics may be more common at high redshift; the SEDs of distant SCUBA/VLA sources tend to be better fit with the SEDs of highly extinguished star clusters (as in the BCD II Zw 40) than with those of M 82 and Arp 220 (Hunt & Maiolino, 2005).
Here we present data from our Spitzer Cycle 1 program which include spectroscopic, photometric and imaging observations of more than 20 BCDs with metallicities ranging from 1/30 to 1/4 that of the Sun111Adopting the solar calibration of Anders & Grevesse (1989).. Besides studying the SEDs of BCDs in the infrared, we also wish to investigate star formation in metal-poor environments and how star formation parameters and dust properties change as a function of metallicity. While much progress has been made in finding large populations of galaxies at high redshifts ( Steidel et al., 2003), truly young galaxies in the process of forming remain elusive in the distant universe. The spectra of those far-away galaxies generally indicate the presence of a substantial amount of heavy elements, indicating previous star formation and metal enrichment. In the hierarchical picture of galaxy formation, large galaxies are formed from the assembly of small ones. Therefore, because of their low mass and chemically unenriched interstellar medium (ISM), BCDs are possibly the closest examples we can find of the elementary units from which galaxies formed. Their relative proximity allows studies of their dust content with a sensitivity, spectral and spatial resolution that faint distant high-redshift galaxies do not permit.
In this first paper of a series, we discuss the most metal-rich object in our sample, Haro 3 = NGC 3353 = Mrk 35. Haro 3 has a heliocentric radial velocity of 969 km s-1 (Thuan & Izotov, 2005) which gives a distance of 16.3 Mpc, adopting a Hubble constant of 70 km s-1 Mpc-1 and correcting for the Virgocentric flow. The present distance is about 25% larger than the old distance of 13.1 Mpc used by previous investigators who did not correct for Virgocentric flow. The blue apparent magnitude is of Haro 3 is 13.2 (RC3), which corresponds to a blue absolute magnitude of .
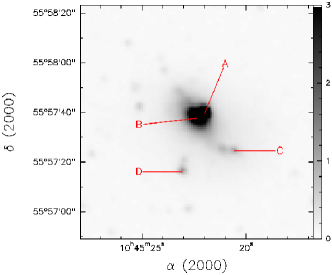
With its known population of Wolf-Rayet stars (Steel et al., 1996; Thuan & Izotov, 2005), Haro 3 is an ideal object for studying star formation in its relatively early stages. Optical band observations by Steel et al. (1996) show that Haro 3 hosts several star-forming regions. In order of decreasing brightness, there is first an off-center very blue star-forming region (A: we adopt here the nomenclature of Steel et al. 1996); a nuclear emission region (B); two faint star-forming knots (C) associated with the tidal tail which extends to the south-west of the galaxy; and one or more faint knots to the south (D). These star-forming regions are labeled in the 4.5 µm IRAC image of Haro 3 (to be discussed later) in the left panel of Fig. 1. Near-IR (NIR) and high-resolution VLA radio observations by Johnson et al. (2004) demonstrate that the current star formation in Haro 3 is most active in region A, with a star formation rate of 0.6 M☉ yr-1 and a total mass of young stars of 106 M☉ within a region of 0.1 kpc radius. Region A is also the youngest star-forming region in Haro 3, with clusters of ages 5 Myr. While the Balmer decrement yields an extinction AV = 0.5 mag, Johnson et al. (2004) found that the Br and radio fluxes imply a larger extinction in region A, AV 8. As for the clusters in region B, they are slightly older, with ages 8–10 Myr (Johnson et al., 2004). High-resolution HST/WFPC2 F606W imaging of Haro 3 by Malkan et al. (1998) shows that regions A and B are separated by a conspicuous dust lane. The various star-forming regions are superimposed on an underlying low-surface-brightness component with somewhat irregular contours, so that Haro 3 is of type iI222iI refers to a complex central structure (star-formation zones not located at or near the center) and outer irregular isophotes. The most common BCD morphology is iE in which the centers show complex structure surrounded by outer circular or elliptical isophotes. in the BCD morphological classification of Loose & Thuan (1985). Its redder color suggests that it is composed of older stars made in previous episodes of star formation. A tidal tail to the south-west is clearly seen in the HST image of Malkan et al. (1998), suggesting that some of the present star formation may have been triggered by a merger with another dwarf galaxy or Hi cloud. Johnson et al. (2004) proposed that the Hi properties of Haro 3 may be suggestive of a small-scale interaction, although higher resolution Hi imaging would be necessary to confirm this.
Spectroscopy of region A by Izotov & Thuan (2004) and Thuan & Izotov (2005) gives oxygen abundances of 12log(O/H) = 8.300.01 and 8.340.01 respectively, in good agreement with the value 12log(O/H) = 8.370.06 obtained earlier by Steel et al. (1996). If we adopt 12log(O/H) = 8.32 and a solar oxygen abundance of 12log(O/H) = 8.91 (Anders & Grevesse, 1989), Haro 3 would have a metallicity of about 1/4 that of the Sun. If, instead, we adopt the new solar calibration of Asplund et al. (2005) with 12log(O/H) = 8.65, then Haro 3 would have a metallicity of 1/2 solar.
We describe our new Spitzer observations and their reduction in Section 2. In Section 3, we present the spectroscopic results, and discuss the PAH features and the IR fine-structure lines. We also compare the observed IR emission-line intensities with those predicted by a CLOUDY (Ferland, 1996; Ferland et al., 1998) photoionization model based on the observed optical emission line fluxes. The IR morphology of the star formation in Haro 3 is described in Section 4. In Section 5, we construct a SED of Haro 3 from 1 µm to 3.6 cm based on our Spitzer and literature data. Grain properties and characteristics of the brightest emission region are derived by fitting the SED with a DUSTY model (Ivezić & Elitzur, 1997; Ivezić et al., 1999). We discuss Haro 3 in a general context in Section 6 and summarize our conclusions in Section 7.
2 Observations and Data Reduction
As part of our Cycle 1 Spitzer proposal (PID 3139: P.I. Thuan), we have observed Haro 3 with IRS (Houck et al., 2004a) in the low- and high-resolution modules (SL, SH, LH); with IRAC (Fazio et al., 2004) at 4.5 and 8 µm; and with MIPS (Rieke et al., 2004) at 24, 70, and 160 µm. The data were acquired over a period of several months on 17 Nov 2004 (IRS), 23 Nov 2004 (IRAC), and 3 Apr 2005 (MIPS). For all instruments, we started the data reduction with images processed by the Spitzer Science Center (SSC) pipeline, i.e. the Basic Calibrated Data (bcd) and the corresponding masks (the DCE masks). The masks flag potential spurious features in the images, such as strong radiation hits, saturated pixels, or nonexistent/corrupted data.
2.1 IRS Spectra
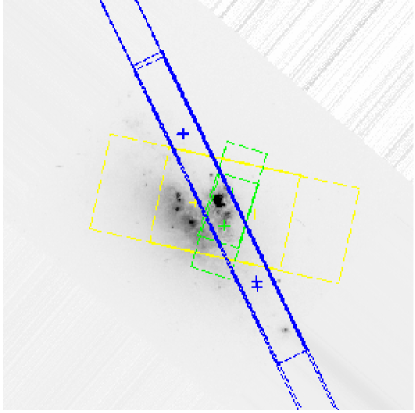
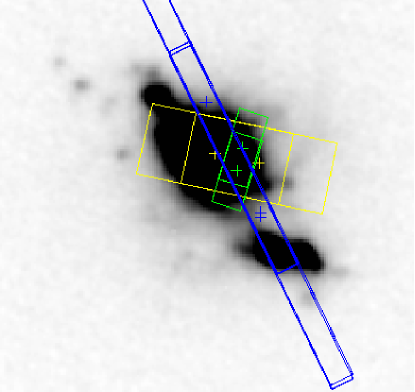
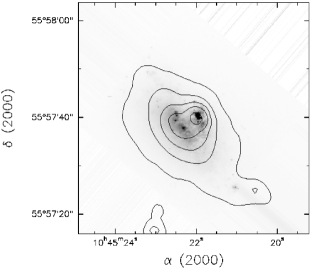
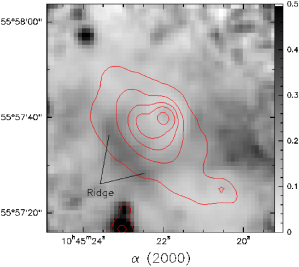
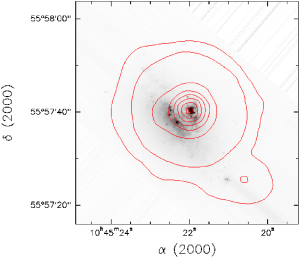
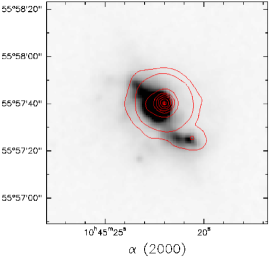
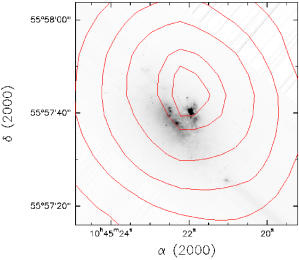
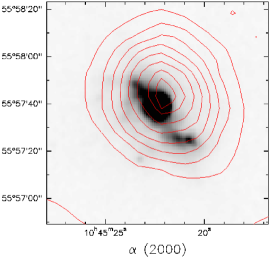
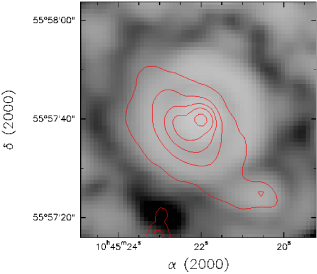
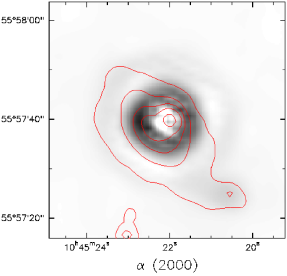
Spectroscopy was performed in staring mode with the Short Low module in both orders (SL1, SL2) and with both Short and Long High-resolution modules (SH, LH) (Houck et al., 2004a). These give low-resolution spectra from 5.2 to 14.5 µm (R64-128), and high-resolution spectra from 9.6 to 37.2 µm (R600). We obtained 30s4 cycles for SH, 14s8 for LH, 6s3 for SL1, and 6s6 for SL2. Sources were centered in the slits by peaking up and offsetting from 2MASS stars. Figure 2 shows the positions of the three different slits across Haro 3; in the left panel, the slits are superimposed on the HST/WFPC2 F606W image (Malkan et al., 1998) and in the right panel on the image of Gil de Paz et al. (2003). It can be seen that all three slits include region A.
It is necessary to accurately subtract the background before spectrum extraction. Because of the dominance of the background signal, the accuracy of this process strongly influences the quality of the final spectrum. We started the spectral reduction with the individual bcd frames processed by the S11.0.2 version of the SSC pipeline, which provides ramp fitting, dark current subtraction, droop and linearity corrections, flat-fielding, and wavelength and flux calibrations333See the IRS Data Handbook, http://ssc.spitzer.caltech.edu/irs/dh.. However, the pipeline does not include background subtraction. Hence, for the low-resolution spectra, we constructed a coadded background frame from the bcd observations with the source in the opposing nod and off-order positions (see also Weedman et al., 2005). When the source is in SL1, the SL2 slit samples background, and vice versa. This makes it possible to include the off-order frames in the background image since the same on-chip integration times were used for both SL orders. The image for the source at a given nod position was constructed by coadding all frames at that position. Coadding was performed with the sigma-clipping option of the imcombine task in IRAF444IRAF is the Image Analysis and Reduction Facility made available to the astronomical community by the National Optical Astronomy Observatory, which is operated by AURA, Inc., under contract with the U.S. National Science Foundation.. The inclusion of off-order and off-nod frames in the background image means that the integration time on the background is three times that on the source, which improves the signal-to-noise of the two-dimensional (2D) subtraction.
For the high-resolution SH and LH spectra, a 2D background image could not be constructed because of the small size of the slit. Therefore we subtracted the background from the SH and LH observations using the one-dimensional (1D) spectra as described below. The SH and LH 2D bcd images were coadded as for the SL modules, and successive corrections for sporadic bad pixels and cosmic ray hits were carried out manually by inspection of the images at the separate nod positions.
We extracted the source spectra with SPICE, the post-pipeline IRS package furnished by the SSC. To maximize the calibration accuracy, the automatic point-source extraction window was used for all modules. The automatic extraction uses a variable-width extraction window which scales with wavelength in order to recover a constant fraction of diffraction-limited instrument response. For the SL spectra, this gives a 4-pixel (72) length at 6 µm, and an 8-pixel one (144) at 12 µm; the slit width is 36 for both SL modules. At high resolution, the SPICE extraction is performed over the entire slit (47113 SH; 111223 LH). Orders were spliced together by averaging, ignoring the noisy regions at the red end of each order (e.g. Armus et al., 2004). Then the individual spectra were box-car smoothed to a resolution element, and clipped in order to eliminate any remaining spikes in the high-resolution data. Finally, the two spectra for each module (one for each nod position) were averaged.
Background was subtracted from the 1D SH spectra by minimizing the difference between the 2D background-subtracted SL and SH spectra over the substantial (5 µm) overlap in wavelength. We adopted the model of Reach and coworkers555See http://ssc.spitzer.caltech.edu/documents/background. for the spectral shape of the background, and the multiplicative constant was given by the minimization. The LH background was subtracted by minimizing the difference between the SH and LH spectra over their overlap region (1 µm).
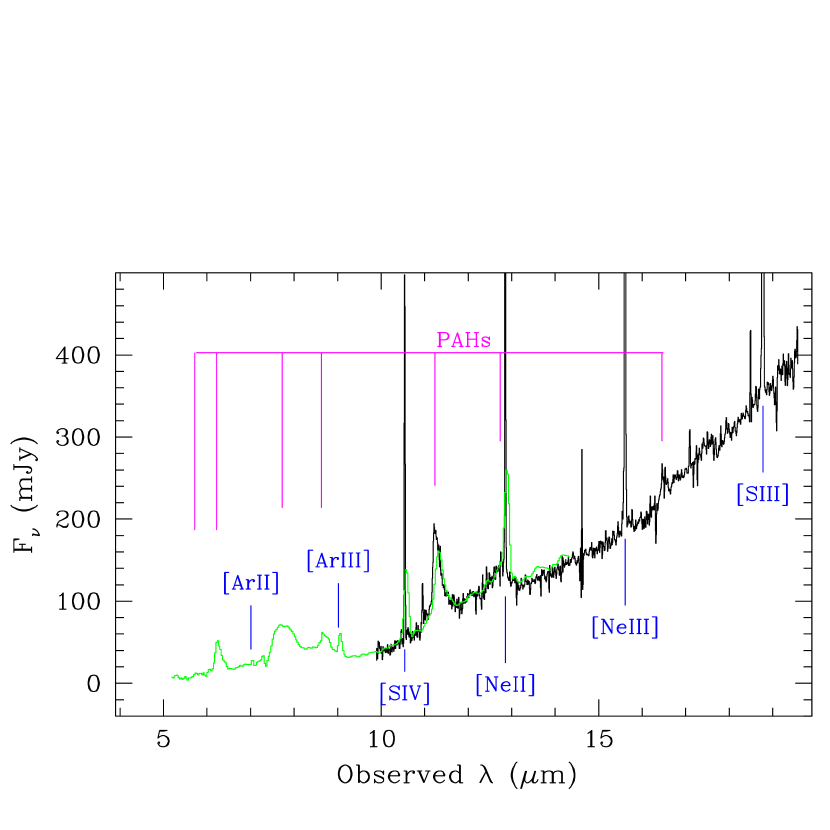
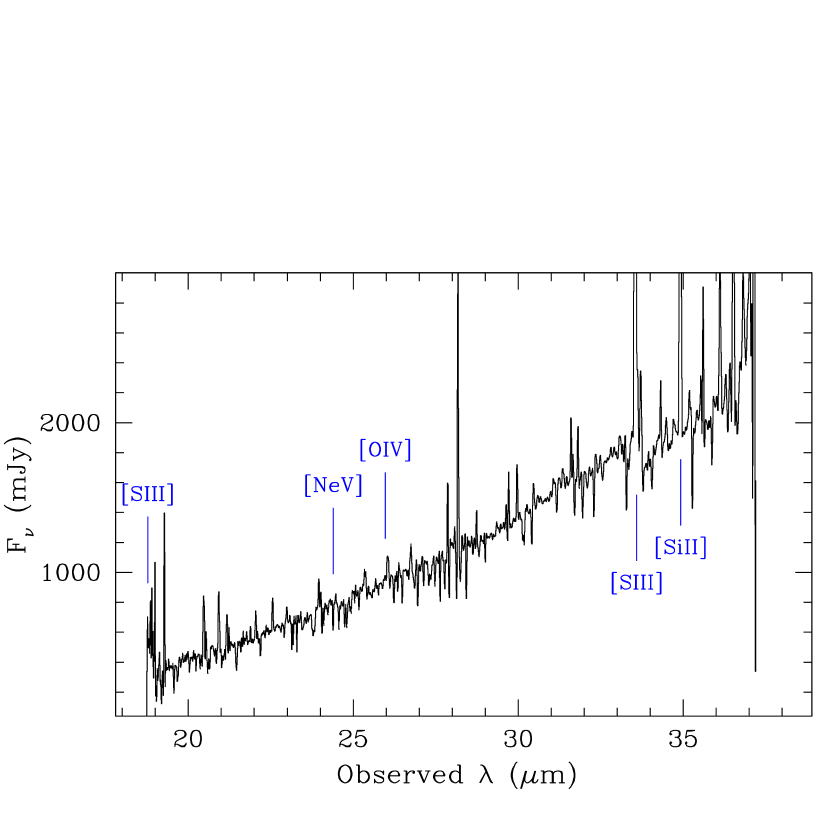
The final averaged IRS spectra obtained in the short-wavelength low-resolution mode (SL) and in both short and long wavelength high-resolution modes (SH, LH) are shown in Fig. 3.
2.2 IRAC Images
We designed our IRAC Astronomical Observation Requests (AORs) to give four (high-dynamic range666This AOR option gives two sets of four frames each: one with the specified integration time, and one with a shorter time, typically 1s.) IRAC frames of 30s; only channels 2 (4.5 µm) and 4 (8.0 µm) were acquired. Small-scale dithering in a “cycling” pattern was performed with a total of 120s spent in each IRAC channel.
The individual bcd frames were processed with the S11.0.1 version of the SSC pipeline (see the IRAC Data Handbook777Available from the SSC website http://ssc.spitzer.caltech.edu/irac/dh/). This processing is designed to remove the effects of dark current, detector nonlinearity, flat field, multiplexer bleeding, and cosmic rays, and to perform flux calibration. However, in some cases, those with particularly bright sources in the field-of-view, the pipeline is unsuccessful at removing all artefacts. In the case of Haro 3, the bright point-like source at the center of the galaxy resulted in a “banding” effect in the 8 µm image, i.e. in an artificially enhanced brightness level in the rows and columns containing that bright source (see the IRAC Data Handbook). The 4.5 µm image was not affected by banding since it occurs only in the Si:As arrays (channels 3 and 4). Dithering does not eliminate the effect because the position of the bands on the array remains unchanged relative to the galaxy. Moreover, because the intensity of the brightness enhancement decreases with distance from the bright source, it is not straightforward to correct automatically. We eliminated the effect from each 8 µm frame by interpolating the feature across the affected rows, substituting the spurious pixel values with those of a typical background.
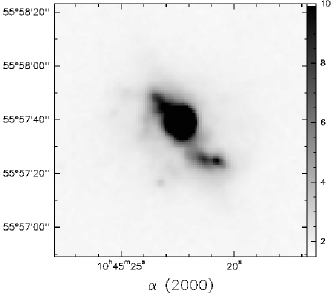
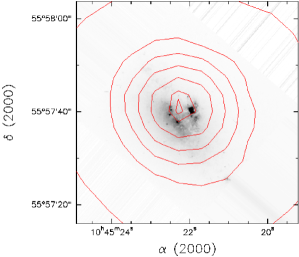
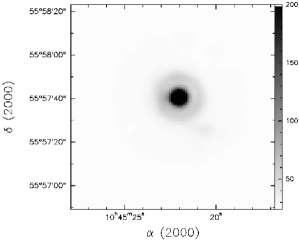
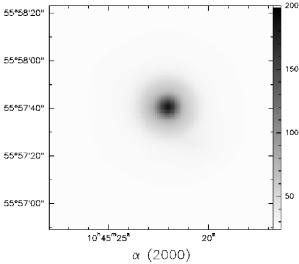
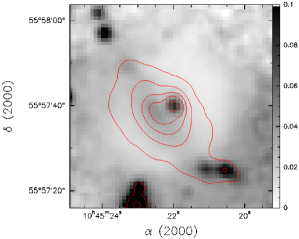
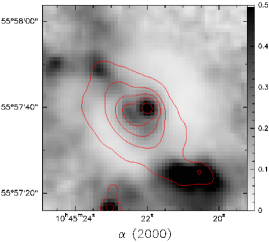
The bcd frames (corrected for “banding” effects in the case of the 8 µm ones) were coadded using MOPEX, the image mosaicing and source-extraction package provided by the SSC (Makovoz & Marleau, 2005). Pixels flagged by the DCE masks and by the static bad-pixel masks (pmasks) were ignored. Additional inconsistent pixel values were removed by means of the MOPEX outlier rejection algorithms. We relied on the dual-outlier technique, together with the multiframe algorithm, rather than using any spatial criteria for rejection. The frames were corrected for geometrical distortion and projected onto a “fiducial” (refined) coordinate system with pixel sizes of 120, roughly equivalent to the original pixels. Standard linear interpolation was used for the mosaics. The noise levels in our post-pipeline MOPEX mosaics are comparable to or lower than those in the SSC products. The final coadded 4.5 and 8.0 µm images are shown respectively in the left and right panels of Fig. 1. We also show 4.5 µm contours superimposed on the HST/WFPC2 F606W image of Malkan et al. (1998) in Fig. 4. Examination of Fig. 4 shows that the 4.5µm peak coincides with the bright optical point source associated with the compact radio emission (Johnson et al., 2004).
2.3 MIPS Images
Our MIPS images were acquired in the Fixed Cluster-Offset mode in all three channels, with offsets of 12″ in two additional pointings. We used ramp times of 3s, 10s, and 10s for 24µm, 70µm, and 160µm, respectively, with 1, 2, and 6 cycles in the three channels. This gave us a total of 32 frames at 24µm, 56 frames at 70µm, and 104 frames at 160µm. Because the first data frame of each observation sequence at 24µm has a shorter exposure time, we discarded those frames with keyword DCENUM = 0; we also removed the second frame (DCENUM=1) because of increased data artefacts (see the MIPS Data Handbook888Available from the SSC website http://ssc.spitzer.caltech.edu/mips/dh/); this left us with 24 frames at 24µm.
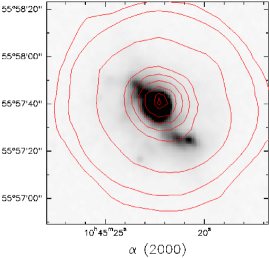
The individual bcd frames were processed by the S11.4.0 version of the SSC pipeline, which converts the integration ramps inherent to the MIPS detectors into slopes, and remediates temporal variation of the slope images (Gordon et al., 2005). The processing includes correcting for stimulator flashes on the MIPS-Ge detectors, dark subtraction, flat-fielding, and flux calibration. As for the IRAC images, we processed the dithered bcd frames in the spatial domain with MOPEX. The DCE masks and the static masks were used to flag pixels, and subsequently ignore them. The MOPEX outlier rejection was used to flag any additional spurious pixel values, with the dual-outlier and multiframe algorithm as for the IRAC frames. Geometrical distortion was corrected before projecting the frames onto a fiducial coordinate system with pixel sizes of 120 for MIPS-24, roughly half of the original pixel size of 25. Pixel sizes of the final mosaics at 70 and 160µm are also approximately half of the originals, i.e. 495 at 70µm and 80 at 160µm. Unlike the IRAC coadds, we incorporated the sigma-weighting algorithm because we found it gave less noisy MIPS mosaics than without. Standard linear interpolation was used in all cases. In all three channels, our post-pipeline MOPEX mosaics are superior to those provided by the automated post-pipeline reduction. The final coadded images are shown in Fig. 5 as contours superimposed on the HST/WFPC2 (left panel) and on the IRAC 8 µm images (right panel).
2.4 IRAC and MIPS Photometry
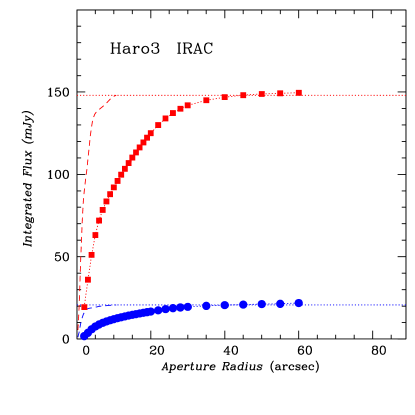
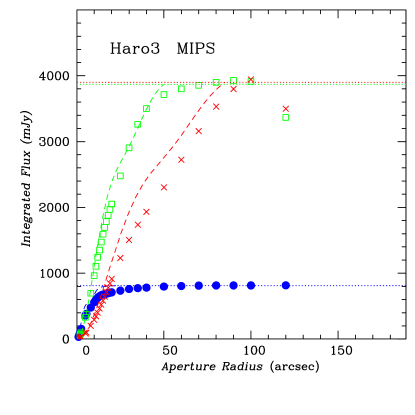
We have performed aperture photometry on the IRAC and MIPS images with the IRAF photometry package apphot, taking care to convert the MJy/sr flux units of the images to integrated flux. The background level was determined by averaging several adjacent empty sky regions. The photometric growth curves are shown in Fig. 6, for IRAC in the left panel, and for MIPS in the right panel. We have also made photometric measurements of the instrument point response functions (PRFs), provided in the MOPEX package999We used the most recent determinations of the PRFs dated 5 October 2005.; the dashed lines show the growth curve expected from a point source, normalized to the total flux indicated by horizontal dotted lines in Fig. 6.
Inspection of Fig. 6 shows that Haro 3 is clearly extended at IRAC wavelengths (4.5 and 8 µm), and possibly at 160µm, but appears virtually point-like at 24 and 70 µm. The morphology of the 24 µm image is essentially that of a point source (see Fig. 5). To check for source extension, we have fitted elliptical gaussians to the brightest source in the IRAC and MIPS-24 images. The width (equal to the gaussian ) of these fits is 24 in both the IRAC and MIPS-24 images, which implies that, indeed, the source is quite extended at IRAC wavelengths, but more point-like at 24µm. However, at 24 µm, the diffraction limit is 6″, implying that the gaussian fit is too narrow; moreover the 24µm flux resulting from this fit may be too low (see 5), because the fit does not account for the substantial flux in the first Airy ring. The fraction of total flux contained in the gaussian-like source is 40%, 30%, and 58%, at 4.5, 8.0, and 24 µm, respectively. The total IRAC and MIPS fluxes are given in Table 1, along with other published near-infrared, far-infrared and radio photometry on Haro 3. For the Spitzer photometry, we adopt a global uncertainty of 10%, which should account for the various contributions to the uncertainties, including flux calibration and imperfect sky subtraction.
2.5 Comparison With Previous Work
Haro 3 was observed with the Infrared Space Observatory (ISO) by Metcalfe et al. (1996) and by the Infrared Astronomy Satellite (IRAS) (Table 1). The flux measured in the ISO LW6 filter (7-8.5µm) of 14930 mJy is in excellent agreement with the total flux of 148 mJy measured in the 8µm channel of IRAC. The total flux of 30070 mJy given by Metcalfe et al. (1996) in the ISO 12-18µm LW3 filter is also consistent with the IRS spectrum, considering that Haro 3 is slightly extended at these wavelengths. The IRS spectrum levels generally agree well with other measurements, implying that the background subtraction is reliable.
Our measured Spitzer 24µm total flux of 81081 mJy agrees well with the IRAS flux of 94257 mJy at 25µm. The MIPS long-wavelength fluxes at 70 and 160µm of 3.9 Jy are slightly lower than the IRAS fluxes of 4.9 (60 µm) and 6.7 (100 µm) Jy taken from NED101010The NASA/IPAC Extragalactic Database (NED) is operated by the Jet Propulsion Laboratory, California Institute of Technology, under contract with the National Aeronautics and Space Administration.. But given that they are measured in smaller apertures, our fluxes are consistent with those of IRAS. We conclude that our measurements are in general good agreement with previous existing data and that we can have confidence in our reduction procedures. We next discuss how our Spitzer data, combined with optical, near-infrared and radio data, can constrain the properties of the stellar populations, the ionized gas and the dust, and help us to construct a picture of the star formation in Haro 3.
3 Spectroscopic results
Polycyclic Aromatic Hydrocarbon (PAH) emission from small dust grains and gaseous nebular line emission are visible in the IRS spectrum of Haro 3 (Fig. 3). These features are superimposed on a steeply rising continuum which peaks around 100 µm111111This is where the flux distribution peaks (see Table 1); the SED (energy distribution) peaks at 40 µm..
3.1 PAH Features
Examination of the IRS spectra in Fig. 3 shows that there are PAH features clearly detected at 5.7, 6.2, 7.7, 8.6, 11.2, 12.7, and 16.4 µm. We have derived the flux and equivalent width (EW) of these features by fitting the SL and SH spectra with a series of lorentzian profiles of unknown width, amplitude, and central wavelength. Because of their broad low-intensity wings, the PAH features are better fit with lorentzian than with gaussian profiles. The fits were performed with the splot task in IRAF. The continuum was linearly interpolated in two sections, one from 6-9 µm, and the other from 10.5-13.9 µm. The best-fit parameters, averaged over several independent estimates in both high and low resolution spectra, are given in Table 2. The flux of the 12.7 µm PAH feature is probably overestimated because of the difficulty in separating it from the bright [Ne ii] fine structure line (see 3.2).
Our derived values are in general agreement with those based on ISO spectra (Metcalfe et al., 1996). There is however a large difference in the slope of the continuum between the ISOPHOT and IRS spectra. The ISOPHOT continuum is nearly flat while the IRS one is continuously rising toward longer wavelengths (Fig. 3). We interpret this continuum slope difference as due to the fact that different regions in Haro 3 are sampled by ISOPHOT and IRS, as a result of the different apertures in the two instruments. The ISO PHT-S beam is ″( 2 kpc), considerably larger than the IRS apertures. For the latter, the slit width is 36 for both SL modules, while it is 47113 for the SH module and 111223 for the LH module. This means that, while the IRS apertures include mainly radiation from the star-forming region A, the ISO aperture encompasses a large part of the interstellar medium (ISM) around region A. So the spectrally flat PAH emission seen by ISOPHOT comes from the general extended ISM in Haro 3 while the strong rising MIR continuum emission seen by IRS is related to the more compact star-forming region A.
The relative strengths of the three main PAH emission features can be used as diagnostics to identify PAH sizes and infer the neutral-to-ionized gas ratio (Draine & Li, 2001). According to the models of Draine & Li (2001) and the observed flux ratios of the and features, the PAHs in Haro 3 are predominantly neutral and small, containing a few hundred carbon atoms, similar to the normal galaxies studied by Helou et al. (2000). In other words, Haro 3 lies in the “normal galaxy” region in the PAH diagnostic diagram rather than in the starburst galaxy region which includes objects such as M 82 and NGC 253, that are dominated by ionized PAHs. This again supports our previous contention that the PAHs in Haro 3 arise mainly from the normal ISM around the star-forming region, not only from knot A itself.
On the other hand, the PAH EWs are generally high, for the 7.7 µm line, more typical of starburst galaxies (Brandl et al., 2004) than of BCDs (Wu et al., 2006). This result may not be surprising as Haro 3 with MB = is at the bright end of the luminosity function of dwarf galaxies, but it contrasts with the flux ratio trends described above. Overall, Haro 3 follows the metallicity trends of increasing PAH EW with increasing oxygen abundance reported by Wu et al. (2006) and discussed by Hogg et al. (2005) and Engelbracht et al. (2005). However, for its metallicity, the EWs of the ionized PAHs in Haro 3 exceed by 50% to up to almost a factor of three that of most extreme BCD in the Wu et al. (2006) sample. In contrast, the neutral PAH at 11.2 µm has an EW of 0.6, typical of other BCDs.
Finally, we find that the PAH emission features in Haro 3 are narrow, narrower than many of the objects tabulated by Li & Draine (2001). The only objects which possess PAH features with smaller widths at 7.7 µm are the Small Magellanic Cloud, the reflection nebulae/photodissociation region NGC 7023, and 30 Doradus in the Large Magellanic Cloud. M 82 and NGC 253 have slightly broader PAH features than these objects or Haro 3, but the difference may not be significant. However, different PAH features tend to have systematically different FWHMs (Li & Draine, 2001), so that to make a more definitive statement, we must wait for more data and a more uniform method of measuring PAH parameters (e.g., PAHFIT : Smith et al., 2006). Perhaps not surprisingly, Haro 3’s PAH features are also narrower than those predicted by the model for the diffuse Galactic ISM at high latitudes (Li & Draine, 2001). We have tried to subtract a scaled version of the model spectrum from the observed spectrum of Haro 3, but because of the narrowness of the features and their lower equivalent widths (because of the rising continuum), the scaled subtraction leaves significant residuals. We conclude that there are many factors behind the appearance of PAH features (e.g., chemical abundance, ISM energetics, etc.). Thus even though our IRS spectrum may contain a conspicuous ISM component, Galactic ISM spectra may not be a good template for all ISM PAH emission.
3.2 Infrared Fine-Structure Lines
The spectrum also shows several fine-structure lines, including the highest signal-to-noise detections [S iv]10.51, [Ne ii]12.81, [Ne iii]15.55, 36.01, [S iii]18.71, 33.58, [O iv]25.89, and [Si ii]34.82 µm. As for the PAH features, we used splot to fit the IR fine-structure emission lines and obtain fluxes and EWs. A deblending procedure was adopted to accurately measure the emission lines at wavelengths near PAH features (e.g., [Ar iii] and [Ne ii]). Unlike the PAHs, the lines were best fit with a gaussian profile. A single continuum was linearly interpolated from 10.5 to µm. For the longer wavelengths, the local continuum was fit by linearly interpolating over adjacent line-free regions. The fluxes and other parameters resulting from the fits are reported in Table 3.
Several fairly high-excitation lines are detected in Haro 3. The [O iv] line at 25.89 µm is faint, but present. [O iv] is a high excitation line, with an excitation potential of 54.9 eV, just beyond the Heii edge at 54 eV. Its detection is consistent with the Wolf-Rayet population present in Haro 3’s starburst (Steel et al., 1996; Thuan & Izotov, 2005). Thuan & Izotov (2005) have looked in the optical spectrum of Haro 3 for the high-ionization [Fe v] 4227 and Heii 4686 nebular emission lines which both have an ionization potential of 54.4 eV. None were seen. Evidently, the observed optical ionizing radiation is less hard than that in the MIR range. This may suggest the presence of substantial extinction in the blue, or indicate that the optical and MIR radiations come from different locations in the star-forming region A, or both (see also 3.3 and 5).
Line ratios of different ionic species of the same element, e.g., [Ne iii] and [Ne ii], are sensitive to the shape of the ionizing radiation field. The ratio of the [Ne iii] and [Ne ii] lines is 2.8, placing Haro 3 toward the high-excitation end of the starbursts studied by Verma et al. (2003), and similar to NGC 5253. Because PAHs tend to be depleted in hard radiation fields, their EW would be expected to be negatively correlated with the [Ne iii]/[Ne ii] line ratio. Such a trend was indeed found by Wu et al. (2006) for their BCD sample. However, compared to the Wu et al. (2006) correlation, the PAHs in Haro 3 tend to have higher EWs for their metallicity than other BCDs. This may again be due to a significant PAH component from the general ISM in Haro 3 as compared to the BCDs studied by Wu et al. (2006), as the region of Haro 3 encompassed by the IRS slit is relatively large, about 500 pc. It could also arise from different measurement techniques, as Wu et al. (2006) fit a spline to the underlying continuum, while we linearly interpolate over two sections of “global” continua.
We can estimate the electron density with the temperature-insensitive [S iii] lines. The flux ratio is 2.5, well into the low-density limit (Draine, 2006). The implied electron density is 100 cm-3, lower than the optically-derived value of 18030 cm-3 by Izotov & Thuan (2004) from the [S ii] 6717/6731 ratio. Even with a maximum uncertainty on the [S iii] flux ratio of 20%, these two densities are inconsistent. Beam dilution could be affecting the MIR line ratios, since the IRS aperture is several times larger than the optical one. Alternatively, this discrepancy could be again suggesting that the optical emission comes from a different spatial location in the star-forming region A as compared to the MIR emission.
3.3 CLOUDY Models
Since the amount of hard radiation and the electron number density implied from the optical and MIR spectra appear to differ, it is interesting to ask whether we can construct a photoionization model which is consistent with both the optical and MIR line intensities. The photoionization model will concern only region A as both the optical and MIR slits include only that region. Radio observations of Johnson et al. (2004) show it to be composed of two main sources (A1 and A2) and a third much fainter one (A3), separated by the angular distance 1″. Therefore, optical and MIR spectra in fact include the contribution of all three regions because of the relatively large apertures. All three sources are thermal, indicating that the radio emission is from Hii regions.
To construct a photoionized Hii region model of region A, we have used the CLOUDY code (version c05.07, Ferland, 1996; Ferland et al., 1998). We first ran a series of models assuming that both the optical and the MIR light originate in the same region, characterized by the Balmer-decrement derived extinction (AV = 0.52 mag). While entirely consistent with the optical line emission, these simple models underestimate the MIR line fluxes by factors of 5 or more.
We then developed a series of two-component models: region A1 characterized by the Balmer-decrement derived extinction (AV = 0.52 mag), and region A2, invisible in the optical. The implicit assumption here is that the extinction AV in A2 is 6 mag or so, consistent with the absence of A2 in the HST optical image (Johnson et al., 2004). Hence, only A1 contributes to the optical emission, while both A1 and A2 contribute to the emission in the MIR. We neglect the contribution of region A3 as it is much less luminous than regions A1 and A2. The dust responsible for the extinction is assumed to lie outside of the Hii region, rather than mixed with the ionized gas.
The parameters of the Hii region model for A1 were adjusted such that it best reproduces the optical nebular emission-line intensities in Haro 3 as observed by Izotov & Thuan (2004). Several input parameters are needed for this. The first is the observed flux of the emission, corrected for the optically derived extinction AV = 0.52 mag, of 4.5910-13 erg s-1 cm-2. This corresponds to a luminosity () = 1.451040 erg s-1, or a number of ionizing photons QLyc = 3.051052 s-1. The latter value is consistent with that derived by Johnson et al. (2004) for region A1 from the VLA radio continuum observations (after adjusting the distance). Another input parameter is the ionizing stellar radiation. We incorporate a Costar model (Schaerer & de Koter, 1997) with a SED corresponding to that of a main-sequence star with an effective temperature of 40600 K. We adopt a spherical ionization-bounded Hii region model with an inner radius of 1019 cm, a constant density of 100 cm-3, and a filling factor of 0.005. The chemical composition of the Hii region is shown in Table 4. Only three parameters are fixed: QLyc, the filling factor, and the gas number density. All other parameters were varied to obtain the best coincidence of the observed and modeled line intensities in the optical range (Table 5). With this model for A1, we obtain good or reasonable agreement for nearly all the optical line intensities. They correspond in general to element abundance ratios typical of solar ones except for a slightly lower N/O abundance ratio. The exception is iron. To fit the observed [Fe iii] 4658, 5270 emission lines, we needed to adopt a Fe/O abundance ratio which is about one order of magnitude lower than the solar one. This suggests that iron is highly depleted in Haro 3, probably onto dust grains, implying the presence of a significant amount of dust in Haro 3. Our subsequent estimate of the dust mass (5) confirms this conclusion.
For region A2, we have no constraints in the optical range for its H ii region model. Therefore, we adopt for this region the same parameters as for region A1 except for the number of ionizing photons QLyc (i.e., luminosity) and filling factor. According to Johnson et al. (2004) QLyc for A2 is 1.5 times greater than for region A1. Thus, we assume that the intrinsic, i.e. extinction-corrected, flux of the emission line in region A2 is 1.5 times greater than that in region A1. As for the filling factor, we adopt it to be 0.0025 in region A2, lower than that for A1, because of the more diffuse morphology of A2 in the radio map by Johnson et al. (2004).
The 05.07 version of CLOUDY includes the calculation of line intensities in the MIR range. We combine both models for regions A1 and A2 to fit the observed intensities of the MIR lines. In Table 6, we compare the observed and predicted intensities of the MIR lines listed in Table 3. Columns 2 and 5 show the observed and predicted intensities for regions A1A2 relative to the (intrinsic) total intensity for both regions. Columns 3 and 4 give the predicted intensities of emission lines normalized to the respective intensities of in each of regions A1 and A2. Column 6 is the ratio of observed (column 2) to predicted (column 5) line intensity. It is seen that the observed intensities of the majority of the MIR lines, with the exception of the [Ne ii]12.81 m and the [Ne iii]36.01 m lines, are 1.7 times higher than the predicted ones.
The Spitzer/IRS aperture is significantly larger than the narrow slit of 20 used in the optical observations, so that aperture effects could explain part of the discrepancy. We can estimate the discrepancy factor potentially due to aperture effects by using the total observed flux of 2.7510-12 erg s-1 cm-2 measured by Gil de Paz et al. (2003) on an image of Haro 3. With the observed / ratio of in the optical slit, and the uncorrected flux of 2.610-12 erg s-1 cm-2, we obtain an uncorrected (for extinction) flux of 9.110-13 erg s-1 cm-2; this value is about three times smaller than the total flux measured by Gil de Paz et al. (2003). We have also measured the fraction of the emission in the Gil de Paz et al. (2003) image which falls in the IRS slits (see right panel of Fig.2). Because of the orientation of the slits and their different sizes, roughly 36% of the total emission lies within the SL slit; 25% within the SH slit; and 80% within LH. Diffraction effects have not been considered here, so such estimates are rather crude. Moreover, the optical line emission suffers from highly variable extinction, which would result in relatively less flux in the more obscured region A2. All things considered, we conclude that aperture effects could account for the discrepancies for most lines in Table 6.
The discrepancy between the observed and predicted intensity ratios of the two weakest lines, [Ne ii]36.01 m and [Ne ii]12.81 m, are larger than for the others. In part, this discrepancy could be explained by the observational errors, at least in the case of the weakest [Ne iii]36.01 m emission line. Indeed, the observed ratio [Ne iii]15.55 m / [Ne iii]36.01 m of 6 is a factor of two greater than the predicted one. As for the [Ne ii]12.81 m emission line, its intensity was obtained with a deblending algorithm from the high-resolution IRS SH spectrum (see 3.2) because of its proximity with the 12.7 µm PAH feature. Even with the high-resolution IRS spectrum, this deblending is not straightforward, and the [Ne ii] line could consequently be overestimated.
Thus, taking into account a high extinction for region A2, aperture corrections and possible sources of the uncertainties for the weakest MIR lines, we find an overall good agreement between the observed intensities of the optical and MIR lines. We conclude that the MIR lines probe a region which has more extinction than the location where the optical lines originate. This hypothesis will be confirmed later by our DUSTY calculations.
4 The Infrared Morphology of Haro 3
We now use the Spitzer IRAC (Fig. 1) and MIPS (Fig. 5) data to study the origin of the infrared emission in Haro 3. Fig. 1 shows that both the 4.5 µm (IRAC2) and 8.0 µm (IRAC4) emissions are extended on galaxy scales (see also the growth curves of as compared to the point-spread function in Fig. 6). They follow well the optical features as shown in Fig. 4, and the optical knots AD are all detected. In particular, the IRAC emission peaks on region A, coincident with the strong compact radio source seen by Johnson et al. (2004), the site of the most active star-forming region in Haro 3.
4.1 The PAH Component
Emission in the IRAC bands is the sum of three different components: 1) the stellar photospheres, 2) the hot dust continuum, and 3) the PAHs. Because of the usual dominance of the PAHs in MIR spectra of star-forming galaxies (see the Haro 3 MIR spectrum in Fig. 3), the 8 µm IRAC channel is commonly used as a “PAH indicator” (Hogg et al., 2005; Engelbracht et al., 2005). The 4.5/8.0 flux ratio is thus a potentially important diagnostic for characterizing the ISM properties at short wavelengths: high 4.5/8.0 ratios would indicate predominantly stellar light, whereas low ratios would point to a relatively large PAH contribution.
An IRAC 4.5/8.0 color image was created from the two IRAC 4.5 and 8µm mosaics by first subtracting the background measured in empty regions in each mosaic, then aligning the two mosaics by cross correlation, and finally dividing one by the other. The result is shown in the right panel of Fig. 4 where the 4.5µm image contours are superimposed on the 4.5/8.0 µm flux ratio map. Inspection of Fig. 4 shows that the 4.5/8 flux ratio varies by more than a factor of 10 over the galaxy, with peaks 0.5 and troughs of 0.1. Because the 4.5/8.0 color of stellar populations is , roughly independently of age and metallicity (Leitherer et al., 1999), it is clear the the color map of Haro 3 is dominated by the ISM, and not by stars. The only source with 4.5/8.0 colors near the stellar value is knot D to the south of the nucleus (there is no emission associated with this object).
If we interpret the 8 µm emission in the IRAC band in the “standard” way and attribute it primarily to PAHs, the low 4.5/8 ratio 0.1 around knots A and B (see Fig. 4) would imply a substantial PAH contribution. Indeed this interpretation is supported by the detection of strong PAH features in the IRS spectrum (see 3). If all the changes in the 4.5/8 ratio over the galaxy were attributed only to changes in the PAH emission, the higher ratio 0.3 in the broad “ridge” to the southeast of the nucleus (see Fig. 4) would indicate that PAHs should be three times less prominent there. It could be that the PAHs are destroyed by the radiation fields in the star-forming regions associated with the intense circumnuclear visible in the right panel of Fig. 2.
4.2 The Hot Dust Continuum
On the other hand, the spatial variations in the 4.5/8 flux ratio could be associated with variations in the hot dust 4.58 µm continuum. As pointed out by Wu et al. (2006) and others, variations in the 8 µm continuum can masquerade in broadband images as variations in the PAH contribution. Because in Haro 3 the PAHs and continuum contribute roughly equally to the 8 µm filter121212This is indeed the case for region A: we decomposed the IRS spectrum into a sum of lorentzian functions for the PAH bands and a continuum and synthesized from this model the IRAC 8 µm flux, to show that each component contributes the same amount of energy in the band., it is not unreasonable to think that the larger 4.5/8 µm ratios are due to a flatter continuum slope, i.e. a lower 8 µm continuum, in the general extended ISM as compared to star-forming region A.
We can test this hypothesis by making IRAC/MIPS hybrid color images. Since the IRAC 4.5 µm image traces stars and hot dust but not PAH features, the IRAC 8 µm image mainly the dust continuum and PAHs with a very small stellar contribution, and the MIPS 24 µm image the warm or hot dust continuum only, we should be able to use the IRAC/MIPS colors to distinguish between continuum and PAH variations. Since the Spitzer diffraction limit is 111 at 4.5 µm, 198 at 8 µm (see the IRAC Data Handbook), and 6″at 24 µm, comparison of the IRAC 4 and 8 µm images with the MIPS 24 µm image is only possible after some processing of the latter. The availability of an accurate PRF makes possible a deconvolution for the MIPS-24 image, which we performed with the lucy task in the STSDAS 131313STSDAS is the Space Telescope Science Data Analysis System, distributed by the Space Telescope Science Institute, which is operated by the Association of Universities for Research in Astronomy (AURA), Inc., under NASA contract NAS 5–26555. extension of IRAF, using the MIPS24_PRF_mosaic in the mopex distribution as the deconvolution kernel. Prior to deconvolution, the MIPS image was linearly interpolated to the finer pixel scale of the PRF. After deconvolution, the image was rebinned to the original scale of the MIPS 24 µm mosaic (see 2.3), designed to be the same as the IRAC scale. The original and deconvolved MIPS-24 images are shown in Fig. 7. Just as we did for the IRAC color maps, background was first subtracted for the IRAC and MIPS images, then the images were aligned using a cross correlation technique, and finally the IRAC image was divided by the MIPS image. The 4/24 µm and 8/24 µm flux ratios obtained from the deconvolved 24 µm images are shown in Fig. 8 where the 4.5µm image is superimposed in contours.
There are several features of the hybrid IRAC/MIPS-24 color images in Fig. 8 to be noticed. First, the high ratio of 0.6 in source A in the 8/24 color map is much larger than the value inferred from the IRS spectrum of 0.06. However the spectrum has not been deconvolved and is roughly diffraction limited at all wavelengths. This means that it encompasses a larger fraction of the extended source as wavelength increases. At 8 µm the spectrum encompasses a region of 2″ in size, while at 24 µm it encompasses a 6″ region. Therefore, it is likely that the higher image value is closer to the true one for region A than the low value derived from the IRS spectrum which is more typical of the general ISM. Indeed, the value of the 8/24 color averaged over a 40″ square region is 0.17, consistent with the color derived from total fluxes. Hence, we believe that the general structure of the hybrid IRAC/MIPS-24 color images is reliable.
Second, as mentioned before, there is a noticeable feature with a high 4.5/8 ratio (0.3) tracing a broad ridge to the southeast of region A (see the right panel of Fig. 4). Our aim is to use the 24 µm map to trace the hot dust continuum, and compare it to the IRAC colors. The ridge feature is also present in the 4.5/24 and 8/24 color maps (Fig. 8). However, because of its location, the feature in the 24 µm map ratios may be an artefact of the deconvolution procedure. To check its reality, we have performed three tests. First, we have convolved the IRAC 8 µm image with the MIPS-24 PRF and then divided the resulting image by the original 24 µm image. Second, we have convolved the MIPS-24 deconvolved image with the IRAC 8 µm PRF and divided by the original 8 µm image. Third, we have divided the original 24 µm image by its PRF. The results of the first and third tests are shown in Fig. 9. The second test is not shown: because of the small size of the IRAC PRF, the color image obtained this way is virtually indistinguishable from the one made with the MIPS-24 deconvolved image. Inspection of Fig. 9 shows that the feature of interest in the 24 µm map coincides roughly with the Airy wings of the MIPS-24 PRF. Thus the broad ridge in the 24 µm map ratios may not be a real feature; this means that the 24 µm image cannot be used to unequivocally validate either hypothesis for the red 4.5/8 µm ridge color.
Nevertheless, we can examine the relative colors of the ridge and the surrounding disk. First, the ridge in Haro 3 has a 4.5/8 flux ratio of , “bluer” than the surrounding disk with . If the change in color depends solely on the 8 µm band, then the ridge would have to have either 50% fewer PAHs or 50% less hot dust at 8 µm than the disk. Since we expect the disk to have less hot dust than any actively star-forming region, we must necessarily conclude that the “ridge” is deficit in PAHs, not in the hot dust continuum. The PAHs could have been destroyed because of proximity to the edge of the ionized gas shell (see image in Fig. 2), or by supernovae shocks and outflows perpendicular to the dust lane.
The morphology of the 4/24 and 8/24 flux ratio maps as shown in Fig. 8 is complex; both ratios vary by a factor of 30 over the galaxy, being greatest in and around knot C toward the southwest and knot D toward the southeast. Because knot D has R-band emission, but no in the images by Gil de Paz et al. (2003), the reason for its high 4/24 and 8/24 ratios is unclear; indeed we cannot exclude that knot D be merely a foreground star. On the other hand, in knot C, we tentatively interpret these high ratios to be due to increased PAH strength, or equivalently, decreased hot dust. First, the 4.5/8 flux ratio in knot C is half that in knots A and B, and the morphology in the color is clearly extended. Second, both the 4.5/24 and 8/24 ratios are also lower in knot C. Hence, we conclude that there is less hot dust emitting at 4.5 µm and 8 µm in knot C than in knots A and B, and possibly an 8 µm PAH excess.
The difficulty of separating PAH and continuum contributions in the broadband IRAC 8 µm filter is evident from the above discussion. In Haro 3, with its conspicuous emission throughout the entire central region and across the dust lane, the ISM changes from predominantly neutral in the outer disk to ionized in the inner regions. Because of the complex morphology from 5 to 8 µm on kpc scales, we conclude that the ISM has been disturbed by the combined effects of the star-formation episodes concentrated in knots A, B, and C.
4.3 The Cool Dust Continuum
Fig. 5 shows the dust emission at the longer wavelengths of 24, 70 and 160 µm. The emission at 24 and 70 µm is virtually point-like, and appears to be mainly associated with the most active star-forming region A. The point-like nature of the 24 and 70 µm emission is also illustrated by the growth curves in Fig. 6 141414The 24µm flux given by the gaussian fit discussed in 2.4 is too low relative to the spectrum. The MIPS-24 image of Haro 3 resembles the octagonal shape of the PRF, which is strongly diffraction limited with a pronounced Airy ring. Hence, we would expect a gaussian fit to give a lower flux than the true one, since it does not include the flux in the Airy maximum at radii of 6″, and may also have overestimated the background because of the additional emission at these radii.. However, the emission at 160 µm appears to be more extended (see also its growth curve in Fig. 6).
Like most other galaxies, Haro 3 is a composite entity in the IR; we see different components and morphologies depending on wavelength. In Haro 3, we see extended stellar photospheric and compact hot dust continuum emission at 4.5 µm; extended PAH emission in the general ISM at 8 µm but with some hot dust continuum and stars; compact warm dust emission associated with active star-forming regions at 24 and 70 µm; and cooler extended dust emission associated with older stellar populations at 160 µm.
5 Modeling the Infrared Spectral Energy Distribution of Region A in Haro 3
We now use the complete IR SED to constrain the properties of the star formation and the dust in the brightest star-forming region in Haro 3, region A. The infrared morphology revealed by the IRAC and MIPS images (Fig. 1 and 5) suggest that region A dominates the SED of Haro 3 at wavelengths µm. The IR SED of this region, a strong continuum with ionic lines indicating a relatively hard ionizing source, is quite similar to that observed toward dust-enshrouded super star clusters, such as for instance in NGC 5253 (see Vanzi & Sauvage, 2004, and references within). Such an identification is confirmed by the detection of compact thermal radio emission from region A by Johnson et al. (2004), emission identified as originating in the compact Hii region created by the star cluster.
5.1 Fitting with DUSTY
To constrain the properties of this cluster and its surrounding dust envelope, we have fit the NIR-FIR SED of this source with the radiative transfer code DUSTY (Ivezić et al., 1999; Ivezić & Elitzur, 1997). DUSTY solves the radiative transfer problem in a dust envelope but has a number of limitations which must be understood so we can properly evaluate the results it gives. First, DUSTY assumes a spherically symmetric dust envelope which is decoupled from the ionizing radiation source. While this decoupling is probably realistic for the stars and the dust (we do not expect much of the dust to survive in or very near the star cluster), it is much less so for the ionized gas which is a source of radiation through its continuum emission, and the dust. The assumption of spherical symmetry is also too strong to be realistic. Second, DUSTY assumes that grains are in thermal equilibrium with the radiation field. This may be the case for all grains near and in the cluster exposed to its intense and hard radiation, but clearly not so for grains in the general interstellar medium of Haro 3. These two limitations mean that the SED we can fit realistically with DUSTY concerns only region A, but not the whole galaxy.
To construct the SED of region A, we must use high spatial resolution observations in order to distinguish its emission from emission from other parts of Haro 3. In the NIR, which is a useful domain to constrain the total optical depth to the cluster, we use the NIR observations listed in Table 1, taken from Johnson et al. (2004). Given that our IRS spectrum is centered on region A and includes the spectral region covered by our IRAC data, we have preferred to use the IRS rather than the IRAC data in the 5-35 µm range. We however do not use the IRS spectrum in its original form but rather in its PAH-subtracted version. As explained earlier, the PAH component in the original IRS spectrum is related to the general ISM of Haro 3 and therefore not relevant here. The MIPS point at 24 µm is included in the fit, although it does not provide supplementary constraints with respect to the IRS spectrum. As the 70 m MIPS image is strikingly pointlike we assume that it is entirely due to region A. The 160 µm MIPS image is more extended than the PSF (Fig. 6) and therefore likely contains a contribution from the general ISM. However it is not possible to accurately deconvolve the 160 m image to derive the point-source component flux only. We thus should keep in mind in judging the goodness of the fit that the 160 µm flux is likely an upper limit to the actual flux from region A.
The IRAS and ISO measurements of Haro 3 were not used in the fit for two reasons. First, the ISO fluxes and the IRAS 12 and 25 m fluxes fall in a region of the SED that is better covered by the IRS and MIPS data, and including them does not add more information. Comparison of the IRAS 60 and 100 µm fluxes to the MIPS 70 and 160 µm fluxes shows that, although they are compatible with each other within their respective error bars, the IRAS photometry is systematically higher than the MIPS photometry. This can be due either to the larger IRAS beam since it subtends more faint extended emission than the smaller Spitzer beam or to an incorrect cross-calibration between IRAS and Spitzer. At this stage of the Spitzer mission, cross-calibration with another mission can indeed be uncertain and, as a result we rather restrict ourselves to the Spitzer data. Finally, the radio data of Johnson et al. (2004), although of very high spatial resolution, were not used in the fit because first, DUSTY does not take into account radio emitting processes; and second, the contribution of free-free and synchrotron emission to the SED at the longest wavelength point (160 µm) is negligible.
Before proceeding with the fit, we recall that region A is composite. It is composed of two main sources (A1 and A2) and a much fainter third one (A3). Making a single DUSTY model for a collection of identical sources is not a problem since the total values of the quantities of interest such as opacities, luminosities and masses, are independent of the actual number of sources used to fit the SED. However, as discussed before, A1 and A2 are not identical (we will neglect the faint A3). Thus, A2 has no optical counterpart in the HSTF606W band image while A1 does. It is also not clear that the Br and radio emission in the direction of A2 come from the same source, while such an association is much clearer in A1. Finally, the different derivations of the extinction toward region A (essentially A1+A2) by Johnson et al. (2004), using the radio to Br ratio, the hydrogen Balmer line ratios, and the NIR colors, disagree. While this is a rather common situation, it points to a non-homogeneous extinction in region A and suggests that A1 and A2 may not be in the same “evolutionary” stage. Indeed, our CLOUDY modeling does suggest that A2 has more extinction than A1 (3.3). This composite nature of region A must be kept in mind when discussing the physical properties deduced from the fit. This is however the best we can do: the lack of high resolution data in the MIR-FIR allows us only to make a single DUSTY model of the SED of region A which includes both A1 and A2.
When judging the goodness of the fit, it is also important to compare the number of independent constraints with the number of model parameters. For practical purposes we have integrated the IRS data in a series of 10 pseudo-filters with a resolving power of 5. The NIR data consists of three bands, while MIPS provides 2 independent measurements. We therefore have 15 independent constraints on the fit. The model requires a large number of parameters. We need first to specify a heating source. We take it to be described by the Starburst99 (Leitherer et al., 1999, hereafter SB99) burst stellar populations at the metallicity of Haro 3. This requires one parameter, the age of the burst. The dust is described by its composition and size distribution. We take it to be formed of silicates, graphites and amorphous carbons. Thus the dust mix requires two more parameters. The dust size distribution is characterized by a minimum and a maximum size and a power law exponent, requiring three additional parameters. The dust shell around the star cluster is modeled as a series of embedded shells, each with an outer (relative) radius and an exponent for the power-law describing the dependence of the dust density on radius. Thus the total number of parameters required is . The “size” of the system is described by the temperature at the inner edge of the first shell. Finally the total amount of dust is constrained by the optical depth at V. A complete DUSTY model is therefore described by , i.e. in principle, a model with 3 shells is still over-constrained by the data.
To estimate the goodness of fit of a model, we compute the quantity:
| (1) |
where and are respectively the observed and modeled fluxes, the latter being obtained by convolving the SED with the appropriate filter bandpasses, and is a weight defined as:
| (2) |
Here, is the resolving power of each filter or pseudo-filter.
The weighting scheme is designed to reflect the fact that a broadband filter in the NIR collects the same amount of information as a broadband filter in the FIR, although their widths are very different. The sum of the weights is normalized to N, the number of filters used to construct the SED.
To search for the best fitting dust SED, i.e. the one with the lowest , we have run about 3106 DUSTY models, varying from 1 to 3. The optical depth is varied from 0 to 50, with most of the exploration being done in the range 0 to 30, with steps of 1 or 2. The minimum and maximum dust grain sizes are varied within the range between 0.001 and 40 µm, with the minimum sizes clustered around 0.01 µm and the maximum sizes clustered around 1 µm; the steps are generally logarithmic, varying from a 10% increase to a factor of 2. The exponent of the size distribution is varied within the range [0-4.5] with most of the models in the range [2.5-4]. Typical steps are 0.5. The temperature on the inner side of the dust shell ranged from 10 K to 1600 K, with most of the models in the range 400 K to 700 K, and typical steps are 25-50 K. Only 3-component dust mixes were investigated (with silicates, graphites and amorphous carbons), with their proportions varying uniformly in the range 0-100%. Steps in the proportions vary between 1% to 30%. 1.6 million 1-zone models were explored, with the outer radius varying from 25 to 1000 in an uniform manner and with a density exponent ranging between 0 and 2. We ran also just short of a million 2-zone models where the outer radius was varied between 100 and 1000, and the intermediate radius between 2 and 999. In these models the density exponent ranged between 2 and 4, with most values between 1 and 2. About 3.5 3-zone models were run, where the outer radius was fixed at 1000 and the intermediate radius sampled the range from 10 to 999 uniformly. In the 3-zone models, the density exponent was varied from to 3 with a large number of models between 0 and 1. Steps in radius are between 25 and 50, and steps in the density exponent are 0.5.
5.2 Results
The parameters of the best-fit DUSTY model are listed in Table 7 and the resulting SED is displayed in Fig. 10. The of this model is 0.015, which implies a mean ratio between the model and observed fluxes of 7%, well within the observational errors. Uncertainties in the parameters (last column in Table 7) are estimated by exploring the range where is degraded to 10%. From the DUSTY fit, it is possible to reconstruct physical parameters such as the size of the system, the bolometric luminosity, and the dust mass, following the methods described in Plante & Sauvage (2002) and Hunt et al. (2005).
5.2.1 The Ionizing Star Cluster
As always in such a fit, the best constrained quantity is the bolometric luminosity of the system. This is because, for a well-sampled SED, this luminosity being the integral of the SED, the observed and best-fit ones should be the same. The luminosity of the model is 2.8109 . This is quite a large luminosity for a single cluster however, as discussed before, we are quite likely dealing in this case with at least two clusters (A1 and A2). The bolometric luminosity constitutes a large but not unreasonable fraction of the total galaxy luminosity: for comparison, the 8-1000 m luminosity derived from the IRAS bands (Sanders & Mirabel, 1996) is 4.1109 . With the bolometric luminosity of the system, we can then use the SB99 models to derive several physical parameters of the central ionizing source. The best-fit SED corresponds to a SB99 model with a Salpeter Initial Mass Function and a burst age of 5 Myr. As this SB99 cluster has a luminosity of 109 for a stellar mass of 106 , the ionizing source has then a mass of 2.8106 . This is again in the high mass range for stellar clusters, but acceptable given that region A is a multiple source.
The best-fit age for the cluster is 5 Myr, in the upper range of ages that have been derived for region A using various diagnostics. For example, in the course of a large program to determine electron temperatures of Hii regions in BCDs by fitting their optical SEDs (3200–5200 Å) and in particular the Balmer jump (3646 Å), Guseva, Izotov & Thuan (2006) have determined the stellar populations of a number of galaxies, including region A in Haro 3. They approximate the star formation history of region A by two bursts of different strengths, a recent burst with an age t(young) to account for the young stellar population and a prior burst with an age t(old) responsible for the older stars. The contribution of each burst to the SED is given by the ratio of the masses of stellar populations formed respectively in the old and young bursts, b= M(old)/M(young). The contribution of gaseous emission is determined from the observed equivalent width of the emission line EW(). Those authors ran a large number (105) of Monte Carlo models varying simultaneously t(young), t(old) and b. They found that the model which best fits the SED of Haro 3 has t(young) = 4 Myr, t(old) = 2 Gyr and b = 20. The age of the young burst so derived is in good agreement with the one of 5 Myr derived by Johnson et al. (2004) from fitting the NIR colors, and the one derived here by the DUSTY fit.
SB99 predicts also the number of hydrogen-ionizing photons QLyc from such a cluster. We find QLyc photons s-1. This is on the low side of the range of values for A1A2 given by Johnson et al. (2004), i.e. from 4.3 () to 8.2 photons s-1 (radio) converted to the distance used here. Johnson et al. (2004) interpret the disagreement between the two derivations of QLyc as a sign for the existence of highly obscured sources in region A. This explanation cannot account for our low value of QLyc: since we reproduce the full SED of region A, there is no room for extra sources as they would inevitably contribute substantial emission in some wavelength range. A possible explanation could be that the age we derive is too old. As can be seen in Leitherer et al. (1999) a 2.5 Myr cluster has a QLyc 5 times higher while its total luminosity has only increased by a factor 1.5. Yet a more likely explanation is related to the composite nature of region A: A1 seems to suffer from very little extinction, while A2 seems to be more obscured. One could thus envision a situation where the less obscured source is indeed a 5 Myr cluster, though less luminous than we find here, while the more obscured source is a younger cluster. Such a model however has too many free parameters to be constrained by the data at hand.
5.2.2 The Dust Cloud
The derived properties of the dust “shell” around the ionizing clusters lead to a more surprising picture. The first intriguing feature concerns the nature of the dust. We find that silicates are absent from the best-fitting chemical mix. This situation is similar to that in NGC 5253 (Vanzi & Sauvage, 2004) where modeling of the embedded star cluster also indicates a lack of silicates. This situation likely results from the need for significantly hot dust to produce the NIR continuum, while avoiding the generation of silicate emission/absorption features which would be expected from small hot silicate grains in an optically thick regime. If the hot dust continuum were produced by thermally fluctuating small carbon grains, then colder silicate dust grains may exist in the outer part envelope. However these two features – stochastic heating, and a radial dependence of the chemical composition – are not implemented in DUSTY.
The second intriguing feature concerns the size of the grains. To reproduce the full SED, and in particular its FIR part, the maximum grain size must exceed 11 µm; the upper limit to the largest possible size is unconstrained by our fit. Even though the best-fit value is large, 40 µm, this is still small compared to the millimeter-sized grains that have been advocated to fit the SEDs of circumstellar shells (see e.g. Men’shchikov et al., 2002), this is quite large compared to the standard MRN size distribution (Mathis et al., 1977), with a maximum size of 0.25-1.0 µm. If we allow the fit to the 160 m MIPS flux to be significantly worse since it is likely an upper limit, we can relax the constraint on the largest grain size to values that are more consistent with the MRN distribution. Unlike the maximum size, the minimum size and the exponent of the size distribution are very similar to the MRN distribution.
The last surprising feature concerns the extent and mass of the “shell”: at the adopted distance of 16.3 Mpc, it has a radius of 430 pc, considerably larger than region A and nearly reaching region B (Fig. 4). A more detailed look at the model reveals that, despite the large extent of the dust shell, the other physical parameters are not unreasonable. First, with , the shell needs not be very thick. In fact, it is not truly a shell since the density shows no dependence with radius, i.e. the exponent of the density power law distribution is equal to zero. Thus, the geometry deduced from the DUSTY modeling is more that of a large cloud of dust surrounding region A than that of a giant dust shell. One could in fact consider that the best fitting model describes, not so much an embedded cluster and its envelope, but the general ISM of Haro 3 heated locally by the clusters in region A. This would make region A an example of the later stage in the possible evolutionary sequence that goes from totally embedded super-star clusters to completely unobscured ones (e.g. Calzetti et al., 1997). The IRAC and the shorter-wavelength MIPS images do not show such an extended dust cloud because of the presence of temperature and hence surface brightness radial gradients in Haro 3. In the model, the energy source lies at the center, the surface brightness is centrally peaked and the apparent size of the object is smaller than its physical size. At 160 µm, with a resolution of ″, Haro 3 appears extended (resolved), which would be consistent with the cool dust temperature at a radius of 430 pc. DUSTY can compute images at selected wavelengths; these images reveal that the FWHM of the dust cloud is always smaller than the instrumental PSF 24 and 70 µm. Therefore although the model dust cloud is large, it would not necessarily be seen as a resolved object in the 24 and 70 µm images. At 160 µm however, with a resolution of ″, Haro 3 appears slightly resolved, which is not the case of the model cloud. This probably indicates that a fraction from the 160 µm flux is not heated by region A but rather finds its energy source in the general interstellar radiation field.
We derive an opacity from our best-fit model. In the model context, this is the optical depth of the “shell” toward the central source. There are many possible explanations of the difference between the DUSTY-derived optical depth and the measured values of the extinction from recombination lines. The simple and linear relation between the two quantities () is only valid in the screen geometry, when scattering and radiation transfer are neglected. Although DUSTY assumes a screen geometry, it treats the complete radiation transfer process: absorption, scattering, and re-emission of the absorbed energy. As scattering has a wavelength dependence opposite to that of extinction, the resulting relation between and becomes shallower and depends strongly on wavelength. Another plausible explanation is that a more realistic geometry would have part of the source region, and in particular the ionized gas responsible for all the lines and for a large fraction of the NIR emission, mixed with the absorbing dust. This also results in a shallower relation between and . In any case, the model value of AV is within the range of observationally determined values of AV. From the optical recombination lines, Thuan & Izotov (2005) derive AV = 0.5. Comparing Br from Johnson et al. (2004) with gives AV = 0.9. From the location of region A in the (J-H/H-K) color-color diagram, Johnson et al. (2004) estimate a larger AV in the range 2-4. Finally, the comparison of QLyc from the radio emission to that deduced from the line gives a still larger value, AV = 8 (Johnson et al., 2004). There thus appears to be a systematic increase of the derived extinction with increasing wavelengths. These differences may be due to a variety of causes such as: (1) mixing between the emission and absorption regions; (2) the coexistence of sources with different extinction within the Spitzer beam; or (3) the clumpy distribution of the absorbing material. For lack of a better spatial resolution in the infrared, it is impossible to distinguish among these possibilities, although we do know that region A comprises three components in the radio. That we can model the complete NIR-FIR SED with a characteristic opacity in the intermediate range of the observationally determined extinctions suggests that our model is representative of the average situation in region A.
From the dust properties and the physical size of the system, we can compute the total dust mass which we find to be 1.5 . This is again a large dust mass for embedded clusters, which generally are one order of magnitude less massive. It is however a quite reasonable mass for a dust cloud in the general ISM of Haro 3. Indeed, based on the observations of Meier et al. (2001) and Gordon & Gottesman (1981), Johnson et al. (2004) have derived a total molecular and atomic gas mass of 6.7 . Thus Haro 3 has a dust-to-gas ratio of 2.2, consistent with the metallicity trends for BCDs illustrated by Hunt et al. (2005) and references therein.
To summarize, a model where the stellar clusters in region A heat an extended and diffuse region of the ISM of Haro 3 can account well for the NIR-FIR spectral energy distribution of the galaxy.
6 Star Formation in Haro 3
Star formation in Haro 3 occurs primarily in several knots distributed over the central region of the galaxy around the dust lane. The primary star-forming regions, knots A, B, and C (see Fig. 1) show different properties in the optical, the infrared, and the radio. Because of the compact radio emission found by Johnson et al. (2004), we would like to argue that knot A is a ensemble of star clusters with generally large extinction (the extinction is highly variable), while knot B is older and less obscured. Knot C, with its seemingly high PAH fraction, would be older still, with an flux 6 times smaller than the other two knots, but with similar extinction (Steel et al., 1996). Because of its high density (n200 cm-3 Steel et al., 1996; Izotov & Thuan, 2004) and compact size in the radio (Johnson et al., 2004), we would classify knot A as “active” (see the definition of this term in Hirashita & Hunt, 2004). Such conditions are found also in mergers, with consequently a high pressure, and possible formation of super star clusters. That knot A is forming stars in an “active” mode is corroborated by the good fit of the DUSTY model to the IR SED, the significant IR luminosity, and the relatively high SFR inferred by Johnson et al. (2004) from the radio emission. Knots B and C, on the other hand, are less dense (n100 cm-3 Steel et al., 1996), and can be considered as ”passive”.
The properties of the knots differ in terms of their IRAC and MIPS colors, but the IRS spectrum encompasses variable fractions of knots A and B, as well as the intervening ISM in the dust lane dividing the two regions. Were knot A to be an isolated dusty star cluster with a rising-spectrum radio source, we would expect it to have little or no PAH emission (Hunt et al., 2005) because we would expect the PAHs to be destroyed by the intense radiation field in the “active” compact region. However, we do see PAH emission. Therefore either our hypothesis is mistaken, namely PAHs can be found in compact dense star-forming regions, or our spectrum is “contaminated” by region B and the global ISM in Haro 3 (or both). To distinguish among the various possibilities, more extensive samples are needed, with a wide range of metallicities, luminosities, and PAH properties.
Haro 3 is relatively nearby BCD, only slightly metal deficient, with 12log(O/H) = 8.32, and only slightly sub-luminous, with . Hence, it is an object which could serve as a transition case to link the properties of low-metallicity BCDs with those of more luminous metal-rich starbursts. Indeed, the EWs of its PAHs are generally higher than those of other BCDs (e.g. Wu et al., 2006), more consistent with more luminous and metal-rich starburst galaxies (Brandl et al., 2004). On the other hand, the PAHs in Haro 3 tend to be neutral according to the diagnostic diagram of Draine & Li (2001), more similar to “normal” galaxies than to starbursts. PAHs in BCDs may also be narrower than those of starbursts, and more similar to nearby Hii regions although the differences may not be significant. The problem with many of these results is that their exact interpretation depends on the fraction of the global ISM in the IRS slits. These appear to cross the dust lane that separates the apparent positions of star-forming knots A and B, so we could be seeing a PAH contribution from the general ISM, not necessarily associated with the star formation. The PAH parameters also depend on how they were derived (e.g., continuum determination, profile templates, etc.). Consequently, on the basis of a single object, we cannot make definitive statements about low-metallicity PAHs, and must wait for larger BCD and starburst samples analyzed in a homogeneous way.
7 Summary
We present here the first results of our Spitzer Cycle 1 program which is aimed at the investigation of star formation in metal-poor BCD galaxies. We wish to study how star formation parameters and dust properties change as a function of metallicity and excitation. In this first paper of a series, we discuss the infrared properties of the most metal-rich object in our sample, Haro 3 = NGC 3353 = Mrk 35, with an oxygen abundance of 12log(O/H) = 8.32. We have obtained IRS low and high-resolution spectra for the brightest star-forming region A in Haro 3, as well as IRAC images at 4.5 and 8 µm and MIPS images at 24, 70, and 160 µm of the galaxy. We obtain the following results:
(1) The IRS spectrum (Fig. 3) shows strong Polycyclic Aromatic Hydrocarbon (PAH) molecular emission, with features clearly detected at 5.7, 6.2, 7.7, 8.6, 11.2, 12.7, and 16.4 µm. The PAHs in Haro 3 are predominantly neutral and small, similar to those found in normal spiral galaxies, suggesting that they reside in the general ISM and not in the star-forming region A. The PAH emission features are relatively narrow and their equivalent widths are generally high for the metallicity of Haro 3.
(2) Gaseous nebular line emission is also seen. The IRS spectrum shows several fine-structure lines, including [S iv]10.51, [Ne ii]12.81, [Ne iii]15.55, 36.01, [S iii]18.71, 33.58, [O iv]25.89, and [Si ii]34.82 µm.
(3) Several fairly high-excitation lines are detected in Haro 3. The faint [O iv] line at 25.89 µm indicates the presence of radiation as hard as 54.9 eV in Haro 3. This hard radiation is perhaps due to the Wolf-Rayet stars present in the galaxy. Such a detection is intriguing because the high-ionization [Fe v]4227 and Heii 4686 emission lines which both have an ionization potential of 54.4 eV, are not seen in the optical spectrum of Haro 3, presumably because of extinction effects. The electron density derived from the MIR lines is about half that derived from the optical lines. Moreover Hii photoionization CLOUDY models that reproduce the optical line intensities predict MIR lines that are systematically too small compared to those observed. This discrepancy may be understood if the beam dilution in the IR is taken into account, and if the bulk of the MIR radiation comes from a region more obscured than the optical one.
(4) Like most galaxies, Haro 3 is a composite entity in the IR. We see extended stellar photospheric emission and compact hot dust continuum at 4.5 µm coming mainly from the star-forming regions, extended PAH emission coming mainly from the general ISM at 8 µm, with a small contribution from hot dust continuum and stars, compact small grain warm dust emission associated with active star-forming regions at 24 and 70 µm, and cooler extended dust emission associated with older stellar populations at 160 µm.
(5) We have modeled the IR spectral energy distribution (SED) of star-forming region A with DUSTY, a code which solves the radiative transfer problem in a dust envelope. The best-fit model gives a total luminosity of 2.8109 L☉ and a total stellar mass of 2.8106 M☉ for the ionizing star clusters. These numbers are not unreasonably high because region A contains at least three star clusters. The best-fit age of the star formation burst in A is 5 Myr, in agreement with the age derived from the optical SED. The number of ionizing photons is 4.4 photons s-1, greater than the one derived from the Br line but smaller than that derived from the thermal radio flux, indicating more extinction in the Br flux than in the MIR.
(6) As for the nature of the dust, the best-fit DUSTY model implies that silicates are absent from region A. The maximum grain size can reach the very large value of 40 µm if we attempt to fit the 160 µm MIPS flux. However, we obtain more reasonable results ( 1 µm) if we consider the 160 µm flux to be an upper limit and do not attempt to fit it. The AV of the dust given by DUSTY is 3, higher than the value of 0.5 derived from the optical lines, and lower than the value of 8 derived from radio observations, consistent with the picture that observations at longer wavelengths probe more deeply into the star-forming region. The dust density does not vary with distance from the central clusters, and the dust extent is 430 pc in radius, considerably larger than region A. This suggests that the geometry deduced from the DUSTY modeling is that of a large cloud of dust in the general ISM of Haro 3, surrounding region A and heated by the clusters in it, rather than that of a giant dust shell around region A.
References
- Anders & Grevesse (1989) Anders, E., & Grevesse, N. 1989, Geochim. Cosmochim. Acta, 53, 197
- Armus et al. (2004) Armus, L., et al. 2004, ApJS, 154, 178
- Asplund et al. (2005) Asplund, M., Grevesse, N., & Sauval, A. J. 2005, ASP Conf. Ser. 336: Cosmic Abundances as Records of Stellar Evolution and Nucleosynthesis, 336, 25
- Brandl et al. (2004) Brandl, B. R., et al. 2004, ApJS, 154, 188
- Calzetti et al. (1997) Calzetti, D., Meurer, G. R., Bohlin, R. C., Garnett, D. R., Kinney, A. L., Leitherer, C., & Storchi-Bergmann, T. 1997, AJ, 114, 1834
- Draine (2006) Draine, B. T. 2006, private communication
- Draine & Li (2001) Draine, B. T., & Li, A. 2001, ApJ, 551, 807 1
- Engelbracht et al. (2005) Engelbracht, C. W., Gordon, K. D., Rieke, G. H., Werner, M. W., Dale, D. A., Latter, W. B. 2005, ApJ, 628, 29
- Fazio et al. (2004) Fazio, G. G., et al. 2004, ApJS, 154, 10
- Ferland (1996) Ferland, G.J. 1996, Hazy: A brief Introduction to CLOUDY (Univ. Kentucky Dept. Phys. Astron. Internal Rep.)
- Ferland et al. (1998) Ferland, G.J., Korista, K.T., Verner, D.A., Ferguson, J.W., Kingdon, J.B., & Verner, E.M. 1998, PASP, 110, 761
- Genzel & Cesarsky (2000) Genzel, R., & Cesarsky, C. 2000, ARA&A, 38, 761
- Gil de Paz et al. (2003) Gil de Paz, A., Madore, B. F., & Pevunova, O. 2003, ApJS, 147, 29
- Gordon & Gottesman (1981) Gordon, D., Gottesman, S. 1981, AJ, 86, 161
- Gordon et al. (2005) Gordon, K. D., et al. 2005, PASP, 117, 503
- Guseva, Izotov & Thuan (2006) Guseva, N. G., Izotov, Y. I., & Thuan, T. X. 2006, ApJ, 644, 890
- Helou et al. (2000) Helou, G., Lu, N. Y., Werner, M. W., Malhotra, S., & Silbermann, N. 2000, ApJ, 532, L21
- Hirashita & Hunt (2004) Hirashita, H., & Hunt, L. K. 2004, A&A, 421, 555
- Hogg et al. (2005) Hogg, D. W., Tremonti, C. A., Blanton, M. R., Finkbeiner, D. P., Padmanabhan, N., Quintero, A. D., Schlegel, D. J., & Wherry, N. 2005, ApJ, 624, 162
- Houck et al. (2004a) Houck, J. R., et al. 2004a, ApJS, 154, 18
- Houck et al. (2004b) Houck, J. R., et al. 2004b, ApJS, 154, 211
- Hughes et al. (1998) Hughes, D.H., et al. 1998, Nature, 394, 241
- Hunt et al. (2005) Hunt, L., Bianchi, S., & Maiolino, R. 2005, A&A, 434, 849
- Hunt & Maiolino (2005) Hunt, L. K., & Maiolino, R. 2005, ApJ, 626, L15
- Hunt, Vanzi, & Thuan (2001) Hunt, L.K., Vanzi, L., & Thuan, T.X. 2001, A&A, 377, 66
- Ivezić et al. (1999) Ivezić, Z., Nenkova, M., & Elitzur, M. 1999, User Manual for DUSTY, University of Kentucky Internal Report, accessible at http://www.pa.uky.edu/ moshe/dusty
- Ivezić & Elitzur (1997) Ivezić, Z. & Elitzur, M. 1997, MNRAS, 287, 799
- Izotov & Thuan (2004) Izotov, Y.I., & Thuan, T. X. 2004, ApJ, 602, 200
- Johnson et al. (2004) Johnson, K. E., Indebetouw, R., Watson, C., & Kobulnicky, H. A. 2004, AJ, 128, 610
- Leitherer et al. (1999) Leitherer, C., et al. 1999, ApJS, 123, 3
- Li & Draine (2001) Li, A., & Draine, B. T. 2001, ApJ, 554, 778
- Loose & Thuan (1985) Loose, H.-H. & Thuan, T.X. in Star-Forming Dwarf Galaxies and related objects, eds. D. Kunth, T.X. Thuan & J.T.T. Van (Gif-sur-Yvette: Editions Frontieres), p. 73
- Makovoz & Marleau (2005) Makovoz, D., & Marleau, F. R. 2005, PASP, 117, 1113
- Malkan et al. (1998) Malkan, M. A., Gorjian, V., & Tam, R. 1998, ApJS, 117, 25
- Mathis et al. (1977) Mathis, J. S., Rumpl, W., & Nordsieck, K. H. 1977, ApJ, 217, 425
- Meier et al. (2001) Meier, D. S., Turner, J. L., Crosthwaite, L. P., Beck, S. C. 2001, AJ, 121, 740
- Men’shchikov et al. (2002) Men’shchikov, A. B., Schertl, D., Tuthill, P. G., Weigelt, G., Yungelson, L. R. 2002, A&A, 393, 867
- Metcalfe et al. (1996) Metcalfe, L., et al. 1996, A&A, 315, L105
- Plante & Sauvage (2002) Plante, S., & Sauvage, M. 2002, AJ, 124, 1995
- Rieke et al. (2004) Rieke, G. H., et al. 2004, ApJS, 154, 25
- Sanders & Mirabel (1996) Sanders, D. B., Mirabel, I. F. 1996, ARA&A 34, 749
- Schaerer & de Koter (1997) Schaerer, D., & de Koter, A. 1997,A&A, 322, 598
- Smith et al. (2006) Smith, J.D., Draine, B. T., et al. 2006, ApJ, submitted
- Steel et al. (1996) Steel, S. J., Smith, N., Metcalfe, L., Rabbette, M., & McBreen, B. 1996, A&A, 311, 721
- Steidel et al. (2003) Steidel, C.C., Adelberger, K.L., Shapley, A.E., et al. 2003, ApJ, 592, 728
- Thuan & Izotov (2005) Thuan, T.X., & Izotov, Y.I. 2005, ApJS, 161, 240
- Thuan, Sauvage, & Madden (1999) Thuan, T.X., Sauvage, M., & Madden, S. 1999, ApJ, 516, 783
- Vanzi & Sauvage (2004) Vanzi, L., Sauvage, M. 2004, A&A, 509
- Verma et al. (2003) Verma, A., Lutz, D., Sturm, E., Sternberg, A., Genzel, R., & Vacca, W. 2003, A&A, 403, 829
- Weedman et al. (2005) Weedman, D. W., Le Floc’h, E., Higdon, S. J. U., Higdon, J. L., & Houck, J. R. 2006, ApJ, 638, 613
- Werner et al. (2004) Werner, M. W., et al. 2004, ApJS, 154, 1
- Whitmore & Zhang (2002) Whitmore, B. C., Zhang, Q. 2002, AJ, 124, 1418
- Wu et al. (2006) Wu, Y., Charmandaris, V., Hao, L., Brandl, B. R., Bernard-Salas, J., Spoon, H. W. W., & Houck, J. R. 2006, ApJ, 639, 157
| Telescope/Instrument | Wavelength | Total flux |
|---|---|---|
| (m) | (mJy) | |
| Spitzer/IRAC | 4.509 | 20.7 2.1 |
| ” | 7.982 | 148.0 14.8 |
| Spitzer/MIPS | 23.7 | 810 81 |
| ” | 71.0 | 3870 387 |
| ” | 156.0 | 3900 390 |
| IRASaaFrom NED. | 12 | 211.1 29.6 |
| ” | 25 | 941.8 56.5 |
| ” | 60 | 4949.0 395.9 |
| ” | 100 | 6746.0 404.8 |
| ISO/ISOCAMbbFrom Metcalfe et al. (1996). | 7.75 | 149 30 |
| ” | 15.0 | 300 70 |
| WIYN/NIRIMccFrom Johnson et al. (2004) for A1+A2. | 1.26 | 1.19 0.12 |
| ” | 1.65 | 1.12 0.11 |
| ” | 2.12 | 1.06 0.11 |
| VLAccFrom Johnson et al. (2004) for A1+A2. | 13000 | 2.96 0.22 |
| ” | 36000 | 2.60 0.22 |
| WavelengthaaFitted restframe wavelength, corrected for . | IntegratedbbStandard deviations of the repeated measurements are given in parentheses. The true uncertainty including calibration is probably 20%. | EquivalentbbStandard deviations of the repeated measurements are given in parentheses. The true uncertainty including calibration is probably 20%. | FWHMbbStandard deviations of the repeated measurements are given in parentheses. The true uncertainty including calibration is probably 20%. |
|---|---|---|---|
| Flux | Width | ||
| (µm) | ( W m-2) | (µm) | (µm) |
| 6.202 | 8.3 (0.3) | 1.31 (0.22) | 0.17 (0.004) |
| 7.693 | 26.0 (9.2) | 2.85 (1.47) | 0.66 (0.11) |
| 8.631 | 6.4 (0.9) | 0.64 (0.12) | 0.38 (0.08) |
| 11.269 | 8.3 (0.2) | 0.60 (0.05) | 0.25 (0.006) |
| 12.814 | 6.3 (1.3) | 0.32 (0.07) | 0.13 (0.015) |
| 16.424 | 1.2 (0.1) | 0.06 (0.01) | 0.18 (0.007) |
| LineaaBecause of the presence of [Ar iii] and [Ar ii] only in the low-resolution spectra, we do not give their parameters here. | EionbbIonization potential (lower) of the stage leading to the transition. | Nominal | FittedccRestframe, corrected for the (Thuan & Izotov, 2005). | IntegratedddStandard deviations of the repeated measurements are given in parentheses. The true uncertainty including calibration is probably 20%. | EquivalentddStandard deviations of the repeated measurements are given in parentheses. The true uncertainty including calibration is probably 20%. | FWHMddStandard deviations of the repeated measurements are given in parentheses. The true uncertainty including calibration is probably 20%. |
|---|---|---|---|---|---|---|
| Wavelength | Wavelength | Flux | Width | |||
| (eV) | (µm) | (µm) | ( W m-2) | (µm) | (µm) | |
| [S iv] | 34.8 | 10.511 | 10.510 | 3.01 (0.20) | 0.21 (0.01) | 0.022 (0.005) |
| [Ne ii] | 21.6 | 12.814 | 12.813 | 2.71 (0.05) | 0.12 (0.01) | 0.020 (0.001) |
| [Ne iii] | 41.0 | 15.555 | 15.556 | 7.51 (0.07) | 0.31 (0.02) | 0.022 (0.001) |
| [S iii] | 23.3 | 18.713 | 18.713 | 4.03 (0.01) | 0.13 (0.01) | 0.030 (0.001) |
| [O iv] | 54.9 | 25.890 | 25.961 | 0.60 (0.02) | 0.02 (0.01) | 0.065 (0.002) |
| [S iii] | 23.3 | 33.481 | 33.439 | 10.6 (0.01) | 0.22 (0.01) | 0.055 (0.001) |
| [Si ii] | 8.2 | 34.815 | 34.800 | 4.80 (0.01) | 0.10 (0.01) | 0.056 (0.001) |
| [Ne iii] | 41.0 | 36.014 | 36.000 | 1.27 (0.07) | 0.31 (0.02) | 0.66 (0.11) |
| Element | log X/H |
|---|---|
| He | 1.07 |
| C | 4.03 |
| N | 4.93 |
| O | 3.68 |
| Ne | 4.53 |
| Si | 5.13 |
| S | 5.48 |
| Cl | 7.03 |
| Ar | 6.08 |
| Fe | 5.78 |
| Line | Observations aaRelative to H. | CLOUDY aaRelative to H. |
|---|---|---|
| 3727 [O ii] | 2.4978 | 2.3101 |
| 3750 H12 | 0.0374 | 0.0314 |
| 3771 H11 | 0.0433 | 0.0407 |
| 3798 H10 | 0.0553 | 0.0542 |
| 3835 H9 | 0.0761 | 0.0746 |
| 3869 [Ne iii] | 0.3141 | 0.3191 |
| 4068 [S ii] | 0.0215 | 0.0225 |
| 4101 H | 0.2817 | 0.2612 |
| 4340 H | 0.4966 | 0.4705 |
| 4363 [O iii] | 0.0274 | 0.0272 |
| 4658 [Fe iii] | 0.0091 | 0.0094 |
| 4861 H | 1.0000 | 1.0000 |
| 4959 [O iii] | 1.3176 | 1.3660 |
| 5007 [O iii] | 4.0352 | 4.1118 |
| 5200 [N i] | 0.0072 | 0.0052 |
| 5270 [Fe iii] | 0.0047 | 0.0054 |
| 5518 [Cl iii] | 0.0059 | 0.0061 |
| 5538 [Cl iii] | 0.0042 | 0.0044 |
| 5755 [N ii] | 0.0037 | 0.0039 |
| 6300 [O i] | 0.0094 | 0.0504 |
| 6312 [S iii] | 0.0123 | 0.0120 |
| 6563 H | 2.9491 | 2.8930 |
| 6583 [N ii] | 0.2007 | 0.2025 |
| 6717 [S ii] | 0.1571 | 0.1991 |
| 6731 [S ii] | 0.1267 | 0.1506 |
| 7135 [Ar iii] | 0.0929 | 0.0888 |
| 7320 [O ii] | 0.0259 | 0.0288 |
| 7330 [O ii] | 0.0223 | 0.0234 |
| Line | Observations | Model | Obs./Model | ||
|---|---|---|---|---|---|
| A1+A2aaRelative to the total intensity of the H emission line in regions A1+A2. | A1bbRelative to the intensity of the H emission line in region A1. | A2ccRelative to the intensity of the H emission line in region A2. | A1+A2aaRelative to the total intensity of the H emission line in regions A1+A2. | ||
| 10.51 [S iv] | 0.26 | 0.15 | 0.08 | 0.11 | 2.4 |
| 12.81 [Ne ii] | 0.24 | 0.03 | 0.05 | 0.04 | 6.0 |
| 15.55 [Ne iii] | 0.66 | 0.40 | 0.37 | 0.38 | 1.7 |
| 18.71 [S iii] | 0.35 | 0.22 | 0.21 | 0.21 | 1.7 |
| 33.48 [S iii] | 0.92 | 0.43 | 0.41 | 0.42 | 2.2 |
| 34.82 [Si ii] | 0.42 | 0.20 | 0.28 | 0.25 | 1.6 |
| 36.01 [Ne iii] | 0.11 | 0.04 | 0.03 | 0.03 | 3.7 |
| Parameter Name | Unit | Best fit value | Confidence range |
|---|---|---|---|
| (1)aaParameter name. | (2)bbPhysical units of this parameter. | (3)ccBest-fit value (mean error per pseudo-filter band is 7%). | (4)ddfootnotemark: |
| Starburst age | Myr | 5 | |
| Silicates abundance | % | 0 | 05 |
| Graphite abundance | % | 67 | 5577 |
| Amorphous Carbon abundance | % | 33 | 2345 |
| a(min) | m | 0.008 | 0.0060.010 |
| a(max) | m | 40.0 | 10.8 |
| Size distribution exponent | n.a. | 4 | |
| Rout | pc | 435 | 380490 |
| Density exponent in shell | n.a. | 0 | |
| Tint | K | 500 | 479523 |
| 3 | 2.83.3 |