Modeling Spitzer observations of VV Ser. II. an extended quantum heated nebula and a disk shadow
Abstract
We present mid-infrared Spitzer IRAC and MIPS images of the UX Orionis star VV Ser and the surrounding cloud. The 5.6–70 m images show bright, localized and nebulous emission extended over centered on VV Ser. We interpret the nebulosity as being due to transiently heated grains excited by UV photons emitted by VV Ser. A companion paper describes how the physical structure of the VV Ser disk has been constrained using a wide range of observational data modeled by an axisymmetric Monte Carlo radiative transfer code. The model of the system in particular constrains the strength of UV radiation field throughout the envelope, and the nebulosity thus presents an opportunity for directly constraining the excitation mechanism and opacity law of PAHs in molecular clouds. In this paper we employ the model to study the nebulosity surrounding VV Ser using quantum-heated PAH molecules and Very Small Grains (VSGs) consisting of amorphous carbon in the thermal cooling approximation. Imprinted on the nebulosity is a wedge-shaped dark band, centered on the star. We interpret this dark wedge as the shadow cast by the inner regions of a near-edge-on disk in UV light, allowing the PAHs to be excited only outside of this shadow. The presence of a disk shadow strongly constrains the inclination as well as the position angle of the disk. The nebulosity at 5.6–8.0 m and the absorption feature seen in an archival spectrum from the International Ultraviolet Explorer can be fit using only PAHs, consistent with the main carrier of the feature being due to the graphite-like structure of the PAHs. The PAH component is found to be relatively smoothly distributed in the cloud, while the population of VSGs emitting at 20–70 m is strongly concentrated to the south east of VV Ser. Although depending on the adopted PAH opacity, the abundance of PAHs in the surrounding cloud is constrained to of the total dust mass, given the opacity. The extent of the nebulosity constrains the density of the gas surrounding the VV Ser disk to for a gas-to-dust ratio of 100. This low density suggests that the quantum heated material is not part of the original envelope of VV Ser and that it is rather a quiescent part of the Serpens molecular cloud that the star has passed into after being formed. Although relatively rare, quantum heated nebulosities surrounding single, well defined stars are therefore well-suited for gaining unique insights into the physics of very small particles in molecular clouds.
Subject headings:
accretion, accretion disks – circumstellar matter – stars: formation, pre-main-sequence – infrared: stars1. Introduction
It is well known that if a sufficiently small grain is hit by a high energy (ultraviolet) photon, the internal energy content far exceeds that of a grain in thermal equilibrium (Duley, 1973; Sellgren, 1984). Once the small grain has been heated, it will rapidly cool by emitting strongly in the mid-infrared wavelength regime. Yet, because the energy is distributed in many vibrational modes (typically ), the subsequent cooling of the grain takes place in an almost thermal (classical) manner. Such quantum-heated grains have been used to explain a range of observations in the past. Specifically, emission from polycyclic aromatic hydrocarbons (PAHs) require quantum-heating (Leger & Puget, 1984; Siebenmorgen & Kruegel, 1992), but also the presence of very small carbon/silicate grains (VSGs) of sizes has been inferred by infrared observations (Boulanger et al., 1988; Henning et al., 1998). In many extragalactic environments, observations with the Infrared Space Observatory (ISO) have shown the importance of emission from quantum-heated grains. VSGs have been suggested to play a crucial role for the emission spectra of especially starburst galaxies (Contursi et al., 2001; Förster Schreiber et al., 2003; Rouan et al., 2004). Typical for all environments with high UV fields is that PAHs dominate the spectrum from 5–15 m, while VSGs dominate at wavelengths m.
This paper is the second part of a study of Spitzer observations of the Herbig Ae star VV Ser. We focus on VV Ser for several reasons. Mid-infrared images obtained with the Spitzer Space Telescope as part of the Legacy Program “From Molecular Cores to Proto-planetary Disks” (Evans et al., 2003) show a bright bipolar nebulosity surrounding the central star. This was a considerable surprise since the nebulosity has no or little optical and near-infrared counterparts and therefore the density must be low such as not to create any detectable reflection nebulosity. The simplest way of explaining this, is if the nebulosity observed by Spitzer is caused by very small (m) transiently heated dust grains.
Another important reason for selecting VV Ser for further study is the presence of a dark band bisecting the entire mid-infrared nebulosity. The dark band has a “wedge-like” shape suggesting the presence of a nearly edge-on circumstellar disk. Yet, the extent of the band of or 60,000 AU is far too large for a circumstellar disk. Exactly this type of morphology has been seen in reflection nebulosities surrounding a number of young stars (Hodapp et al., 2004; Pontoppidan & Dullemond, 2005). These studies suggest that if an edge-on or nearly edge-on disk is surrounded by large-scale envelope material (or diffuse material), then the shadow cast by the disk into/onto the surrounding material in scattered light can be seen as a dark wedge-like band originating from the star and extending out to tens of thousands of AU, i.e. many times the size of the disk. There are good reasons to believe that any extended PAH emission excited by a single source should exhibit a similar behaviour due to the shadowing of ultraviolet photons by a circumstellar disk. In fact, the effect may be more pronounced in the case of quantum-heated grains since the exciting UV radiation from the central star will be subject to a stronger shadowing effect than near-infrared photons. The opening angle of a disk shadow and the sharpness of the shadow may constrain the structure and composition of the disk as well as the opacity spectrum of the quantum-heated grains. Disk shadows are therefore a powerful tool for studying the physical structure of spatially unresolved circumstellar disks. Clearly, the best way of analyzing these data is the simultaneous fitting of all available data with radiative transfer models of disks surrounded by an envelope.
There is considerable additional evidence that the VV Ser system is highly inclined (). This includes broad, double-peaked CO rovibrational emission lines from the fundamental band around m (Blake & Boogert, 2004). Near-infrared interferometric measurements, although somewhat ambiguous, seem to point to a high inclination (Eisner et al., 2003, 2004). Most importantly, perhaps, VV Ser is a well-known UX Orionis variable star, i.e. the star experiences frequent, but irregular, brightness dips, presumably due to orbiting dust clumps in the disk passing in front of the star. The first part of this study (Pontoppidan et al., 2006, henceforth Paper I) describes the observations of VV Ser in terms of its status as a UX Orionis type variable and argues extensively for a high inclination of the VV Ser disk. In Paper I we construct an axisymmetric Monte Carlo radiative transfer model of the VV Ser disk and use the model to show that the Spectral Energy Distribution (SED), the near-infrared interferometric visibilities of Eisner et al. (2004) as well as the UX Orionis variability can be explained in terms of a self-shadowed nearly edge-on disk. In the present study we use the same model with the addition of quantum heated grains to study the large extended nebulosity surrounding VV Ser. Our goal is to construct a single radiative transfer model that explains all the observed characteristics of VV Ser in terms of an inclined disk embedded in a relatively low density cloud containing PAHs and VSGs. Once the structure of the system as well as the radiation field is known, the physical properties of the quantum heated grains surrounding VV Ser can be constrained, in particular their abundance, and to some degree, their opacities.
This article is organized as follows: In Sect. 2 we describe the Spitzer imaging observations of VV Ser and in Sect. 3 the cloud environment in which VV Ser is embedded. Sect. 4 describes the radiative transfer model and our treatment of quantum-heated grains. Sect. 5 discusses how the Spitzer images and other imaging data compare to the model and Sect. 6 provides a discussion in particular of how quantum-heated nebulosities around isolated low-mass stars can be used to constrain the small grain population associated with star formation.
2. Observations
Most of the observations of VV Ser used in the modeling are described in Paper I. The mid-infrared spectroscopy and imaging were obtained with the Spitzer Space Telescope (Werner et al., 2004) as part of the Legacy program, “From Molecular Cores to Protoplanetary Disks” (c2d) (Evans et al., 2003), using all the available instruments [IRS, Houck et al. (2004), IRAC, Fazio et al. (2004) and MIPS, Rieke et al. (2004)]. In addition to the Spitzer-IRS mid-infrared spectroscopy of VV Ser presented in Paper I we use IRAC and MIPS imaging at 3.6, 4.5, 5.6, 8.0, 24 and 70 m of the area surrounding VV Ser. The imaging was reduced using the c2d mosaicking pipeline (see Harvey et al. (2006); Spiesman et al. in prep. for IRAC and MIPS, respectively). In support of the Spitzer observations, we have also obtained a continuum map at 850 m with SCUBA on the James Clerk Maxwell Telescope (JCMT) (see also Paper I). From the European Southern Observatory archive, we have extracted archival images in the -, - and -bands obtained with SOFI at the New Technology Telescope (NTT)111In part based on observations obtained at the European Southern Observatory at La Silla under program 67.C-0042(A).. The near-infrared images were reduced using standard methods of dark subtraction, flat field correction and registering of individual frames using cross correlation. An ultraviolet spectrum obtained with the International Ultraviolet Explorer (IUE) was obtained from the IUE archive and is described in Paper I.
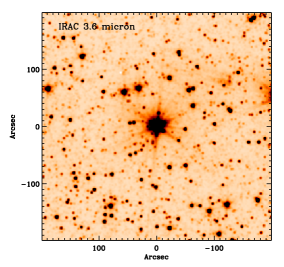
3. The molecular surroundings of VV Ser
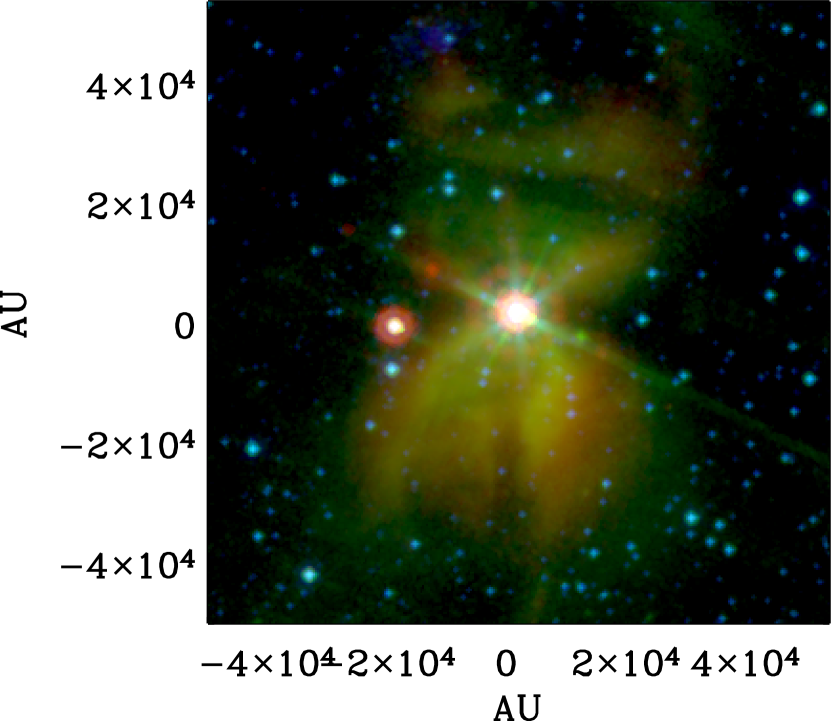
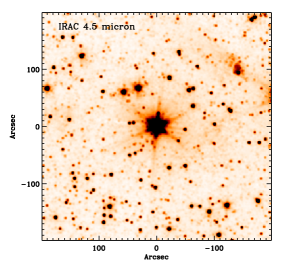
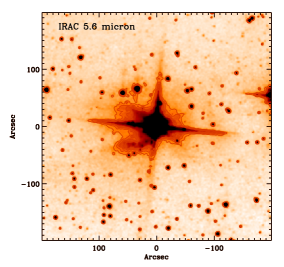
VV Ser was identified as a particularly interesting object when mid-infrared IRAC and MIPS images revealed that the star is surrounded by a bright, extremely large nebulosity not seen in near-infrared images. An IRAC/MIPS color composite image is shown in Fig. 1. The nebulosity extends over an area at least 6 arcminutes (or 94,000 AU at a distance of 260 pc) across and is brightest in the 8.0, 24 and 70 m bands (IRAC4, MIPS1 and MIPS2), but is also weakly detected in the 5.6 m band (IRAC3). At 3.6 and 4.5 m (IRAC1 and IRAC2), no extended emission is detected. We interpret the nebulosity as being due to a quantum-heated component of either an envelope or simply the surrounding molecular cloud. The relatively low extinction (mag) toward VV Ser strongly suggests that little original envelope material is left. This quantum-heated component likely consists partly of Polycyclic Aromatic Hydrocarbons (PAHs) and partly of Very Small Grains (VSGs). The presence of the VSGs is inferred from the bright 24 and 70 m nebulosity (see Sect. 5.1). The presence of such compact, mid-infrared nebulosities is clearly a rare, but not unique, phenomenon, judging from the larger c2d Spitzer maps.
The optical colors of the star correspond to a steady extinction of , but with frequent, non-periodical dips lasting of order 10 days of 0.5–3.0 additional magnitudes of extinction. Using the 2MASS point source catalog, an average extinction through the Serpens cloud in a field around VV Ser is determined by fitting a reddened main sequence to the colors of background stars in the field. Assuming a near-infrared extinction law of (Kaas, 1999) an average extinction of is found. For an optical extinction law, this corresponds to an . The lower resolution extinction map of Cambrésy (1999) finds an extinction of mag in the region. For a constant density molecular cloud, this places VV Ser roughly in the middle (along the line of sight) of a filament aligned in the north-south direction. The northern end of the filament culminates in the famous Serpens Cloud Core [incidentally, the Serpens Core contains CK 3, another disk shadow candidate, Pontoppidan & Dullemond (2005)]. The width of the filament is roughly (Cambrésy, 1999). Using the conversion between column density and extinction in the -band from Vuong et al. (2003), , the molecular cloud density around VV Ser is estimated to cm-3.
4. Model
To model the observed SED and Spitzer imaging of VV Ser, we use the axisymmetric Monte Carlo radiative transfer code RADMC (Dullemond & Dominik, 2004) in combination with the raytracing capabilities of the more general code RADICAL (Dullemond & Turolla, 2000). The density structure is axisymmetric, but the photons are followed in all three dimensions. The RADMC code is used to derive the temperature structure and scattering source function of a given dust distribution. Once these parameters are known, images can be calculated using RADICAL. This setup has been used to model similar protostellar disks (Pontoppidan et al., 2005; Pontoppidan & Dullemond, 2005). In Paper I it is described how the physical disk structure is constrained to fit the observed SED, images and UX Orionis behaviour. In this paper, we add a simple treatment of quantum-heated grains to the model in order to describe the mid-infrared nebulosity surrounding VV Ser. We note that while the treatment of quantum heated grains included in the model is intended for the VV Ser nebulosity, it can easily be adapted to treat a wide range of axisymmetric radiative transfer problems. One obvious possibility is the treatment of emission from PAH molecules in the disk itself, although that would require the inclusion of multi-photon excitations. The code only treats isotropic scattering, which is not a good approximation for the UV photons considered in the models. However, in terms the quantum heated nebulosity we argue that the scattering phase function only plays a minor role. Since the optical depth to scattering of UV photons is only through the envelope, the majority of photons heating small grains in the extended nebulosity have experienced at most a single scattering event from the disk surface. This introduces an error of up to a factor of two in surface brightness - similar to the uncertainty on the opacities used.
4.1. Quantum heated grains and multi-dimensional radiative transfer
Quantum heated grains are treated in the model using the “continuous cooling” approximation (e.g. Guhathakurta & Draine, 1989). This popular approximation is valid for sufficiently large grains/molecules. In principle, it should only be used for grains with more than 100 atoms, but in the case of PAHs it was found by Draine & Li (2001) to provide accurate results for molecules as small as C30Hx by comparing to the full statistical treatment. The continuous thermal cooling approximation is a method for calculating PAH emission spectra without having to treat the radiative transfer in a full quantum mechanical framework. When including quantum heating in a multi-dimensional radiative transfer code, this approximation results in an significant advantage in terms of CPU time relative to a code calculating a full transition matrix treating all upwards and downwards transitions between vibrational modes. We emphasize that the code presented here is also very portable to any kind of axisymmetric structure.
In the adopted approximation, grains are heated in a quantized fashion, but cooled classically. The necessary assumption is that a sufficient number of vibrational modes are excited in the grain to create a continuous cooling behaviour, at least in the temperature range where most of the power is radiated. In terms of the radiative transfer, a necessary assumption is that the absorbed and emitted radiation fields are decoupled. In the case of PAHs, this amounts to assuming that infrared photons do not excite the PAH molecules to significant temperatures. In the current version of the code, only single photon excitations are treated. Multi-photon excitations are important for very strong radiation fields and do not apply to the nebulosity surrounding VV Ser at distances of 5,000–50,000 AU from the central star, where no additional photons will strike a given PAH molecule in the time it takes to cool to the background temperature. For inclusion of disk PAHs, multi-photon excitations will be essential and therefore we do not attempt to model the disk PAH features seen in the Spitzer spectrum.
4.2. The thermal cooling approximation
The treatment of quantum heated grains can in the thermal cooling approximation be regarded as a post-processing add-on to the radiative transfer Monte Carlo code. The Monte Carlo code uses the Bjorkman & Wood (2001) method with continuous absorption according to the Lucy (1999) algorithm. This method follows photon packages from the surface of the central star as they travel through a gridded density structure. Photon packages can be scattered, changing their directions, or absorbed, altering both their wavelength and direction. The code supplies the UV radiation field at each grid point, and the calculation of the non-thermal emission is a matter of calculating a response function that can convert the fraction of UV photons absorbed by non-thermal grains into infrared photons.
In essence, to avoid the computationally intensive task of re-calculating the temperature distribution function of the quantum heated grains every time a photon interacts with a grid cell, we split the problem in the following way: The mean intensity of quantum heating photons is obtained by adding the energy absorbed from each photon packet passing through a given cell. The mean intensity for each grid point is then saved and used at the end of the Monte Carlo run to calculate the source function of quantum heated grains, as described below. To facilitate this approach, the photon packages are divided into primary and secondary components. The primary photon packages are those that originate at the stellar surface, and are only scattered. If a primatry photon package is absorbed by a quantum-heated grain, it is lost to the Monte Carlo code. If it is absorbed and re-emitted by a thermal grain, it is converted to a secondary photon package. All grains, including quantum-heated grains, are treated as thermal by a secondary photon package. After completing the Monte Carlo run, the primary photon packages absorbed by the quantum-heated grains are used by an external code to calculate a quantum-heated emissivity. When this is done, a second Monte Carlo run can be executed in which photons can be launched from the quantum heated grains according to the emissivity calculated by the external code, in addition to photons launched from the stellar surface. Photon packages launched by quantum heated grains begin as secondary grains, and will only heat thermal grains. Typically, the effects of this second Monte Carlo run on the SEDs and images are minor.
For PAHs, this split between primary and secondary photon packages is likely accurate since the PAH opacity drops by at least 3 orders of magnitude above 1 m, according to the opacities of Li & Draine (2001). So even though there are 10–100 times more photons at near-infrared wavelengths than at UV wavelengths, only 1-10% of the heating events will potentially be due to infrared photons. However, recent laboratory results have shown that at least some classes of ionized PAHs may have significant cross sections in the near-infrared (Mattioda et al., 2005). Clearly, future work will need to explore the effects of this in further detail. In terms of the model, an under-estimate of the near-infrared cross section may result in an over-estimate of the abundance of quantum heated grains. Note, however, that single infrared photons will not be able to excite PAHs to the temperatures responsible for the short-wavelength PAH features below 10 m. For carbonaceous or silicate VSGs, this assumption may be less valid because these types of grains have a less steep opacity curve.
In the following, is a frequency of the UV radiation field (primary) photon as opposed to , which indicates a frequency of a re-emitted secondary photon.
The cooling rate of the quantum heated grains, assumed to be radiating thermally, is:
| (1) |
where is the opacity of the quantum heated grains, and is the Planck function. The time to cool to a temperature, , can then be calculated as:
| (2) |
where is the heat capacity of the dust material. is the enthalpy curve related to the bulk material of which the quantum heated grains consist. The grain contains atoms, which in the case of a PAH molecule refers to the number of carbon atoms. The peak temperature, , reached when the grain is hit by a photon of energy is simply found via the enthalpy curve:
| (3) |
The next step is to calculate the time-integrated emission per mass of the quantum-heated grains. This produces the output energy spectrum emitted if one photon of energy is absorbed.
| (4) |
The emissivity of the quantum heated grains is then determined by the UV radiation field alone, (e.g. in units of erg s-1 cm-2 Hz-1 sterad-1), and the mass density of transiently heated particles, . Integrating over the photons absorbed by the quantum heated grains defines a response matrix, yielding an emissivity as a function of an input radiation field spectrum:
| (5) |
We have included the effect of destroying the grains if is higher than the sublimation temperature. In essence this works as an energy sink since the absorbed energy is assumed to be used to heat the gas and subsequently be emitted as gas-phase lines in an optically thin part of the spectrum. The grain destruction is described by the step function, :
| (6) |
In fact, for the single photon excitation case, no grains are destroyed, since a 0.1 m photon will excite a C50H20 PAH molecule to just under 1500 K and a 1000 atom silicate grain to 200 K. However, for the multi-photon excitation case, grain destruction may play an important role for the radiation fields present within a few AU of a Herbig AeBe star.
4.3. PAH and VSG opacities and enthalpy curves
The physics of a given population of quantum heated grains is contained in the opacity, in the enthalpy curves and the grain size. The presence of strong 24 and 70 m nebulosity in addition to the 6–8 m emission suggests that both a PAH component (providing the short wavelength opacity) as well as a carbon and/or silicate VSG component (to provide the far-infrared opacity) are required. The PAH opacity, , has been calculated using the code of Visser et al. (in prep), following the method of Draine & Li (2001). This opacity includes a graphite-like continuum opacity and is similar to that of Li & Draine (2001) (see their Fig. 2). For this paper, we opted to use a single generic PAH molecule consisting of neutral C50H20. In reality, the PAH component is much more complicated and requires the use of a full chemical code to determine. For the purposes of fitting the broad-band photometry of the nebulosity around VV Ser, a simple PAH opacity is deemed sufficient. The model framework developed for VV Ser is a good starting point for including a full PAH chemical network.
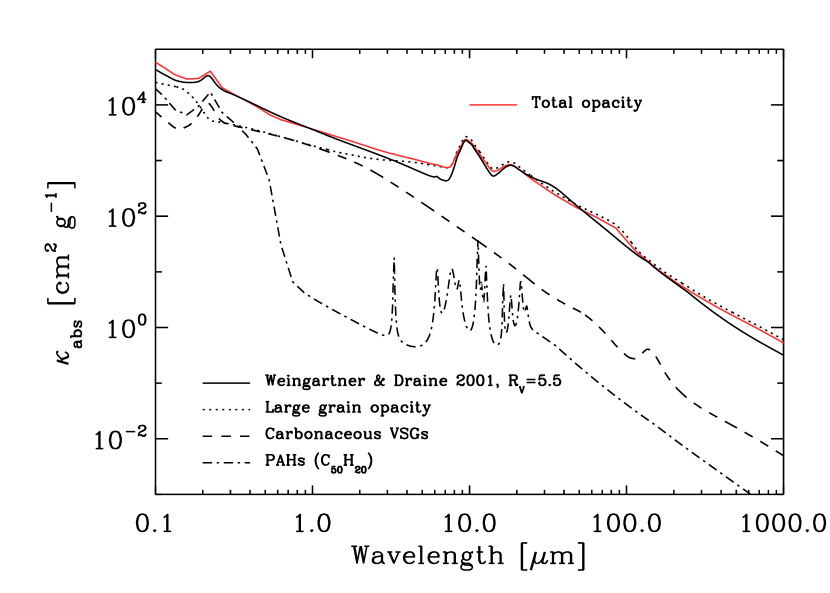
The nature of the VSG component is even less constrained. It is clear that a quantum-heated component is needed to produce the 24–70 m flux. To achieve this, the grains must be heated by UV–near-infrared photons to temperatures of order 150–300 K. If UV photons are responsible, then grains significantly larger than the PAHs are needed. In the literature, both silicate and carbonaceous VSGs have been proposed, presumably as amorphous solids to avoid producing strong spectral resonances. Following Weingartner & Draine (2001), we assume that the VSGs are mostly carbonaceous in nature, with a size distribution corresponding to a small grain tail of the larger grains. For the VSGs, we use the opacities of spherical graphite grains in the Rayleigh limit. The enthalpy curve for the VSGs is the same as that of the PAHs with a single size of 500 C atoms. The exact choice in size makes little difference in the absorption coefficient, but is important when calculating the heat capacity for a single grain; smaller grains can be heated to higher temperatures by a photon of a given energy. Since the SED of the nebulosity is not well-constrained in the far-infrared, the size of the VSGs cannot be directly constrained. For the PAH/VSG enthalpy curve, we use the parametrized form of Chase et al. (1985), relevant for graphite. The properties of the quantum heated grains are summarized in Table 1 and the opacity curves of the various envelope dust components are compared in Fig. 2.
5. Fitting the envelope structure
The constructed model is able to fit data spanning four orders of magnitude in wavelength and five order of magnitude in spatial scale (see Paper I for a discussion of the fit on small spatial scales). In this section, it is discussed how each observational property is connected to the model.
| Parameter | Model value | |
|---|---|---|
| cm-3 | ||
| 15 000 AU | ||
| 50 000 AU | ||
| PAH size | C50H20 | |
| VSG size | 500 C | |
| %1 | ||
| %1,2 | ||
| Disk shadow pos. angle | ||
| Disk incl. |
-
1
Abundances are given in terms of percentage of the total dust mass (quantum heated + thermalized grains).
-
2
The VSG abundance is for the south-eastern clump.
5.1. Mid-infrared nebulosity
A central property of the model of VV Ser is the ability to reproduce the bright nebulosity observed at mid-infrared wavelengths with Spitzer-IRAC and MIPS. Clearly, a mid-infrared nebulosity extending over associated with a young star is not a common occurrence. Assuming a distance of 260 pc mid-infrared emission is detected up to 47,000 AU from the central star. In IRAC4, MIPS1 and MIPS2 (centered on 24 m and 70 m) a maximum surface brightness of 3, 4 and 18 mJy/sq. arcsec is reached at a distance of 15,000 AU (see Fig. 5). This corresponds to color temperatures between IRAC4 and MIPS1 of 360 K and between MIPS1 and MIPS2 of 85 K. Tests using the model showed that it is not possible for dust grains in thermal equilibrium with the radiation field from the central star to produce such bright nebulosity in the mid-infrared at these radii, except at 70 m where small thermal grains can explain the emission. The inclusion of quantum-heated grains readily produces a nebulosity with high surface brightness around a star as luminous as VV Ser. A possible way of producing non-thermal continuum emission is via quantum-heated VSGs or PAHs or a mix of both. In this context it is important to note that the nebulosity is bright at all wavelengths beyond 5.6 m (IRAC 3) and in fact continues to rise to dominate the total SED at 70 m. It is also interesting to note that the 24 and 70 m emission is not smoothly distributed around the source, but is strongly concentrated to the south-east of the star. The 8 m emission, on the other hand, appears more evenly distributed. All imaging modes in which the nebulosity is detected show a dark band centered on the star with a position angle of 10–20°.
The observed nebulosity clearly has a complex 3-dimensional structure that cannot be modeled in detail by an axi-symmetric code. The model is intended to fit an average surface brightness. However, we argue that the mid-infrared emission must be optically thin, and that the surface brightness therefore is a function of column density and UV field only. This allows the model to be used to fit an average PAH abundance in the surrounding cloud. The quantum-heated PAHs are included in the model setup as described in Sect. 4.1. The surrounding material is assumed to have a density profile decreasing as , except within 15,000 AU of VV Ser, where the cloud density is constant and lowered by a factor of 10 relative to the density at 15,000 AU to fit the fact that the nebulosity peaks at 15,000 AU. In addition to the spherical cavity, the morphology of the nebulosity suggests the presence of a conical cavity perpendicular to the disk, reminiscent of an outflow cavity. The envelope is thus modeled by the following expression for 15,000 AU:
| (7) |
where:
| (8) |
The parameters of the cavity were not varied in the fit. The envelope emission can then be modeled using four parameters: the total dust density at 15,000 AU, the PAH and VSG abundances and the total extinction toward the central star. The extinction or total column density of the cloud is considered fixed. This leaves three parameters to be varied to fit the surface brightness profiles at 8.0, 24 and 70 m, where the nebulosity is detected with sufficient signal-to-noise.
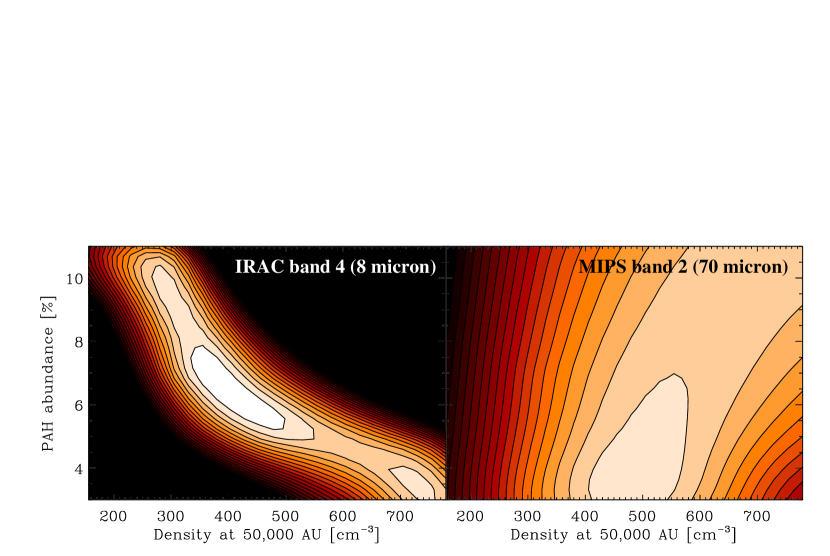
To find the best-fitting cloud density and PAH abundance, we calculated a grid of models, comparing each model to the imaging data. The model images were convolved with theoretical Spitzer point spread functions, calculated using the STINYTIM package ver. 1.3 for pre-launch parameters (Krist 2002, SSC web site). The goodness-of-fit estimate is the sum of the squared differences in pixel values between the observed and model intensities in a cross section along the polar axis: .
We find that by using only the IRAC 4 band for the goodness-of-fit estimate, the model becomes degenerate in the sense that a lower cloud density can be compensated by a higher PAH abundance. This is simply the optically thin limit. However, since the relevant optical depth is measured in the UV region of the spectrum, increasing the density too much will cause the nebulosity to become optically thick to UV photons at relatively small distances to the central star. In the model grid, we find that emission above 50 m, and therefore also the MIPS2 70 m emission, is dominated by the thermal grains, rather than emission from the VSGs. This provides a convenient independent measure of the density of the thermal grains. Therefore, by comparing the 8, 24 and 70 m bands, the PAH and VSG abundances can be constrained to % and % of the total dust mass. The outer cloud density is found to be . The result is illustrated by the goodness-of-fit surfaces in Fig. 4. The best-fitting PAH abundance corresponds to or % of the C atoms being bound in PAHs assuming a gas-to-dust ratio of 100 and a cosmic C/H ratio of (Holweger, 2001; Allende Prieto et al., 2002). This is consistent with other estimates of the abundance of PAHs in molecular clouds and photo-dissociation regions (Boulanger et al., 1998; Tielens et al., 1999). Note that the cloud density matches well that () determined using the extinction map of Cambrésy (1999).
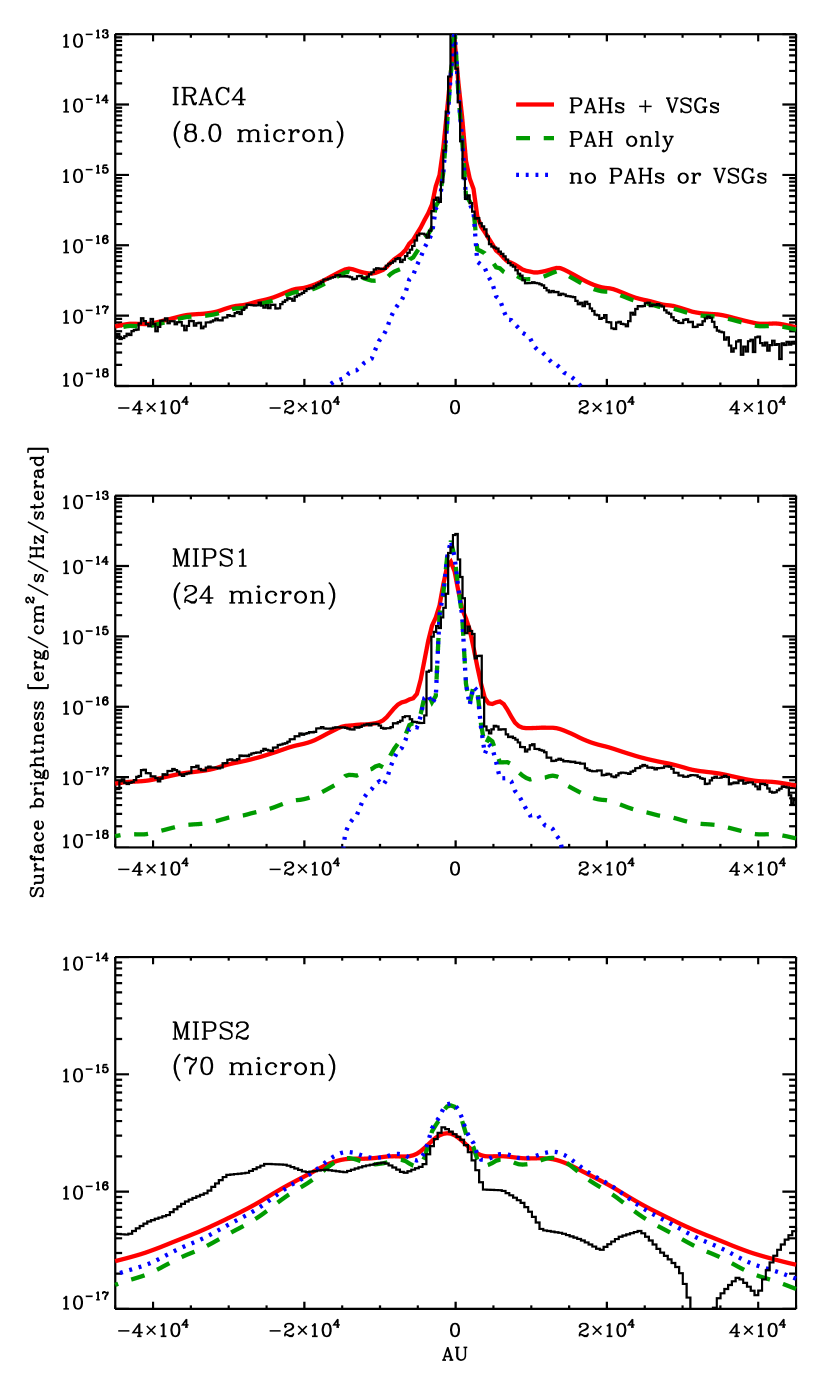
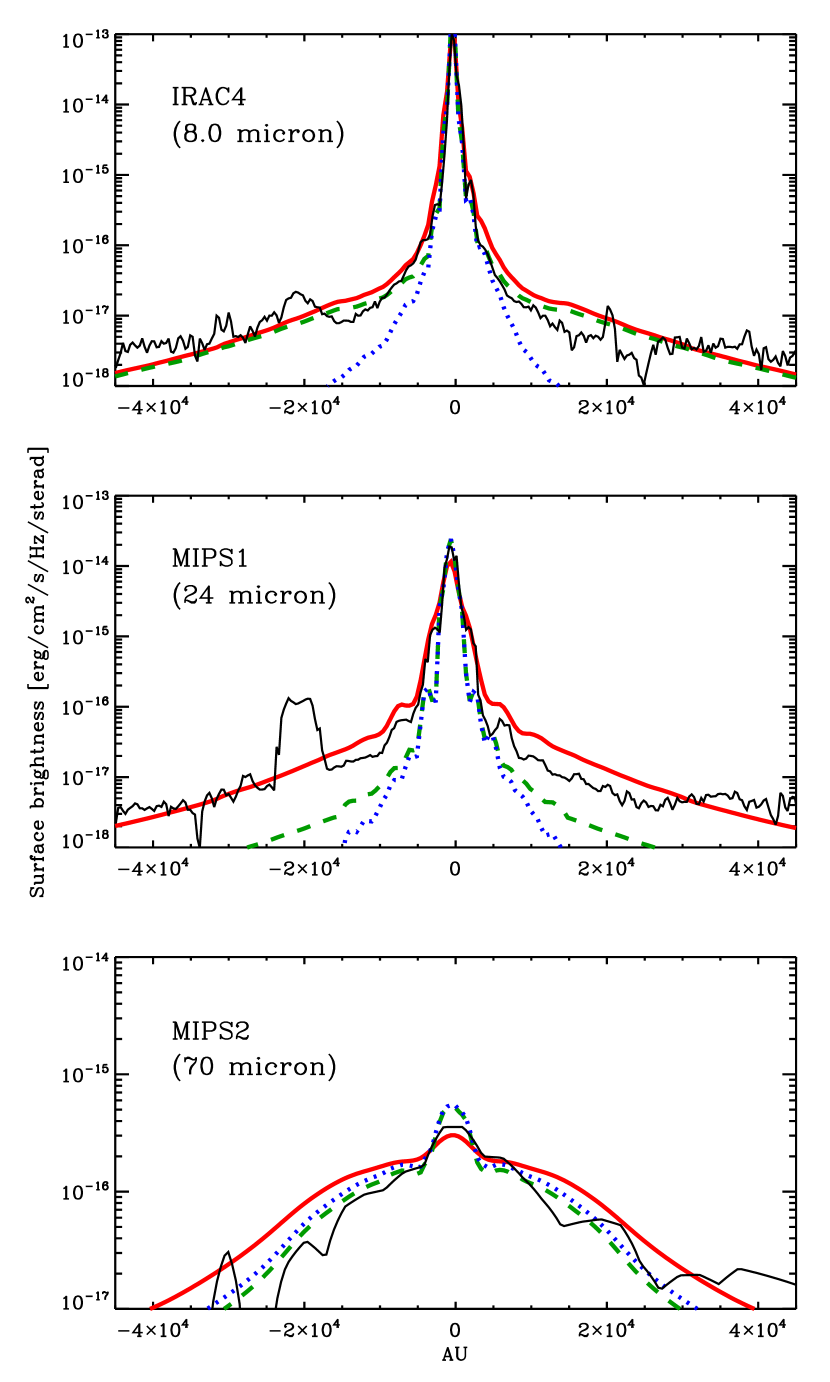
Fig. 5 shows model cross sections of the best-fitting model compared to the Spitzer images parallel and perpendicular to the disk plane of VV Ser. Model cross sections for envelopes with no VSGs and with no quantum heated grains are also shown. This plot illustrates the constraints used to fit the envelope. The addition of the PAH component is clearly necessary to fit the 8 m image, while the VSGs are required to fit the 24 m image. The 70 m image shows significant extended emission due to thermal grains. The model somewhat under-predicts the surface brightness in the western part of the envelope at this wavelength, although that could possibly be corrected by changing the VSG opacity.
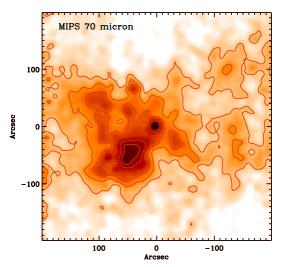
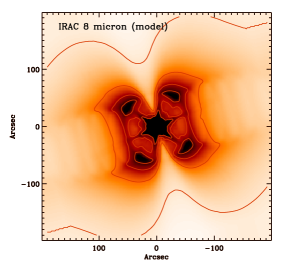
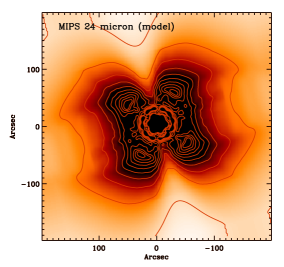
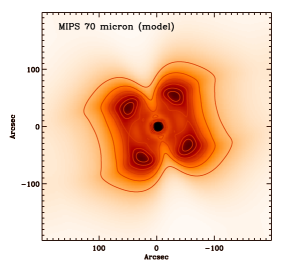
Fig. 6 shows the Spitzer images from 4.5 to 70 m, along with the model fits at 8, 24 and 70 m. The IRAC and MIPS images are seen to be reasonably well fitted in terms of the shadow and the south-western emission blob. However, the axisymmetric nature of the model makes the fit worse regarding other details in the morphology of the envelope emission.
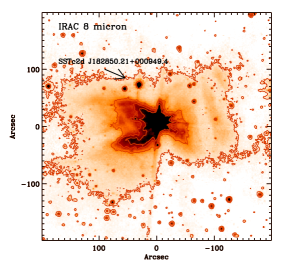
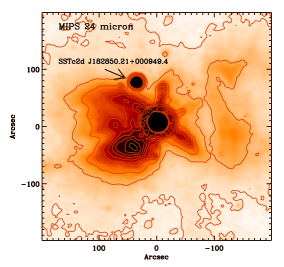
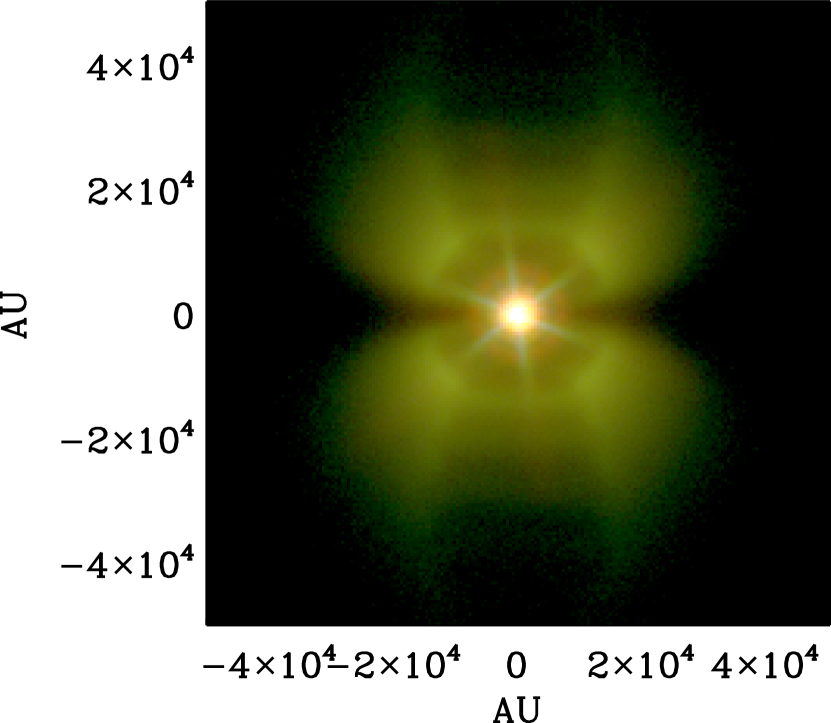
5.2. Disk shadow
A wedge-like dark band in the mid-infrared nebulosity appears naturally in the model and matches well that observed in the IRAC and MIPS images. This is due to the disk blocking UV photons from propagating through the disk plane causing a shadow to be cast across the PAH nebulosity where the small grains do not get quantum-heated because of the absence of UV photons. While the nebulosity and superposed shadow are expected to be similar in morphology to those seen in reflection nebulae, this is a new type of shadow governed by an entirely different physical process from single scattering. The opening angle of the shadow is a measure of the maximum height of the surface of the disk. In the case of VV Ser, the shadow is wide, corresponding to a . For a self-shadowed disk like VV Ser, the maximum is located at the puffed-up inner rim. The height at which the inner rim becomes optically thick to UV photons is therefore AU at the inner rim AU. The inner rim scale height achieving this is about 50% larger than that expected from a disk in hydrostatic equilibrium. A scale height smaller than that of an equilibrium disk would be easier to explain, for instance as being due to dust settling. A larger scale height is more difficult to understand. Note, however, that the height at which the disk becomes optically thick to UV photons is degenerate in the scale height and the total disk mass, with a larger disk mass compensating for a smaller scale height. A significant change in the disk mass of 1-2 orders of magnitudes is required to achieve this effect. Alternatively, since the shadow is only probing the vertical density profile at large heights, a relatively small change in the wings of the profile at large heights while preserving a hydrostatic (Gaussian) profile in the disk mid-plane may explain the observations. One possibility for such a departure is that small grains are lifted to large heights by the flow of a disk wind (Shu et al., 1994). Detailed calculations will be required to determine whether this process can produce a significant dust column density along the line of sight.
Also evident is that the shadow is not straight in the Spitzer images, i.e. does not follow a straight line through the origin, but curves away from this line. For a disk shadow, this effect occurs when the disk inclination deviates significantly from edge-on and allows the inclination of VV Ser to be constrained to (see also the discussion in Pontoppidan & Dullemond, 2005). The model also reproduces the ratio of surface brightness inside the shadow, as compared to that out of the shadow, which is an interesting test of the density structure of the disk model.
While the shadow appears in the images because quantum-heated grains are excited by high energy photons only, the lack of UV photons in the disk plane is expected to significantly affect the chemistry of the molecular cloud as well. In other words, a different chemistry is expected to be seen inside the shadow as compared to outside [see also Semenov et al. (2005)].
5.3. Near-infrared images
The near-infrared images from the NTT-SOFI are useful for obtaining an upper limit to the surface brightness of any scattered light at these wavelengths. It is important that this is consistent with the cloud density derived from the mid-infrared nebulosity. The observed upper limit on the surface brightness is 22 and 20.5 mag/sq. arcsec for the and bands, respectively. The model yields a surface brightness due to scattering of , , and mag/sq. arcsec at from the star if the quantum-heating is turned off, i.e. these values refer to pure scattering. However, including the quantum-heated PAHs increases both the - and -band surface brightnesses by 2 magnitudes. This is due to the near-infrared continuum opacity introduced to the PAH opacity in Li & Draine (2001) to fit observations of reflection nebulae in massive star-forming regions. This means that slightly deeper imaging is expected to show nebulosity in the near-infrared. In this context, it is also interesting to note that the increase of 2-3 orders of magnitude in the near-infrared PAH opacity compared to the Li & Draine (2001) opacity as suggested by Mattioda et al. (2005) would result in easily detectable extended emission in the SOFI images. This this is not seen, suggesting that the PAH opacity curve in the VV Ser nebulosity is similar that of Li & Draine (2001) and that the PAHs are therefore likely mostly neutral or negatively charged. Alternatively, significantly larger PAHs than those used here may also reduce the near-infrared extended emission.
5.4. UV spectrum
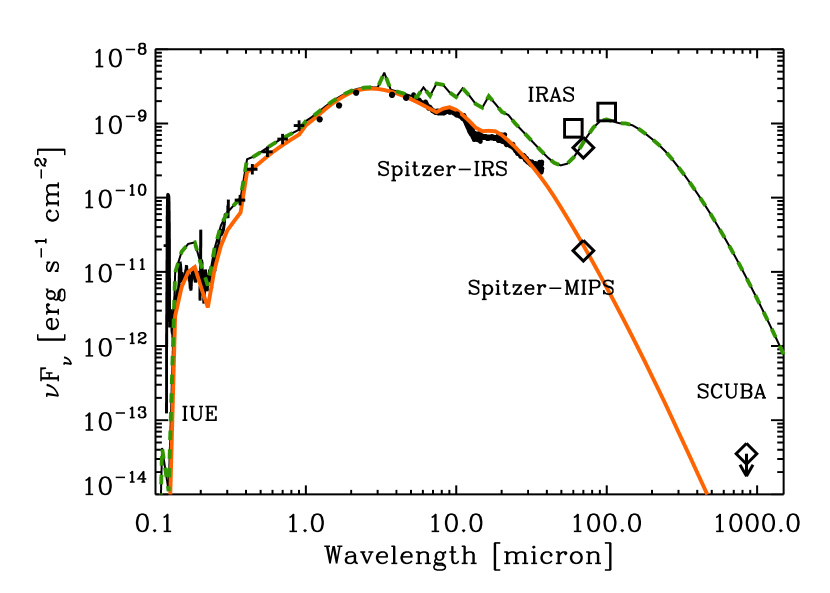
A high quality ultra-violet spectrum of VV Ser obtained with the International Ultraviolet Explorer (IUE) exists (see also Paper I). This provides an important direct constraint on the UV power injected into the system. The UV radiation field in the envelope and the resulting PAH excitation can therefore be calculated with some confidence. Care has been taken in fitting the SED to the UV spectrum. It is interesting to note that the IUE spectrum shows shallow absorption from the well-known, but unidentified, band always seen in the galactic interstellar extinction curve (see Draine (2003) and references therein). Our model of VV Ser produces a 2175 Åfeature 2 times deeper than that observed, indicating that this band is too strong in the assumed PAH opacity.
Large PAH molecules have previously been identified as a possible carrier of the band (Weingartner & Draine, 2001) (see also Fig. 2). However, these studies fixed the PAH abundance to fit the observed band. Since the emission nebula surrounding VV Ser provides an independent measure of the PAH abundance that produces a band that is even too strong, our results seem to support that the PAHs likely contribute significantly to this feature. No good fit can be obtained to the IUE spectrum unless the feature is at least dominated by the PAH opacity. For example, if the feature is dominated by another carrier, the PAH abundance would be lowered significantly (by at least a factor of 4). To compensate, a fit to the 8 m nebulosity would require the density to be increased beyond the where the surface passes inside the observed quantum heated nebulosity. It should be noted that since the actual UV opacity of PAHs is not well known, significant uncertainties remain. In particular, if the actual PAH opacity does not have a feature, contrary to the Li & Draine (2001) opacity, then no strong constraints on the PAH abundance can be derived from the UV spectrum.
6. Discussion
How common are extended quantum-heated nebulosities associated with single (low- or intermediate-mass) young stars and what do they tell us? In this study, the mid-infrared nebulosity around VV Ser is interpreted as belonging to the general Serpens molecular cloud, i.e. the observed PAH/VSG emission is consistent with a constant density cloud. The carrier of the far-infrared emission, on the other hand, is not distributed evenly. As such the nebulosity is a direct measure of the UV radiation field around VV Ser; the nebulosity exists because the density (and therefore PAH density) is not so low as to not have sufficient PAH molecules, yet the density is not so high as to block all UV photons from penetrating to the observed edge of the nebulosity at 30,000 AU. At the same time, there is a strict upper limit on the density of small dust grains surrounding VV Ser from the lack of reflection nebulosity in the near-infrared. The lack of extended emission in the near-infrared also puts an upper limit of the near-infrared opacity of the PAHs, roughly consistent with the opacity of Li & Draine (2001). Deeper optical/near-infrared imaging may detect the faint reflection nebulosity predicted to be there. In the case of VV Ser, this translates to a gas density of cm-3, assuming a dust-to-gas ratio of 100 - a value that corresponds well to that derived by the extinction map of Cambrésy (1999). If the density is increased by a factor of a few, the PAH nebulosity around VV Ser becomes significantly more compact, though still visible, because of extinction of UV photons by the large grain population. It is therefore expected that Spitzer will detect more of such quantum-heated nebulae associated with stars that happen to be embedded in the more diffuse parts of molecular clouds.
Such nebulae may be important for several reasons. First, a well-defined stellar photosphere gives the possibility for accurately calculating the input radiation field; the input spectrum can be determined by simply obtaining a UV-optical spectrum of the star in question. In the absence of a star one must resort to using a much more poorly defined interstellar radiation field. Using a radiative transfer model coupled with a spectrum of the nebulosity, it is possible to directly measure the emissivity of the PAH molecules in the cloud for comparison with laboratory data. For instance, in the case of VV Ser, it can be concluded that the near-infrared PAH opacity is low, in accordance with the opacity model of Li & Draine (2001). Furthermore, by mapping differences in PAH features in the radial direction (through a diminishing radiation field), it is possible to map the chemistry, hydrogenation and ionization state of the PAHs and couple those directly to the radiation field. Finally, the far-infrared spectral slope of the nebulosity will constrain the composition and size distribution of the VSG component. Such sources may therefore be very important for deciphering the role of PAHs and VSGs in molecular clouds.
The fact that in our self-shadowed disk model most of the observed disk shadow is created by the innermost parts of the disk suggests that the mid-infrared nebulosity may be variable on timescales of 1-10 years (at least the dynamical timescale of the puffed-up inner rim). This possible variability should be seen as variations in the shadow opening angle. A long term variability of VV Ser has indeed been observed in the optical, in addition to the UX Orionis events (see Paper I), which may suggest that this is reflected also in the shadow morphology. However, it is highly unlikely that the shadow will experience strong changes, such as disappearing entirely.
7. Conclusions
Spitzer imaging of the Herbig Ae/UX Orionis star VV Ser has shown it to be surrounded by a very extended, but bright nebulosity. The nebulosity is detected from IRAC band 3 at 5.6 m to MIPS2 at 70 m. Using the disk model for VV Ser developed in Paper I as a starting point, we model the extended mid-infrared nebulosity surrounding the star by adding small transiently heated grains to the surrounding material.
-
•
We show that the nebulosity is most likely due to quantum-heated small grains consisting of both PAHs and somewhat larger carbonaceous/silicate grains of perhaps atoms. The best-fitting abundances are 4-6% and 5-7% by mass for PAHs and VSGs, respectively, although these values depend somewhat on the opacities used. Assuming the PAH opacity of Li & Draine (2001) is appropriate, we find that the feature must be mostly due to the graphite-like structures within the PAH molecules.
-
•
While the PAHs appear to be evenly distributed at distances of 15,000–50,000 AU from the central star, the VSG component is more structured with most of this material concentrated in a clump AU to the south-east of VV Ser.
-
•
The nebulosity is observed to be bisected by a wedge-shaped dark band extending across the entire nebulosity with a position angle of (east of north). We interpret this as a large shadow cast by the small 50 AU central disk by blocking UV photons from reaching the surrounding cloud. This is fully consistent with the disk model developed in Paper I. The opening angle of the shadow shows that the opening angle of the surface of the disk is . The inferred disk inclination of and position angle of ( east of north) are important constraints for interpreting the model presented in Paper I, in particular in relation to the near-infrared interferometry of Eisner et al. (2004).
-
•
We propose that the VV Ser nebulosity and other isolated quantum heated regions excited by a single star with a well-defined UV spectrum may be used to strongly constrain the properties of PAHs and other types of small grains in molecular clouds. For instance, the relation of the ionization state of PAHs to the UV field can be accurately mapped with a mid-infrared spectral map of the nebula.
-
•
Additionally, the shape of the mid to far-infrared spectrum of the nebula will constrain the size distribution of VSGs. In principle, such observations coupled with simple radiative transfer calculations can serve as a calibration for studies of more complex regions containing quantum heated grains, such as extra-galactic sources, massive star-forming regions and circumstellar disks.
-
•
Disk shadows cast on quantum heated nebulosities are useful for measuring the surface of circumstellar disks and therefore provide constraints on the grain size distribution in the upper layers of disks. We have also shown that due to the large size of disk shadows, they are very convenient for determining inclination and position angles for disks that are otherwise impossible to spatially resolve through direct imaging. Spitzer-IRAC and MIPS imaging surveys are excellent tools for identifying quantum heated nebulosities around single stars, and Spitzer-IRS is well suited for follow-up spectroscopy.
References
- Allende Prieto et al. (2002) Allende Prieto, C., Lambert, D. L., & Asplund, M. 2002, ApJ, 573, L137
- Bjorkman & Wood (2001) Bjorkman, J. E., & Wood, K. 2001, ApJ, 554, 615
- Blake & Boogert (2004) Blake, G. A., & Boogert, A. C. A. 2004, ApJ, 606, L73
- Boulanger et al. (1998) Boulanger, F., Abergel, A., Bernard, J. P., Cesarsky, D., Puget, J. L., Reach, W. T., Ryter, C., Cesarsky, C. J., Sauvage, M., Tran, D., Vigroux, L., Falgarone, E., Lequeux, J., Perault, M., & Rouan, D. 1998, in ASP Conf. Ser. 132: Star Formation with the Infrared Space Observatory, 15–+
- Boulanger et al. (1988) Boulanger, F., Beichman, C., Desert, F. X., Helou, G., Perault, M., & Ryter, C. 1988, ApJ, 332, 328
- Cambrésy (1999) Cambrésy, L. 1999, A&A, 345, 965
- Chase et al. (1985) Chase, M., Davies, C. A., Downey, J. R., Fruruo, D. J., McDonald, R. A., & Syverud, A. N. 1985, Phys. Chem. Ref. Data 14, Part 1 Suppl. 1, 1
- Contursi et al. (2001) Contursi, A., Boselli, A., Gavazzi, G., Bertagna, E., Tuffs, R., & Lequeux, J. 2001, A&A, 365, 11
- Draine (2003) Draine, B. T. 2003, ARA&A, 41, 241
- Draine & Li (2001) Draine, B. T., & Li, A. 2001, ApJ, 551, 807
- Duley (1973) Duley, W. W. 1973, Ap&SS, 23, 43
- Dullemond & Dominik (2004) Dullemond, C. P., & Dominik, C. 2004, A&A, 417, 159
- Dullemond & Turolla (2000) Dullemond, C. P., & Turolla, R. 2000, A&A, 360, 1187
- Eisner et al. (2003) Eisner, J. A., Lane, B. F., Akeson, R. L., Hillenbrand, L. A., & Sargent, A. I. 2003, ApJ, 588, 360
- Eisner et al. (2004) Eisner, J. A., Lane, B. F., Hillenbrand, L. A., Akeson, R. L., & Sargent, A. I. 2004, ApJ, 613, 1049
- Evans et al. (2003) Evans, N. J., Allen, L. E., Blake, G. A., Boogert, A. C. A., Bourke, T., Harvey, P. M., Kessler, J. E., Koerner, D. W., Lee, C. W., Mundy, L. G., Myers, P. C., Padgett, D. L., Pontoppidan, K., Sargent, A. I., Stapelfeldt, K. R., van Dishoeck, E. F., Young, C. H., & Young, K. E. 2003, PASP, 115, 965
- Förster Schreiber et al. (2003) Förster Schreiber, N. M., Sauvage, M., Charmandaris, V., Laurent, O., Gallais, P., Mirabel, I. F., & Vigroux, L. 2003, A&A, 399, 833
- Fazio et al. (2004) Fazio, G. G., Hora, J. L., Allen, L. E., Ashby, M. L. N., Barmby, P., Deutsch, L. K., Huang, J.-S., Kleiner, S., Marengo, M., Megeath, S. T., Melnick, G. J., Pahre, M. A., Patten, B. M., Polizotti, J., Smith, H. A., Taylor, R. S., Wang, Z., Willner, S. P., Hoffmann, W. F., Pipher, J. L., Forrest, W. J., McMurty, C. W., McCreight, C. R., McKelvey, M. E., McMurray, R. E., Koch, D. G., Moseley, S. H., Arendt, R. G., Mentzell, J. E., Marx, C. T., Losch, P., Mayman, P., Eichhorn, W., Krebs, D., Jhabvala, M., Gezari, D. Y., Fixsen, D. J., Flores, J., Shakoorzadeh, K., Jungo, R., Hakun, C., Workman, L., Karpati, G., Kichak, R., Whitley, R., Mann, S., Tollestrup, E. V., Eisenhardt, P., Stern, D., Gorjian, V., Bhattacharya, B., Carey, S., Nelson, B. O., Glaccum, W. J., Lacy, M., Lowrance, P. J., Laine, S., Reach, W. T., Stauffer, J. A., Surace, J. A., Wilson, G., Wright, E. L., Hoffman, A., Domingo, G., & Cohen, M. 2004, ApJS, 154, 10
- Guhathakurta & Draine (1989) Guhathakurta, P., & Draine, B. T. 1989, ApJ, 345, 230
- Harvey et al. (2006) Harvey, P. M., Chapman, N., Lai, S.-P., Evans, II, N. J., Allen, L. E., Jørgensen, J. K., Mundy, L. G., Huard, T. L., Porras, A., Cieza, L., Myers, P. C., Merín, B., van Dishoeck, E. F., Young, K. E., Spiesman, W., Blake, G. A., Koerner, D. W., Padgett, D. L., Sargent, A. I., & Stapelfeldt, K. R. 2006, ApJ, 644, 307
- Henning et al. (1998) Henning, T., Klein, R., Launhardt, R., Lemke, D., & Pfau, W. 1998, A&A, 332, 1035
- Hodapp et al. (2004) Hodapp, K. W., Walker, C. H., Reipurth, B., Wood, K., Bally, J., Whitney, B. A., & Connelley, M. 2004, ApJ, 601, L79
- Holweger (2001) Holweger, H. 2001, in AIP Conf. Proc. 598: Joint SOHO/ACE workshop ”Solar and Galactic Composition”, 23–+
- Houck et al. (2004) Houck, J. R., Roellig, T. L., van Cleve, J., Forrest, W. J., Herter, T., Lawrence, C. R., Matthews, K., Reitsema, H. J., Soifer, B. T., Watson, D. M., Weedman, D., Huisjen, M., Troeltzsch, J., Barry, D. J., Bernard-Salas, J., Blacken, C. E., Brandl, B. R., Charmandaris, V., Devost, D., Gull, G. E., Hall, P., Henderson, C. P., Higdon, S. J. U., Pirger, B. E., Schoenwald, J., Sloan, G. C., Uchida, K. I., Appleton, P. N., Armus, L., Burgdorf, M. J., Fajardo-Acosta, S. B., Grillmair, C. J., Ingalls, J. G., Morris, P. W., & Teplitz, H. I. 2004, ApJS, 154, 18
- Kaas (1999) Kaas, A. A. 1999, AJ, 118, 558
- Leger & Puget (1984) Leger, A., & Puget, J. L. 1984, A&A, 137, L5
- Li & Draine (2001) Li, A., & Draine, B. T. 2001, ApJ, 554, 778
- Lucy (1999) Lucy, L. B. 1999, A&A, 344, 282
- Mattioda et al. (2005) Mattioda, A. L., Hudgins, D. M., & Allamandola, L. J. 2005, ApJ, 629, 1188
- Pontoppidan & Dullemond (2005) Pontoppidan, K. M., & Dullemond, C. P. 2005, A&A, 435, 595
- Pontoppidan et al. (2006) Pontoppidan, K. M., Dullemond, C. P., & et al. 2006, ApJ
- Pontoppidan et al. (2005) Pontoppidan, K. M., Dullemond, C. P., van Dishoeck, E. F., Blake, G. A., Boogert, A. C. A., Evans II, N. J., Kessler-Silacci, J. E., & Lahuis, F. 2005, ApJ, 622, 463
- Rieke et al. (2004) Rieke, G. H., Young, E. T., Engelbracht, C. W., Kelly, D. M., Low, F. J., Haller, E. E., Beeman, J. W., Gordon, K. D., Stansberry, J. A., Misselt, K. A., Cadien, J., Morrison, J. E., Rivlis, G., Latter, W. B., Noriega-Crespo, A., Padgett, D. L., Stapelfeldt, K. R., Hines, D. C., Egami, E., Muzerolle, J., Alonso-Herrero, A., Blaylock, M., Dole, H., Hinz, J. L., Le Floc’h, E., Papovich, C., Pérez-González, P. G., Smith, P. S., Su, K. Y. L., Bennett, L., Frayer, D. T., Henderson, D., Lu, N., Masci, F., Pesenson, M., Rebull, L., Rho, J., Keene, J., Stolovy, S., Wachter, S., Wheaton, W., Werner, M. W., & Richards, P. L. 2004, ApJS, 154, 25
- Rouan et al. (2004) Rouan, D., Lacombe, F., Gendron, E., Gratadour, D., Clénet, Y., Lagrange, A.-M., Mouillet, D., Boisson, C., Rousset, G., Fusco, T., Mugnier, L., Séchaud, M., Thatte, N., Genzel, R., Gigan, P., Arsenault, R., & Kern, P. 2004, A&A, 417, L1
- Sellgren (1984) Sellgren, K. 1984, ApJ, 277, 623
- Semenov et al. (2005) Semenov, D., Pavlyuchenkov, Y., Schreyer, K., Henning, T., Dullemond, C., & Bacmann, A. 2005, ApJ, 621, 853
- Shu et al. (1994) Shu, F., Najita, J., Ostriker, E., Wilkin, F., Ruden, S., & Lizano, S. 1994, ApJ, 429, 781
- Siebenmorgen & Kruegel (1992) Siebenmorgen, R., & Kruegel, E. 1992, A&A, 259, 614
- Tielens et al. (1999) Tielens, A. G. G. M., Hony, S., van Kerckhoven, C., & Peeters, E. 1999, in ESA SP-427: The Universe as Seen by ISO, 579–+
- Vuong et al. (2003) Vuong, M. H., Montmerle, T., Grosso, N., Feigelson, E. D., Verstraete, L., & Ozawa, H. 2003, A&A, 408, 581
- Weingartner & Draine (2001) Weingartner, J. C., & Draine, B. T. 2001, ApJ, 548, 296
- Werner et al. (2004) Werner, M. W., Roellig, T. L., Low, F. J., Rieke, G. H., Rieke, M., Hoffmann, W. F., Young, E., Houck, J. R., Brandl, B., Fazio, G. G., Hora, J. L., Gehrz, R. D., Helou, G., Soifer, B. T., Stauffer, J., Keene, J., Eisenhardt, P., Gallagher, D., Gautier, T. N., Irace, W., Lawrence, C. R., Simmons, L., Van Cleve, J. E., Jura, M., Wright, E. L., & Cruikshank, D. P. 2004, ApJS, 154, 1