The Metallicity Distribution of Intracluster Stars in Virgo
Abstract
We have used the Hubble Space Telescope’s Advanced Camera for Surveys (ACS) to detect and measure stars in a single intracluster field in the Virgo Cluster. By performing F606W and F814W photometry on these stars, we have determined their metallicity distribution function, and constrained the types of stars present in this portion of Virgo’s intracluster space. Based on the small number of stars detected brighter than the red giant branch (RGB) tip, we suggest that in this region, Virgo’s intracluster stars are mostly old (10 Gyr). Through analysis of the RGB stars themselves, we determine that the population contains the full range of metallicities probed ( [M/H] ). We also present evidence that the younger (10 Gyr) component of the population is more metal-rich, with [M/H] . The spatial distribution of the most metal-poor stars in the field shows significantly more structure than that of the metal-rich stars, indicating that the intracluster population is not well-mixed. We discuss the implications these observations have for the production of intracluster stars and the dynamical evolution of the Virgo Cluster.
1 Introduction
Galaxy interactions and mergers are fundamental to the process of galaxy evolution. During these encounters, tidal forces often eject stars from their parent galaxies into intergalactic space; these orphaned stars then provide a fossil record of the interaction. By studying the chemistry and age distribution of these castaway objects, we can constrain models for the galaxies’ formation and evolution (e.g., Napolitano et al., 2003; Murante et al., 2004; Willman et al., 2004; Sommer-Larsen et al., 2005). For example, the metallicities of the ejected stars give us clues about the kind of galaxies from which they originate. Likewise, the number and spatial distribution of the stars lend insight about the types of interactions involved and their frequency, and the kinematics and phase-space structure of the stars provide details about the history of a group or cluster. As a result, studies of orphaned red giants, planetary nebulae, and globular clusters can directly constrain the interaction history of a system of galaxies.
The intracluster medium is particularly suitable for the measurement of intergalactic stars. Galaxies in dense regions of space are known to have redder colors and possess less gas than their field counterparts (e.g., Dressler, 1980). Similarly, cluster galaxies appear to have evolved more rapidly than field galaxies, as exhibited by their observed color shift to the red over the past few billion years (Butcher & Oemler, 1978). There are many possible explanations for these differences, including gravitational interactions and mergers among cluster galaxies (e.g., Toomre & Toomre, 1972; Richstone, 1976; Moore et al., 1996; Dubinski, 1998; Rudick et al., 2006), gravitational interactions with the cluster potential (e.g., Byrd & Valtonen, 1990; Moore et al., 1998; Gnedin, 2003), and the loss of gas via interactions with the intracluster medium (e.g., Gunn & Gott, 1972; Larson et al., 1980; Fujita & Nagashima, 1999; Bekki et al., 2002, and many others). Each of these processes can leave noticeable imprints on the population of stars that reside between the galaxy cluster members.
There have been several numerical simulations of the intracluster light phenomenon. Models by Murante et al. (2004), focusing on 117 clusters with masses ranging from to , suggest that between 10% and 50% of a system’s stars may be unattached to any galaxy, with the more massive clusters having the larger fraction of intracluster stars. Their findings also predict that the intracluster population should be older and more centrally condensed than the galactic stellar population. Alternatively, the simulations of Sommer-Larsen et al. (2005) of one Virgo-like cluster and one Coma-like cluster produce a range for the percentage of intracluster stars (20% to 40%) and yield higher mean stellar metallicities, which decrease from near solar at the cluster core, to half-solar at the virial radius. Still another set of higher-resolution models by Willman et al. (2004) predicts an intracluster star fraction of between 10% and 22% in a rich galaxy cluster, with most of the objects coming from the outer, metal-poor regions of galaxies. The Willman et al. (2004) models also suggest that massive galaxies are an important contributor to the intracluster stellar population, and that the mean metallicity of these orphaned stars is [M/H] .
Despite these theoretical advances, direct measurements of the intracluster population have been difficult. Although the existence of intracluster light has been known for some time (see Zwicky, 1951; Oemler, 1973; Mattila, 1977, for early studies), only recently has the importance of this component been quantified across different cluster environments (Ciardullo et al., 2004; Zibetti et al., 2005; Feldmeier et al., 2004; Aguerri et al., 2005; Gonzalez et al., 2005; Krick et al., 2006, and references therein). Moreover, little is known about the stellar populations that make up the intracluster light. Most analyses assume that the component is old, but the lone observational constraint on the population’s metallicity comes from HST -band photometry of stars at the tip of the red giant branch. By comparing the brightnesses of these stars to that of RGB tip stars in a metal-poor dwarf galaxy, Durrell et al. (2002) estimated the mean metallicity of the component to be . Unfortunately, since this estimate assumes that the dwarf galaxy and the intracluster stars are at exactly the same distance, it is subject to a large systematic error.
The best place to further our knowledge of intracluster light is in the Virgo cluster. At a distance of Mpc (Freedman et al., 2001), Virgo is the nearest system to have a significant intracluster population (Ciardullo et al., 2004), and it is thus the best studied system to date. There have been numerous surveys of the cluster’s intracluster planetary nebulae (Arnaboldi et al., 1996, 2002; Feldmeier et al., 2004) which have helped trace the distribution of the intracluster stars (Arnaboldi et al., 2003, 2004; Aguerri et al., 2005), and two small intracluster fields have been imaged with the WFPC2 instrument of the Hubble Space Telescope (Ferguson et al., 1998; Durrell et al., 2002). In addition, the large-scale structure of Virgo’s intracluster light has been mapped to a very low level via the ultra-deep surface photometry of Mihos et al. (2005).
Here, we present the results of a deep HST photometric survey of an intracluster field of the Virgo Cluster. We use the Advanced Camera for Surveys (ACS) to create an F606W-F814W color-magnitude diagram (CMD) of the intracluster stars and use the data to constrain the age and metallicity of the stellar population. In Section 2, we describe our survey and the analysis techniques required to measure the system’s metallicity distribution function. In Section 3, we discuss the results of our analysis, and their interpretation. We show that Virgo’s intracluster stars are mostly old ( Gyr), and metal-poor, with a metallicity distribution function that contains the full range of metallicities probed by the data. However, we also present evidence for the existence of a younger, more metal-rich component, which may represent the results of on-going tidal processes. Finally, in Section 4, we discuss how these results can be used to test models of cluster formation and evolution.
2 Data Acquisition and Reduction
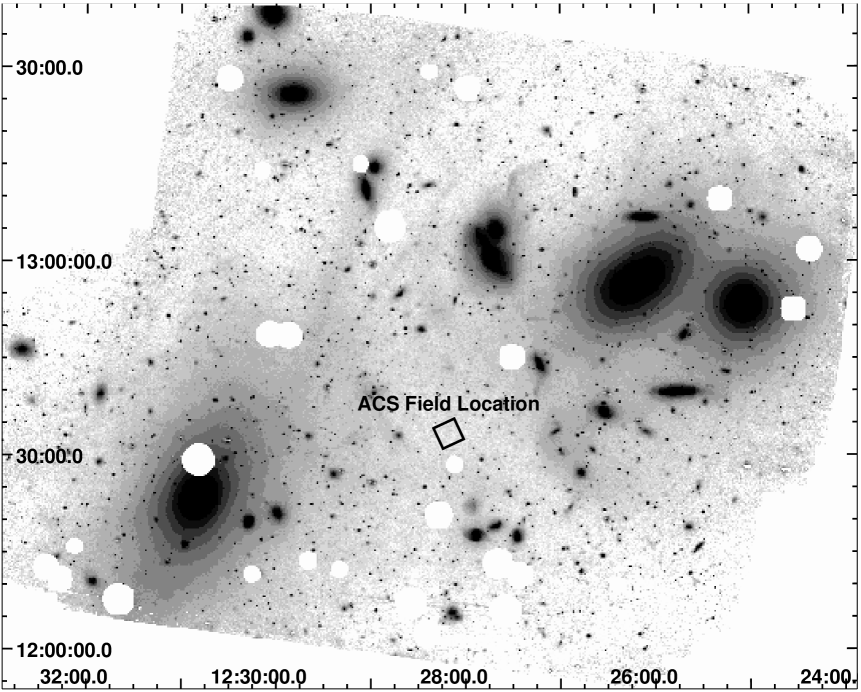
From 30 May 2005 to 7 June 2005, we obtained deep HST ACS images of a Virgo Cluster intracluster field as part of project GO 10131. Our single field, located at 12:28:10.80, 12:33:20.0 (with an orientation of 112.58 degrees), was chosen to avoid any known galaxy in the Virgo Cluster Catalog, filaments, arcs, or other low-surface brightness features of the system. Figure 1 shows the location of our field superposed on the ultra-low surface brightness image of Mihos et al. (2005). As illustrated in the figure, our field is (190 kpc) from M87, (170 kpc) from M86, and located on a patch of sky which has a mean -band surface brightness (including background galaxies) of (Mihos et al., 2005).
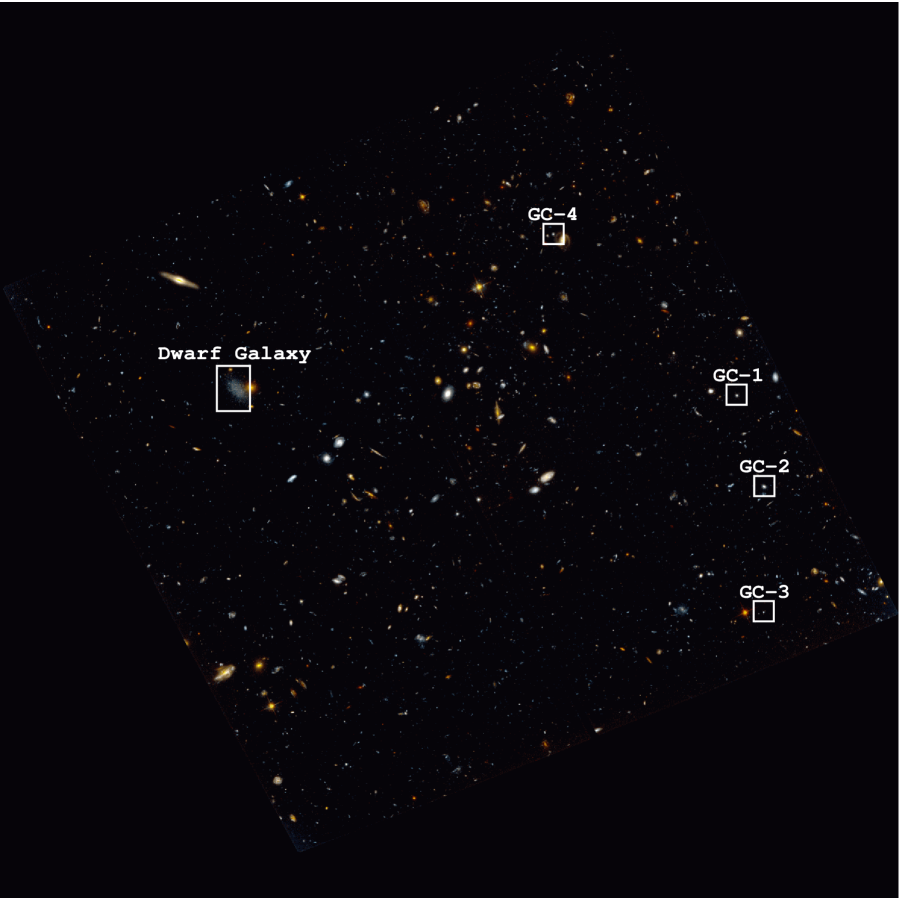
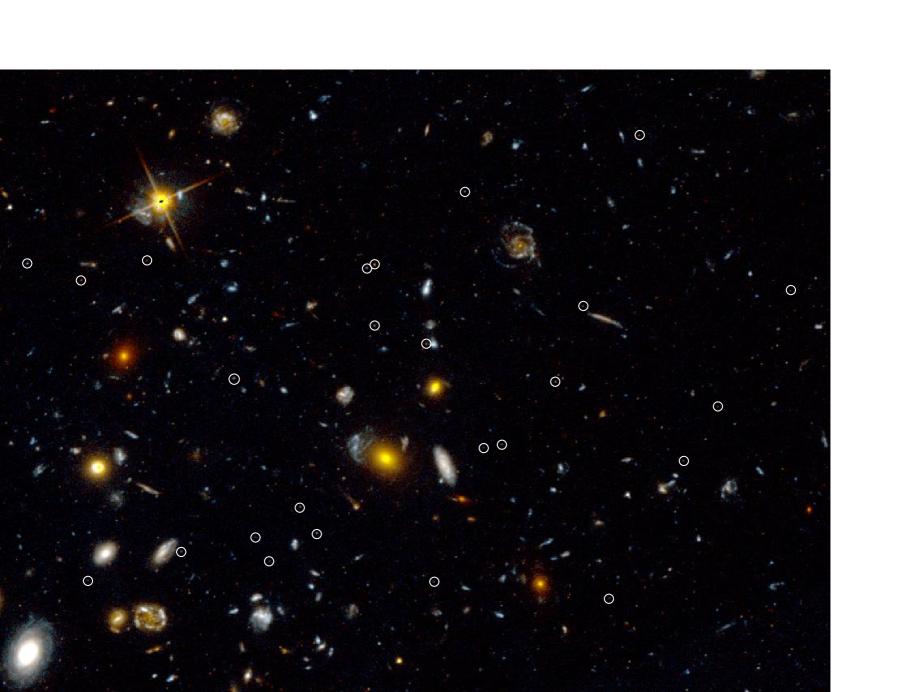
Observations were taken through two filters, the wide -band (F606W) and the standard (F814W). The F814W data were taken over a period of 11 orbits and consisted of 22 exposures totaling 26880 s of exposure time; the F606W frames were acquired over 26 orbits, and included 52 exposures with 63440 s of integration. These frames were combined using the PyRAF111PyRAF is a product of the Space Telescope Science Institute, which is operated by AURA for NASA. task multidrizzle,222multidrizzle is a product of the Space Telescope Science Institute, which is operated by AURA for NASA. http://stsdas.stsci.edu/pydrizzle/multidrizzle which removed cosmic ray events and geometric distortions from our series of dithered images. The result was two co-added photometric images (in units of counts per second), covering an exposed area of 11.39 arcmin2 with a sampling almost twice that of the physical ACS detector, or pixel-1. Unfortunately, the point spread functions (PSFs) of our co-added F606W and F814W images were not identical. Some of the F606W frames had image headers whose coordinate systems were mis-aligned by 1 pixel. We corrected for these misalignments using the positions of point sources in the field, but due to the small number of bright targets available for centroiding, the accuracy of this procedure was limited to . This caused a slight degradation in the F606W PSF compared to that of the F814W image. A color reproduction of our final image is shown in Figure 2; a portion of this image is shown in color in Figure 3. A handful of the sources that fit the image PSF and have magnitudes consistent with those of Virgo Cluster red giant stars are circled.
A cursory visual examination of our ACS images reveals several interesting objects. In the northeast region of our field is a previously undiscovered Virgo Cluster low-surface brightness dwarf spheroidal galaxy (Durrell et al., 2006). Also present in the frame are four candidate intracluster globular clusters (Williams et al., 2006). Finally, our field contains a large number of background galaxies, both resolved and unresolved. Though these galaxies may be the focus of a future study, here they are only a contaminant. Nevertheless, we need to understand this component if we are to extract the maximum amount of information from the intracluster stars.
2.1 Point Spread Function Photometry
We performed PSF photometry on all objects in our field using the DAOPHOT II and ALLSTAR packages (Stetson et al., 1990). We first used DAOFIND to create a list of sources by searching the image for peaks that were 3 above the mean in each band. The brightest of these sources were then examined by eye, in order to identify a set of objects which could be used to defined the image point spread function (49 such sources were found, allowing us to fit for a varying PSF across the field of view). Once this was done, ALLSTAR was used to fit this PSF to the remaining 3 peaks; this generated two lists of magnitudes and fitting statistics, one for each filter. These lists were then cross-correlated, to produce a catalog of sources present on both frames.
We next attempted to remove background galaxies from our source catalog by eliminating those objects with DAOPHOT fits to the PSF larger than 1.25, absolute roundness values greater than 1.0, or image centroids that differed by more than one pixel from one image to the other. (Such objects appear extended to the eye and are therefore unlikely to be stars.) These cuts removed roughly half of the original sources, leaving a sample of candidate stars. The instrumental magnitudes of these stars were then scaled to sized-apertures using photometry of isolated field stars, and extrapolated to infinite apertures and placed on the VEGAMAG system using the corrections and zero points of Sirianni et al. (2005).
We determined the photometric errors and completeness of this catalog via a series of artificial star experiments. We used the frames’ PSFs to add 500 stars to each quadrant of the F606W and F814W images, and repeated our measurement technique, including all the procedures for the removal of contaminants. The results were then compared with the input photometry to determine the completeness and accuracy of our measurements. The process was repeated 100 times to produce a total of 200,000 artificial stars with magnitudes between and .
2.2 Background Contamination and Aperture Photometry
2.2.1 SExtractor
In addition to the PSF photometry, we used the SExtractor software package version 2.3b2 (Bertin & Arnouts, 1996) to detect, measure, and most importantly, classify objects on our frames. As in our DAOPHOT analysis, we ran SExtractor independently on our F814W and F606W frames, using a detection threshold over a two-pixel (radius) region, and applied the Sirianni et al. (2005) calibrations to transform our instrumental magnitudes into the VEGAMAG system. This yielded a catalog of objects, with classified as stars and classified as galaxies. The same artificial stars were then run through the SExtractor routine to determine the photometric errors and completeness of this procedure.
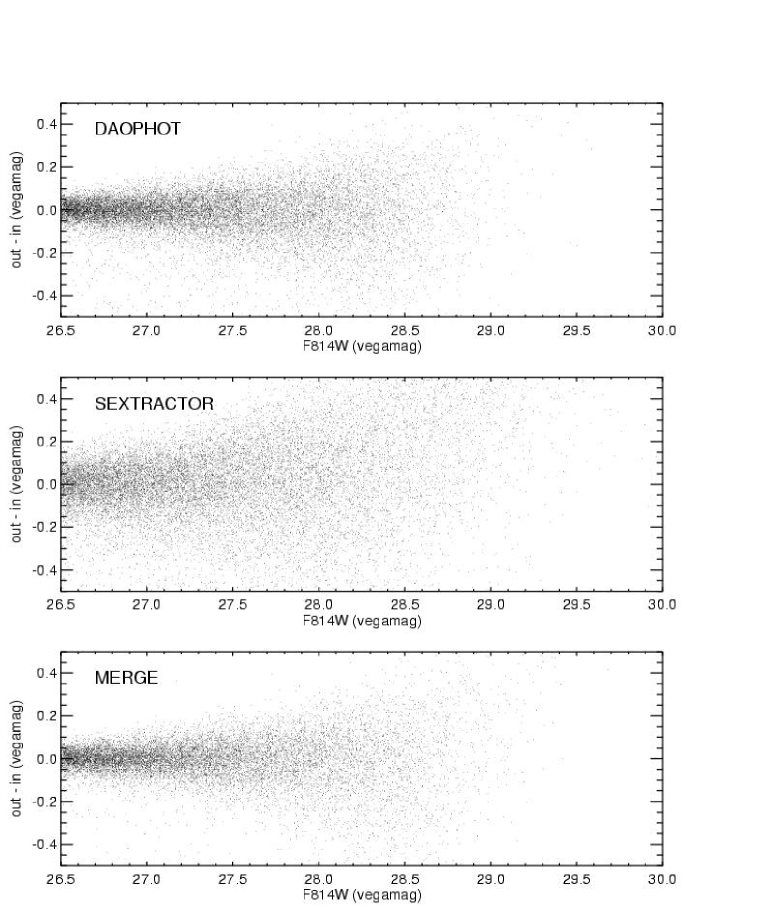
A comparison between our DAOPHOT and SExtractor measurements demonstrates that there is good agreement between the photometric packages for all but the faintest objects. Although SExtractor is able to measure magnitudes for more point sources at the frame limit than ALLSTAR, the photometric errors associated with SExtractor are always larger than those found by DAOPHOT and, more importantly, the SExtractor errors are systematic at the faintest magnitudes. This is demonstrated in Figure 4, which plots the results of artificial star experiments for both algorithms. At , the scatter in the SExtractor error is , compared to for DAOPHOT, and by , there is a significant departure from a mean of zero.
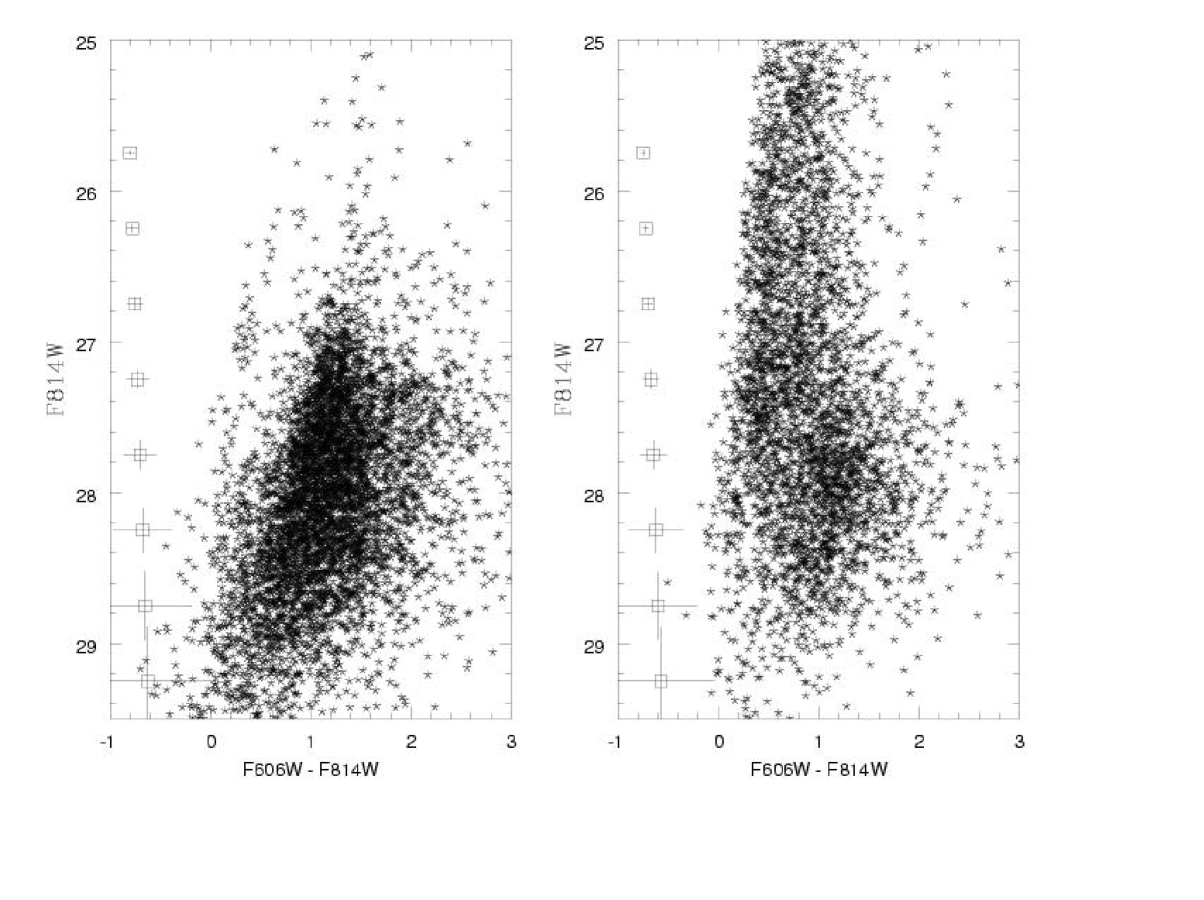
In contrast to its photometric limitations, SExtractor is much better than DAOPHOT at discriminating background galaxies from Virgo’s intracluster stars. This is demonstrated in Figures 5 and 6, which show DAOPHOT’s stellar CMD and SExtractor’s color-magnitude diagrams for stars and galaxies. From the figures, it is clear that the stellar sample defined by SExtractor contains far fewer blue contaminants than the DAOPHOT sample. Specifically, SExtractor’s point-source CMD shows only a handful of objects blueward of the red giant branch, none of which lie on any stellar sequence. Moreover, several of these blue objects appear slightly extended to the eye, suggesting that they are marginally resolved background galaxies. Conversely, SExtractor’s galaxy CMD shows no evidence of a red locus, but does show a significant population of objects in the blue part of the diagram. This strongly suggests that the blue objects present in DAOPHOT’s CMD are not stars.
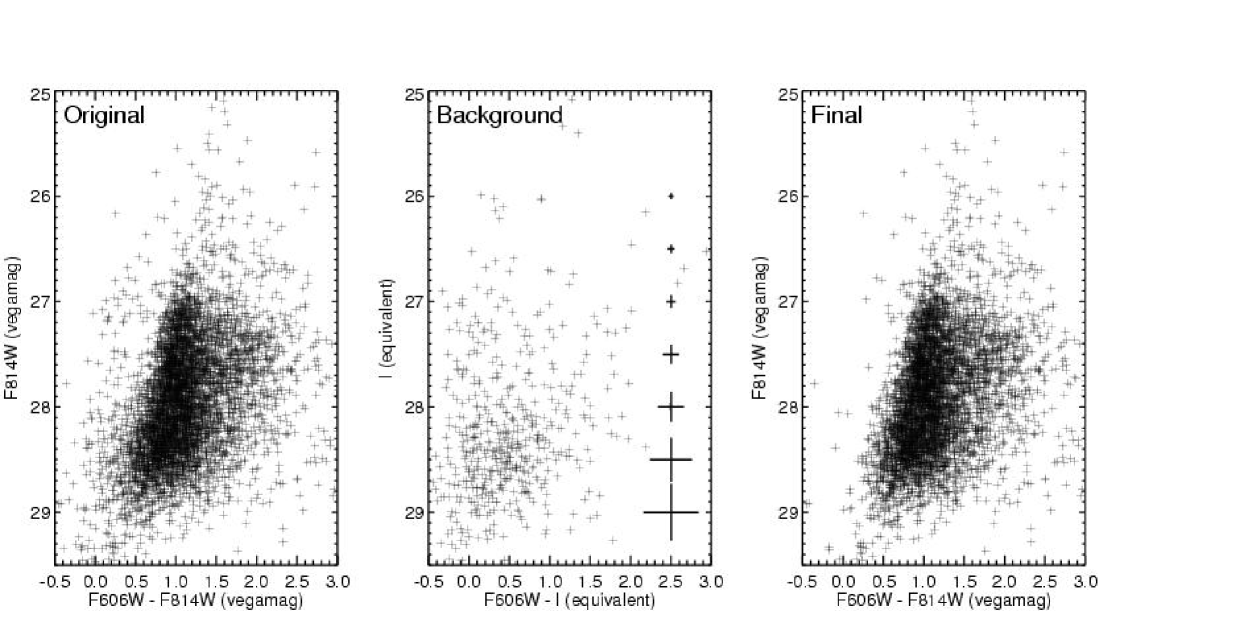
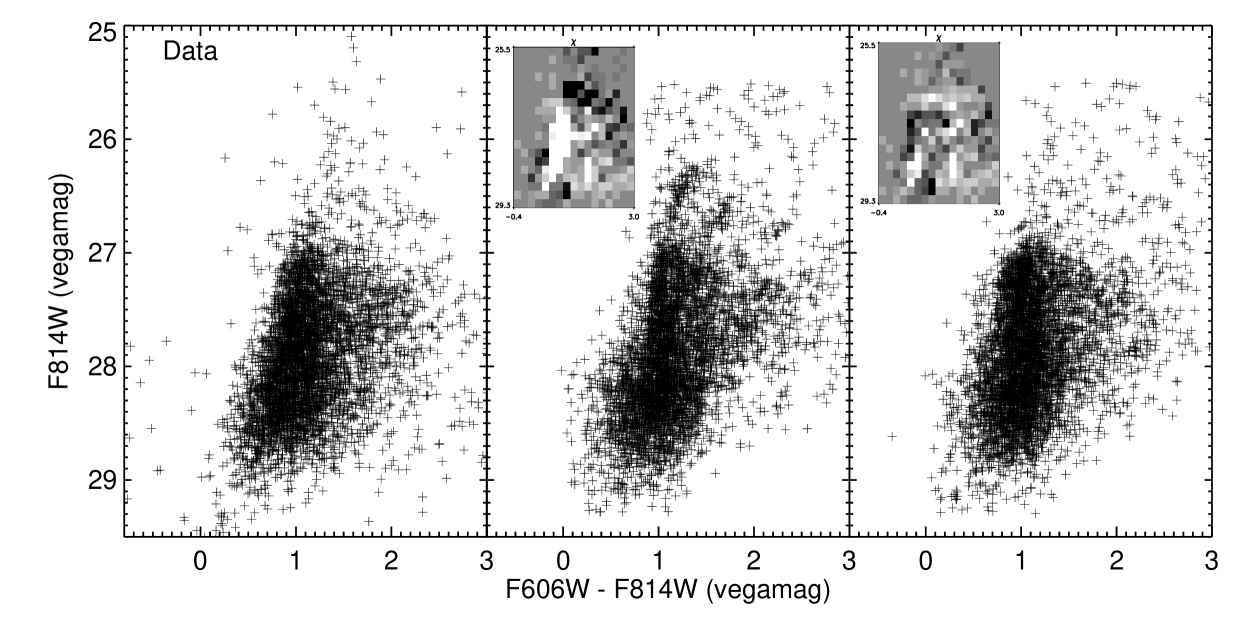
The results of the above experiment led us to use both SExtractor and DAOPHOT for our photometry. In general, we used the SExtractor classification algorithm to define our sample of intracluster stars, but then turned to DAOPHOT for the actual photometric measurements. The resulting CMD, which includes stars, is shown in the left panel of Figure 7. It contains the following objects:
1) Sources detected in both bands by both programs and classified as stars by SExtractor. These objects were assigned their DAOPHOT magnitudes.
2) Small sources (roundness ) detected in both bands by DAOPHOT, but not detected in both bands by SExtractor. These were also assigned their DAOPHOT magnitudes.
3) Sources detected in only one band by DAOPHOT, but found in both bands and classified as stars by SExtractor. These objects were assigned their DAOPHOT magnitude in one band, and their SExtractor magnitude in the other.
To determine our photometric error and completeness, an identical set of criteria were applied to our artificial star experiments. The results of these experiments are shown in Figure 4. The simulations show that our completeness fraction falls below 50% at and .
2.2.2 Control Field Imaging
As Figure 6 shows, even SExtractor mis-classifies some objects, especially near the frame limit (Bertin & Arnouts, 1996). Consequently, in order to further reduce our background contamination, we used the identical analysis techniques on a different high-Galactic latitude field with presumably no intracluster stars: the HST Ultra-Deep Field (UDF Beckwith et al., 2006). We began by defining subsets of UDF images which matched the depth and noise characteristics of our Virgo images. For the F606W filter, we collected a series of exposures which matched our 63,440 s image. To mimic our F814W dataset, we summed 43,200 s of UDF exposures through the F775W filter; this longer exposure time compensated for the filter’s 39% narrower bandpass.
We ran the UDF data through the same analysis routines (multidrizzle, DAOPHOT, SExtractor) as our Virgo data, and converted the UDF’s F775W Vega magnitudes to -band (F814W equivalent) magnitudes using the transformation coefficients of Sirianni et al. (2005). Only 530 sources in the UDF field passed our point source classification criteria. Since the UDF presumably contains no stars at the distance of the Virgo Cluster, this result implies that only of the point sources in our program field are contaminants. We do note that the UDF is at a lower Galactic latitude () than Virgo (), thus our statistical subtraction of point sources may contain an additional systematic error. However, simple Galactic models, such as that by Bahcall & Soneira (1980), predict that only of the unresolved sources in the UDF field belong to the Milky Way galaxy. Moreover, the lower Galactic latitude of the UDF is more than offset by its longitude, which is more towards the Galactic anti-center than our Virgo field (). Consequently, the Galactic contribution to the two fields should differ by no more than . Since there are only point sources in the UDF to begin with, this translates into a systematic uncertainty in the Virgo field source counts.
A CMD of the UDF’s “point sources” is shown in the middle panel of Figure 7. Clearly, this diagram shows no evidence of a red giant branch. Furthermore, the colors and magnitudes of the unresolved sources in the UDF field are similar to those of the non-stellar objects seen in Virgo (i.e., Figure 6). This agreement, which is consistent with the results of SExtractor, confirms that the blue objects in our intracluster star CMD are mostly marginally resolved or unresolved background galaxies. It also validates the use of the UDF data as a control for determining the amount of contaminants in our intracluster field.
To statistically remove these objects, we deleted from the Virgo point source catalog the closest match to each UDF point source in color-magnitude space. If no Virgo source was within a 0.15 mag radius circle of the UDF source, no source was removed. This radius was chosen to be similar to the photometric errors of faint sources and to the separation between points in color-magnitude space for bright objects. However, the exact radius has little impact on the results of the subtraction. If a 0.2 mag radius is adopted, only 12 more stars are removed from the diagram. If this restriction is removed entirely, then the background-subtracted CMD becomes somewhat less populated, though the metallicity and age distributions inferred for the population remain essentially unchanged (see below). As implemented, the procedure resulted in the exclusion of 470 (out of a possible 530) objects from the point source catalog, and reduced the expected amount of contamination in our intracluster field to . The 5,300 stars remaining in Virgo intracluster sample are shown in the right panel of Figure 7.
2.3 Measuring the Metallicity Distribution
A quick look at the final CMD of Figure 7 demonstrates that the width of Virgo’s red giant branch is significantly greater than the scatter due to photometric errors (given in Table 1). This demonstrates that the intracluster stars possess a range of metallicities (see arguments in, e.g., Zinn, 1980). Also obvious is the small number of stars brighter than the RGB tip, which is located at . This small quantity is strongly suggestive of a very old population, with Gyr. In addition, the CMD contains few, if any, objects with the colors of upper-main sequence or blue-loop stars ). This excludes the possible presence of a very young component ( Myr) in this region of intracluster space. Finally, the RGB tip appears sharp, suggesting that the stars in our field are not distributed over a very wide range in distance.
To quantify these conclusions, we analyzed the CMD of Figure 7 with the StarFISH minimization code of Harris & Zaritsky (2001). This software package treats an observed color-magnitude diagram as a superposition of eigenpopulations, each defined through the convolution of a theoretical isochrone with the photometric error and completeness function. The code then finds the linear combination of parameters which minimizes the difference between the observed Hess diagram and the synthetic diagram. The base isochrones chosen for analysis were those of Girardi et al. (2002), which have been updated to reproduce colors from the HST ACS filter set333http://pleiadi.pd.astro.it/isoc_photsys.02/isoc_photsys.02.html. This dataset includes models with ages of 8.5, 9.0, 9.35, 9.65, 9.9, and 10.1, and metallicities of and 0.019. Because our observations only extend mag down the red giant branch (with 50% completeness), our analysis was completely insensitive to the assumed slope of the initial mass function. (We adopted a Salpeter (1955) slope for this relation.) The photometric error and completeness estimates were taken directly from the results of our artificial star experiments, and the fits were performed using both 0.1 mag and 0.2 mag bins sizes to check for consistency. Finally, to refine our sensitivity to metallicity, we also included in our input grid an interpolated set of isochrones at . We experimented with using additional isochrone grids in the metallicity range between the and , but these did not significantly alter our results and added many more degrees of freedom to the model.
The only remaining parameters required for the model were the stars’ reddening and distance. For the foreground reddening, we adopted the COBE/DIRBE-based differential extinction of (Schlegel et al., 1998). This value is close to the Burstein & Heiles (1982) estimate of and, with a Cardelli et al. (1989) reddening law, translates into total extinctions of and (see Sirianni et al., 2005).
Unfortunately, obtaining a distance constraint is not so simple. Thanks in large part to the HST Key Project (Freedman et al., 2001), there is now general agreement about the distance to the main body of the Virgo Cluster, with Cepheids (Freedman et al., 2001), the surface brightness fluctuation method (Tonry et al., 2001, as recalibrated by Jensen et al. (2003)) and the planetary nebula luminosity function (Jacoby et al., 1990; Ciardullo et al., 1998) all producing distances between 14.5 and 15.8 Mpc. However, the situation with regard to our intracluster stars is more complex. The Virgo Cluster is highly elongated along our line-of-sight, extending from Mpc to Mpc (West & Blakeslee, 2000; Solanes et al., 2002), and the complex intracluster features seen by Mihos et al. (2005) likely span a range of distances. In addition, the intracluster stars plotted in Figure 7 are not necessarily associated with the core of Virgo. As illustrated in Figure 1, our field is located midway between Virgo’s central cD galaxy M87, and M86, a galaxy whose group is known to be falling into Virgo from behind (e.g., Jacoby et al., 1990; Binggeli et al., 1993; Bohringer et al., 1994). Thus, the intracluster stars we observe may be from either (or neither) of these systems.
Fortunately, the RGB is a distance indicator in itself: for old metal-poor populations, the absolute magnitude of the RGB brightest stars is independent of metallicity. Moreover, though the RGB tip does fade in metal-rich systems, the shape of the giant branch and its maximum magnitude are still predictable. (Da Costa & Armandroff, 1990; Lee et al., 1993). Consequently, we can use the StarFISH program to find the distance that best fits the RGB of our field. By doing so, we can reduce the effects of any distance-dependent systematic error, and derive our metallicities in a completely self-consistent manner.
To do this, we ran the StarFISH code using a series of assumed distances, each time binning the synthetic CMD into 0.1 mag 0.1 mag intervals, ignoring the asymptotic giant branch (AGB) contribution to the CMD for the oldest ages, and using its downhill simplex “amoeba” algorithm (Press et al., 1992) to minimize the difference between the model and the observations. The uncertainties in this model were then defined by starting from the best fit solution and varying each parameter in turn, until the overall increased by 5%. Therefore the errors do not take into account any problems that may exist in the RGB models themselves. The procedure yielded a best-fitting distance modulus of (16 Mpc). Our subsequent metallicity and age measurements for the stellar population depend little on this exact number.
As mentioned above, in performing our Hess diagram fits, we ignored the contribution of AGB stars in our oldest models. Our field contains very few stars brighter than the RGB, thus suggesting that the intracluster stars of Virgo are mostly very old ( Gyr). Yet even our oldest Girardi et al. (2002) models over-predict the number of stars in this part of the color-magnitude diagram. This is a general property of all our fits: regardless of age, metallicity, or initial mass function, the AGB population produced by the models is much greater than that seen in the data. Consequently, the presence of this component limited the quality of our fits to .
One possible explanation for the AGB anomaly lies in this isochrones’ treatment of mass-loss. As a population ages and its turn-off mass declines, the details of mass-loss become more and more important, and a slight increase in the mass-loss efficiency, , can lead to the premature termination of the AGB phase, or even its complete elimination (e.g., Greggio & Renzini, 1990). Moreover, the initial mass-final mass relation, which is used to calibrate the Girardi et al. (2002) AGB mass-loss law, is particularly ill-constrained at the low-mass limit (Herwig, 1995; Weidemann, 2000). Thus, it is not surprising that models have difficulty with this phase of stellar evolution. Indeed, an examination of the color-magnitude diagrams of some of the Galaxy’s oldest globular clusters confirms the rarity of bright AGB stars (e.g., see Buonanno et al., 1985; Durrell & Harris, 1993).
Because the AGB phase is difficult to model and likely to become less populated as the system’s age increases, we experimented with varying the importance of this stage of evolution. In one case, we removed the phase entirely from all of our input isochrones; in another, we eliminated the AGB in all isochrones older than 10 Gyr, but kept the stage in the younger models. These experiments, described in detail in § 3.2, provided valuable insight about the metallicity distribution of the stars in our field as well as the limitations of our data.
3 Results
3.1 Spatial Distribution
The Virgo Cluster is known to have a significant line-of-sight depth, which ranges from Mpc to Mpc (West & Blakeslee, 2000; Solanes et al., 2002). Yet, from the paucity of stars dectected above the nominal tip of our red giant branch, it is clear that the stars of our intracluster survey region are not nearly so spread out. This suggests that Virgo’s diffuse population is structured.
To quantify this statement, we can examine the luminosity function of likely RGB stars in Virgo’s intracluster space. This is done in Figure 8, where we compare the observed distribution of stars to that predicted by our best-fitting model. Both the model and the data display a sharp edge at F814W , which is indicative of the tip of the red giant branch. However, the discontinuity present in the data is much less pronounced than that in the model. This shallower break, along with the recovery at F814W indicates that at least some of our RGB stars are distributed along the line-of-sight.
The strength of the break in the Virgo luminosity function demonstrates that of the stars in our intracluster field are at a common distance of Mpc ( mag). The other of the population extends beyond the main clump by mag. Interestingly, this spread is consistent with the line-of-sight depth inferred from intracluster planetary nebula photometry, though the PN data are more sensitive to objects in the foreground, rather than background (Ciardullo et al., 1998; Arnaboldi et al., 2002; Feldmeier et al., 2004). The spread in distance is also consistent with conclusions of Arnaboldi et al. (2004), who used radial velocity measurements to show that Virgo’s intracluster planetaries are kinematically not well-mixed.
If the intracluster stars of Virgo are not well-mixed, then our ACS field may not be typical of the rest of Virgo, and the metallicity distribution that we determine may not be representative of that of the Virgo cluster as a whole. Recent cosmological simulations (Murante et al., 2006) predict that, though most intracluster stars have their origins in massive galaxies, a sizeable fraction of the population comes from the dissolved remains of lower-mass objects. These models also predict that the ratio of these two components will change with distance: the larger the distance from the cluster-dominant galaxy, the higher the fraction of disintegrated galaxies. If true, then the metallicity distribution function of the diffuse component should also change, and the values measured in our ACS field, which is kpc from M87, might be lower than the average for the cluster.
While large-scale variations in the intracluster light metallicity can only be checked by analyzing further judiciously spaced fields, we can use our current data to test for small-scale variations in the intracluster stellar population. To do this, we created two samples of intracluster stars from our final catalog, the first consisting of stars brighter than , and with (the color of the tip of the RGB for [M/H] ), and the other comprised of stars brighter and with (the color of the RGB tip for [M/H] ). This procedure produced two sets of 1600 stars; we then analyzed the spatial distribution of these stars by dividing our ACS field into a grid, (ignoring the region surrounding the resolved dwarf galaxy and the chip gap). This grid size provided enough resolution to detect spatial variations within our field while limiting the errors due to counting statistics to less than 20%.
Overall the distribution of intracluster stars in our field is fairly homogeneous. However, the bluest (most metal-poor) stars show significant inhomogeneities on the scale of about half the field size (). In particular, the dwarf galaxy described in Durrell et al. (2006) is part of a higher density region of metal-poor stars, which is possibly a stream that runs through the field. When compared to a random distribution, the observed distribution of metal-poor stars has a , which equates to a probability less than . For comparison, similar analyses for the metal-rich stars and the full sample yield () and (). The fact that the metal-poor stars show considerably more structure than the metal-rich objects presumably means that these objects either were liberated more recently or originated in a smaller object. A detailed discussion of the spatial distribution of these intracluster giants will be presented in a separate paper.
3.2 Age and Metallicity Distribution
3.2.1 Fitting the CMD
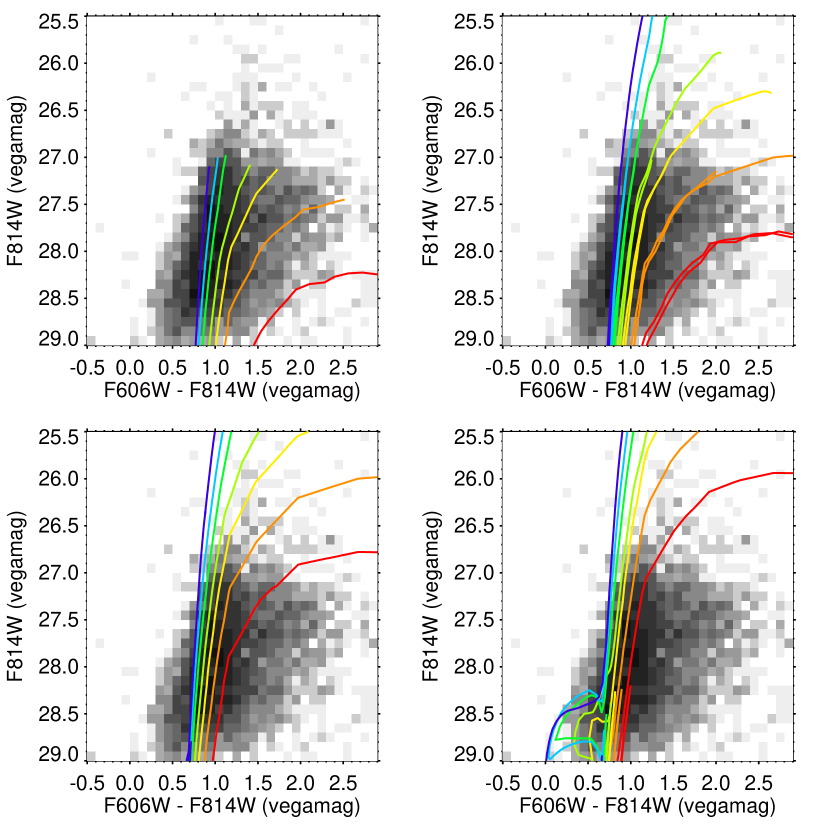
The results of the StarFISH analysis are shown in Figures 10–13. Figures 10 and 11 show the best-fitting metallicity and age distributions; Figure 12 compares our model CMDs with the actual data. Note that because our observations do not reach the red clump, the horizontal branch, or the main-sequence turn-off, our ability to determine the age distribution of Virgo’s intracluster stars is limited. Younger stars do populate the RGB somewhat differently than older objects — in general, they are slightly bluer for the same metallicity — but most of our leverage on age comes from the AGB. Unfortunately, as discussed above, models of AGB evolution are fraught with uncertainty, and any result which depends solely on the fit to this area of the color-magnitude diagram is not robust. Moreover, all models which use the Girardi et al. (2002) isochrones, regardless of age, metallicity, or initial-mass function, overpredict the number of Virgo AGB stars. Thus, to examine the effect of the AGB on our analysis, we created three different sets of models: one based on the raw isochrones with the AGB included, one in which the AGB component was excluded from the very oldest ( Gyr) models, and one in which no AGB stars were fit.
The quality of these fits varied considerably. When the AGB is included in the fits, ; when this component is removed (and the fit is restricted to stars with ), drops to = 1.9. The best results are obtained from the model which includes the AGB for all but the oldest stars; in this case . Figure 12 illustrates the reason for this improvement.
As Figure 12 illustrates, when we fit the observed CMD using the raw Girardi et al. (2002) isochrones, our best-fitting model underpredicts the number of metal-poor RGB stars (, F606WF814W), but overpredicts the number of old, metal-poor AGB stars (, F606WF814W). Clearly, metal-poor RGB stars are present, but the model cannot match the ratio of RGB stars to AGB stars, even for the oldest ages. When the AGB is removed from the oldest isochrones, the fit is much improved: StarFISH can increase the number of old, metal-poor ([M/H] ) stars to match the RGB, without overpopulating the AGB component. If the AGB is removed completely from the analysis and the fit is restricted to the RGB stars, then a full magnitude of CMD space is lost, as magnitudes brighter than are not included in the fit. The smaller number of degrees of freedom causes a slight increase in , but the fit still requires a metal-poor ([M/H] ) component of the population.
Finally, we note that, although we have not included it in our calculations, there is one additional constraint that can be applied to our analysis. According to the ultra-deep surface photometry of Mihos et al. (2005), the total -band surface brightness in our field is . About half of this is due to background galaxies: if we form a -band curve from the non-point sources in our field (using the transformations of Sirianni et al., 2005) and extrapolate the observed power law to , then the total surface brightness in galaxies is . This implies that the total stellar surface brightness in our field is .
We can compare this value to the results of the StarFISH code. Our fits produce models for the age and metallicity of Virgo’s intracluster RGB and AGB populations. If we use a Salpeter (1955) initial mass function to extrapolate the star counts down the main sequence (to ), then our fits also yield the total number of stars in our field and the stellar surface brightness. This value must come close to matching the results of the broadband surface photometry for the model to be plausible.
In fact, the best-fit solution without AGB stars far exceeds the observational constraint, producing a -band surface brightness of . The high surface brightness occurs with the addition of intermediate-aged, metal-poor stars, which require the presence of bright main sequence turnoff stars below our magnitude limit. If such bright main-sequence stars were present in our field, the total surface brightness would clearly be higher (even though we would not detect the stars in our data). On the other hand, if the metal-poor stars are old, the associated main sequence stars below our mangitude limit are fainter, keeping the total surface brightness within the observational constraint.
Because the presence of an intermediate-age, metal-poor population would apparently increase the total surface brightness of the intracluster medium to a level that is inconsistent with observations, the solution obtained from completely removing the AGB from the models, although instructive, is not viable. The other models both produce a value for the integrated light that is much closer to that observed, . Because of the uncertainties associated with AGB mass-loss (especially in old, metal-poor stars), and because the solution that omits the AGB for Gyr populations has a much better than the models which include the AGB, this model is our preferred solution.
3.2.2 Metallicity and Age
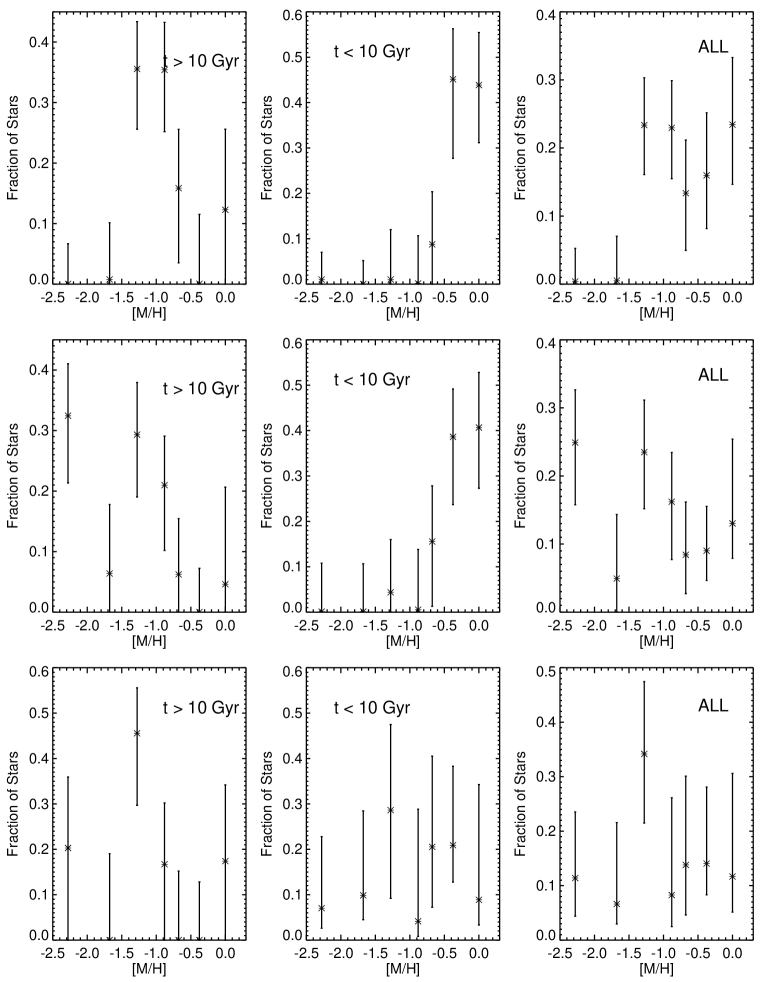
In contrast to the problem of age, our F606WF814W color-magnitude diagram is a good probe of population metallicity. As Figure 10 shows, the metallicity distribution function of Virgo’s intracluster stars is also affected by the exclusion of the AGB from the models, and the effects help to show the problem with including the AGB for all ages. After using our experiments to decipher the most likely age and metallicity distribution of the stars in our field, we can begin to compare the results with those of numerical simulations.
As Figure 11 illustrates, Virgo’s intracluster population is dominated by old, metal-poor stars. Our best-fitting model suggests that 70-80% of the stars have ages that are greater than Gyr; these stars have a median metallicity of [M/H] -1.3, a mean metallicity of [M/H] and range from . However, there is some evidence for the existence of a younger, metal-rich component. To reproduce the observed color- magnitude diagram, and not overpopulate the AGB, at least two age components are needed. Moreover, as Figure 10 demonstrates, the metallicity distribution function of the younger ( Gyr) component clearly peaks at a much higher value than that for the oldest stars. According to our best-fit model, the younger (more metal-rich) component makes up of the stars present in our HR diagram. Note, however, that when integrated over the entire mass function, the importance of this population is much less, i.e., only 20-30% of the population.
If StarFISH is forced to fit the AGB population using the raw Girardi et al. (2002) isochrones, then the fraction of metal-poor stars inferred for Virgo is significantly less, and there are almost no stars more metal-poor than [M/H] . However, the blue side of the RGB is not properly reproduced, demonstrating that this result is not reliable. In both cases where the AGB is at least parially excluded from the isochrones, the results show a very metal-poor component ([M/H]-2), which is clearly seen in the observed RGB. Our surface brightness tests further suggest that the metal-poor component is old (see § 3.2.1 for details).
Our observations are not directly sensitive to metal-rich stars. Because of the effects of line blanketing, old solar-metallicity stars at the tip of red giant branch are not brighter than (see Figure 9). Since this is more than magnitude below our detection limit, our analysis does not formally exclude the existence of such a population. However, two pieces of evidence argue against this possibility. The first comes from the number of unmatched point sources detected on the F814W image. In our Virgo intracluster field, there are 960 point-like sources brighter than present in F814W but invisible in F606W; in the UDF, the number of such objects is 12. Since a total of stars were detected in both F814W and F606W, this number suggests that the fraction of very metal-rich stars in our field is . This is consistent with the StarFISH results.
A second limit on the contribution of old, very metal-rich stars to the intracluster population comes from the observed background surface brightness. As discussed above, after the contribution of background galaxies is removed, the implied surface brightness of our best-fit model is an excellent match to the surface photometry results of Mihos et al. (2005). This agreement leaves little room for an extra component of metal-rich stars.
Evidence from ultra-deep surface photometry (Mihos et al., 2005), planetary nebula spectroscopy (Arnaboldi et al., 2004), and our star counts all suggest that Virgo’s intracluster component is not well-mixed. This opens up the possibility that our results are not representative of the Virgo Cluster as a whole. Nevertheless, we can draw some general conclusions from our observations. The most obvious is that Virgo’s intracluster stars do not come from a Population III source. Since the fraction of extremely metal-poor stars is low, the stars must have been predominantly formed inside of galaxies and subsequently removed.
Finally, the metallicity and age distributions derived by StarFISH are similar to that generally predicted by simulations (Murante et al., 2004; Willman et al., 2004; Sommer-Larsen et al., 2005). While the details of these models vary, most agree that the diffuse component should be old. The data displayed in Figure 11 support this result. However, the metallicities derived for our intracluster field are somewhat lower than that expected by theory. For example, Sommer-Larsen et al. (2005) predict a metallicity distribution function that peaks in the range [Fe/H] – , while Willman et al. (2004) infer metallicities that are similar to those of intermediate luminosity galaxies. If there is any discrepancy between the data and models, it lies in the fact that the observed metallicity distribution function appears to be dominated by values lower than this. However, because the high-metallicity component has a much larger effect on a system’s mean metallicity than its median metallicity, our mean [M/H] value is still consistent with [M/H] (see Figure 10, right panel). Our metallicity result is therefore most consistent with the simulations of Willman et al. (2004) and is somewhat discrepant with those of Sommer-Larsen et al. (2005).
4 Conclusions
We have used the ACS to obtain deep F606W and F814W images of red giant stars in the intracluster space of Virgo about half-way between M86 and M87. These images reach to , extend mag down Virgo’s red giant branch, and include intracluster stars. Careful evaluation and subtraction of the galaxy background using the UDF demonstrate that the RGB is much wider than can be explained by our photometric errors.
Fits of these data to theoretical stellar evolution models and comparisons to ultra-deep surface photometry suggest that Virgo’s intracluster population in this field is dominated by low-metallicity stars ([M/H]-1) with ages 10 Gyr. However, the field appears to contain stars of the full range of metallicities probed (-2.3[M/H]0.0). Our measurements show that there is a significant number of very metal poor ([M/H]) stars present in the field. Our data also provide an estimate for the amount of solar metallicity stars; although our F606W observations do not reach the tip of the very metal-rich RGB, star counts and ultra-deep surface photometry both constrain this population to be . Stars with [M/H] appear to be younger than the rest of the population, but, interestingly, it is the metal-poor stars that exhibit more spatial structure. Overall, the data suggest that Virgo’s intracluster stars are not well-mixed, and have multiple origins.
The dominant low-metallicity component is a surprise, and the result could be used to argue that dwarf galaxies are an important source of intracluster stars. However, because stars are expected to be removed from the outer, metal-poor regions of galaxies during tidal interactions, larger galaxies might also contribute to the intracluster population. For example, studies of the scale-lengths of the disks of spiral galaxies in Coma show that they are smaller than those of similar galaxies in the field, suggesting that some stars from the outer parts of the disks are disrupted by harassment (Aguerri et al., 2004; Gutiérrez et al., 2004). In any case, the wide range of metallicities seen in our data allows for contributions from many galaxy types.
Our measurement of the metallicity distribution of Virgo’s intracluster stars provides a new constraint for models of the formation and evolution of galaxy clusters. Previously this diffuse component was constrained only by star counts and a very few radial velocity measurements. Along with the data provided by the four intracluster globular clusters present in our field (Williams et al., 2006), our results should facilitate the development of the next generation of models for the dynamical evolution of galaxies in clusters.
Support for this work was provided by NASA through grant number NAG5-9377 and through grant GO-10131 from the Space Telescope Science Institute . We would like to thank Tom Brown for his assistance with the preparations of the observations.
References
- Aguerri et al. (2004) Aguerri, J. A. L., Iglesias-Paramo, J., Vilchez, J. M., & Muñoz-Tuñón, C. 2004, AJ, 127, 1344
- Aguerri et al. (2005) Aguerri, J. A. L., Gerhard, O. E., Arnaboldi, M., Napolitano, N. R., Castro-Rodriguez, N., & Freeman, K. C. 2005, AJ, 129, 2585
- Arnaboldi et al. (2002) Arnaboldi, M., et al. 2002, AJ, 123, 760
- Arnaboldi et al. (1996) Arnaboldi, M., et al. 1996, ApJ, 472, 145
- Arnaboldi et al. (2003) Arnaboldi, M., et al. 2003, AJ, 125, 514
- Arnaboldi et al. (2004) Arnaboldi, M., Gerhard, O., Aguerri, J. A. L., Freeman, K. C., Napolitano, N. R., Okamura, S., & Yasuda, N. 2004, ApJ, 614, L33
- Bahcall & Soneira (1980) Bahcall, J. N., & Soneira, R. M. 1980, ApJS, 44, 73
- Beckwith et al. (2006) Beckwith, S.V.F., et al. 2006, AJ, in press
- Bekki et al. (2002) Bekki, K., Couch, W. J., & Shioya, Y. 2002, ApJ, 577, 651
- Bertin & Arnouts (1996) Bertin, E., & Arnouts, S. 1996, A&AS, 117, 393
- Binggeli et al. (1993) Binggeli, B., Popescu, C. C., & Tammann, G. A. 1993, A&AS, 98, 275
- Bohringer et al. (1994) Bohringer, H., Briel, U. G., Schwarz, R. A., Voges, W., Hartner, G., & Trumper, J. 1994, Nature, 368, 828
- Buonanno et al. (1985) Buonanno, R., Corsi, C. E., & Fusi Pecci, F. 1985, A&A, 145, 97
- Burstein & Heiles (1982) Burstein, D., & Heiles, C. 1982, AJ, 87, 1165
- Butcher & Oemler (1978) Butcher, H., & Oemler, A. 1978, ApJ, 226, 559
- Byrd & Valtonen (1990) Byrd, G., & Valtonen, M. 1990, ApJ, 350, 89
- Cardelli et al. (1989) Cardelli, J. A., Clayton, G. C., & Mathis, J. S. 1989, ApJ, 345, 245
- Ciardullo et al. (1998) Ciardullo, R., Jacoby, G. H., Feldmeier, J. J., & Bartlett, R. E. 1998, ApJ, 492, 62
- Ciardullo et al. (2004) Ciardullo, R., Mihos, J. C., Feldmeier, J. J., Durrell, P. R., & Sigurdsson, S. 2004, in IAU Symposium, ed. P.-A. Duc, J. Braine, & E. Brinks (San Francisco: ASP), 88
- Da Costa & Armandroff (1990) Da Costa, G. S., & Armandroff, T. E. 1990, AJ, 100, 162
- Dressler (1980) Dressler, A. 1980, ApJ, 236, 351
- Dubinski (1998) Dubinski, J. 1998, ApJ, 502, 141
- Durrell et al. (2002) Durrell, P. R., Ciardullo, R., Feldmeier, J. J., Jacoby, G. H., & Sigurdsson, S. 2002, ApJ, 570, 119
- Durrell & Harris (1993) Durrell, P. R., & Harris, W. E. 1993, AJ, 105, 1420
- Durrell et al. (2006) Durrell, P. R., et al. 2006, submitted to ApJ
- Feldmeier et al. (2004) Feldmeier, J. J., Mihos, J. C., Morrison, H. L., Harding, P., Kaib, N., & Dubinski, J. 2004, ApJ, 609, 617
- Feldmeier et al. (2004) Feldmeier, J. J., Ciardullo, R., Jacoby, G. H., & Durrell, P. R. 2004, ApJ, 615, 196
- Ferguson et al. (1998) Ferguson, H. C., Tanvir, N. R., & von Hippel, T. 1998, Nature, 391, 461
- Freedman et al. (2001) Freedman, W. L., et al. 2001, ApJ, 553, 47
- Fujita & Nagashima (1999) Fujita, Y., & Nagashima, M. 1999, ApJ, 516, 619
- Girardi et al. (2002) Girardi, L., Bertelli, G., Bressan, A., Chiosi, C., Groenewegen, M. A. T., Marigo, P., Salasnich, B., & Weiss, A. 2002, A&A, 391, 195
- Gnedin (2003) Gnedin, O. Y. 2003, ApJ, 582, 141
- Gonzalez et al. (2005) Gonzalez, A. H., Zabludoff, A. I., & Zaritsky, D. 2005, ApJ, 618, 195
- Greggio & Renzini (1990) Greggio, L., & Renzini, A. 1990, ApJ, 364, 35
- Gunn & Gott (1972) Gunn, J. E., & Gott, J. R. I. 1972, ApJ, 176, 1
- Gutiérrez et al. (2004) Gutiérrez, C. M., Trujillo, I., Aguerri, J. A. L., Graham, A. W., & Caon, N. 2004, ApJ, 602, 664
- Harris & Zaritsky (2001) Harris, J., & Zaritsky, D. 2001, ApJS, 136, 25
- Herwig (1995) Herwig, F. 1995, in Liege International Astrophysical Colloquia, ed. A. Noels, D. Fraipont-Caro, M. Gabriel, N. Grevesse, & P. Demarque (Liege: Universite de Liege Institut d’Astrophysique), 441
- Jacoby et al. (1990) Jacoby, G. H., Ciardullo, R., & Ford, H. C. 1990, ApJ, 356, 332
- Jensen et al. (2003) Jensen, J. B., Tonry, J. L., Barris, B. J., Thompson, R. I., Liu, M. C., Rieke, M. J., Ajhar, E. A., & Blakeslee, J. P. 2003, ApJ, 583, 712
- Krick et al. (2006) Krick, J. E., Bernstein, R. A., & Pimbblet, K. A. 2006, AJ, 131, 168
- Larson et al. (1980) Larson, R. B., Tinsley, B. M., & Caldwell, C. N. 1980, ApJ, 237, 692
- Lee et al. (1993) Lee, M. G., Freedman, W. L., & Madore, B. F. 1993, ApJ, 417, 553
- Mattila (1977) Mattila, K. 1977, A&A, 60, 425
- Mihos et al. (2005) Mihos, J. C., Harding, P., Feldmeier, J., & Morrison, H. 2005, ApJ, 631, L41
- Moore et al. (1996) Moore, B., Katz, N., Lake, G., Dressler, A., & Oemler, A. 1996, Nature, 379, 613
- Moore et al. (1998) Moore, B., Lake, G., & Katz, N. 1998, ApJ, 495, 139
- Murante et al. (2006) Murante, G., Giovalli, M., Gerhard, O., Arnaboldi, M., Borgani, S., & Dolag, K. 2006, MNRAS, submitted
- Murante et al. (2004) Murante, G., et al. 2004, ApJ, 607, L83
- Napolitano et al. (2003) Napolitano, N. R., et al. 2003, ApJ, 594, 172
- Oemler (1973) Oemler, A. 1973, ApJ, 180, 11
- Press et al. (1992) Press, W. H., Teukolsky, S. A., Vetterling, W. T., & Flannery, B. P. 1992, Numerical recipes in FORTRAN, 2nd. Edition. The art of scientific computing (Cambridge: University Press)
- Richstone (1976) Richstone, D. O. 1976, ApJ, 204, 642
- Rudick et al. (2006) Rudick, C. S., Mihos, J. C., & McBride, C. 2006, ArXiv Astrophysics e-prints
- Salpeter (1955) Salpeter, E. E. 1955, ApJ, 121, 161
- Schlegel et al. (1998) Schlegel, D. J., Finkbeiner, D. P., & Davis, M. 1998, ApJ, 500, 525
- Sirianni et al. (2005) Sirianni, M., et al. 2005, PASP, 117, 1049
- Solanes et al. (2002) Solanes, J. M., Sanchis, T., Salvador-Solé, E., Giovanelli, R., & Haynes, M. P. 2002, AJ, 124, 2440
- Sommer-Larsen et al. (2005) Sommer-Larsen, J., Romeo, A. D., & Portinari, L. 2005, MNRAS, 357, 478
- Stetson et al. (1990) Stetson, P. B., Davis, L. E., & Crabtree, D. R. 1990, in ASP Conf. Ser. 8: CCDs in Astronomy (San Francisco: ASP), 289
- Tonry et al. (2001) Tonry, J. L., Dressler, A., Blakeslee, J. P., Ajhar, E. A., Fletcher, A. B., Luppino, G. A., Metzger, M. R., & Moore, C. B. 2001, ApJ, 546, 681
- Toomre & Toomre (1972) Toomre, A., & Toomre, J. 1972, ApJ, 178, 623
- Weidemann (2000) Weidemann, V. 2000, A&A, 363, 647
- West & Blakeslee (2000) West, M. J., & Blakeslee, J. P. 2000, ApJ, 543, L27
- Williams et al. (2006) Williams, B. F., et al. 2006, submitted to ApJ
- Willman et al. (2004) Willman, B., Governato, F., Wadsley, J., & Quinn, T. 2004, MNRAS, 355, 159
- Zibetti et al. (2005) Zibetti, S., White, S. D. M., Schneider, D. P., & Brinkmann, J. 2005, MNRAS, 358, 949
- Zinn (1980) Zinn, R. 1980, AJ, 85, 1468
- Zwicky (1951) Zwicky, F. 1951, PASP, 63, 61
| (Vegamag) | rms error (mag) | F606W - F814W rms error (mag) |
|---|---|---|
| 26.0 | 0.03 | 0.03 |
| 26.5 | 0.04 | 0.04 |
| 27 | 0.06 | 0.06 |
| 27.5 | 0.09 | 0.10 |
| 28 | 0.14 | 0.16 |
| 28.5 | 0.21 | 0.26 |
| 29.0 | 0.27 | 0.34 |