Modeling Spitzer observations of VV Ser. I. The circumstellar disk of a UX Orionis star
Abstract
We present mid-infrared Spitzer-IRS spectra of the well-known UX Orionis star VV Ser. We combine the Spitzer data with interferometric and spectroscopic data from the literature covering UV to submillimeter wavelengths. The full set of data are modeled by a two-dimensional axisymmetric Monte Carlo radiative transfer code. The model is used to test the prediction of Dullemond et al. (2003) that disks around UX Orionis stars must have a self-shadowed shape, and that these disks are seen nearly edge-on, looking just over the edge of a puffed-up inner rim, formed roughly at the dust sublimation radius. We find that a single, relatively simple model is consistent with all the available observational constraints spanning 4 orders of magnitude in wavelength and spatial scales, providing strong support for this interpretation of UX Orionis stars. The mid-infrared flux as measured by Spitzer-IRS is declining and exhibits weak silicate emission features, consistent with a self-shadowed geometry. MIPS and SCUBA imaging shows that the disk has a small grain dust mass as low as . The low apparent dust mass may be due to strong grain growth and settling. Further evidence for this is provided by the fact that the grains in the upper layers of the puffed-up inner rim must be small (0.01–0.4 m) to reproduce the colors () of the extinction events, while the shape and strength of the mid-infrared silicate emission features indicate that grains in the outer disk ( 1-2 AU) are somewhat larger (0.3–3.0 m). From the model fit, the location of the puffed-up inner rim is estimated to be at a dust temperature of 1500 K or at 0.7–0.8 AU for small grains. This is almost twice the rim radius estimated from near-infrared interferometry. Since larger (more grey) grains are able to penetrate closer to the star for the same dust sublimation temperature, a plausible interpretation of the data is that these larger grains have settled to the disk mid-plane in the puffed-up inner rim. A best fitting model for the inner rim in which large grains in the disk mid-plane reach to within 0.25 AU of the star, while small grains in the disk surface create a puffed-up inner rim at AU, is able to reproduce all the data, including the near-infrared visibilities.
Subject headings:
accretion, accretion disks – circumstellar matter – stars: formation, pre-main-sequence – infrared: stars1. Introduction
Edge-on and nearly edge-on disks around Herbig Ae and T Tauri stars are ideal objects for studying the structure and composition of protoplanetary disks. In addition to infrared emission from the disk, one has supplemental information from absorption of starlight along the line of sight through the surface layers or the interior of the disk. This probing technique has been used by various authors to analyze the dust size distribution in such disks (Wood et al., 2002; Duchêne et al., 2003; Wolf et al., 2003; Watson & Stapelfeldt, 2004) and to determine the abundance of icy grain in the outer regions of these disks (Thi et al., 2002; Pontoppidan et al., 2005).
Because of the additional constraints compared with other disks, it is clear that edge-on disks are ideal targets for detailed studies involving spectroscopy and images at many wavelengths. Given the many new sensitive observational facilities, including space-based mid-infrared imaging and spectroscopy as well as near-infrared interferometry, a powerful approach to analyzing these data is the simultaneous fitting with a multi-dimensional continuum radiative transfer model of the disk.
A particularly interesting sub-class of (presumably) nearly edge-on disks is “UX Orionis stars”. For these objects the stellar flux on average is only marginally extincted, but they undergo frequent, highly non-periodic extinction events, lasting a few days to weeks, in which the star dims strongly and becomes redder. A model in which dusty clumps in Keplerian orbits temporarily obscure the central star, as originally proposed by Grinin (1988), seems the best explanation for the observational constraints. In particular, in the bottom of very deep minima, the color track eventually turns around and the colors become bluer. In the context of the “dust clump” model, this characteristic “blueing” in deep minima signifies that the stellar photosphere has disappeared entirely from view and that scattered light from the disk surface begins to dominate in the optical wavebands.
While it has been suggested that these extinction events may be due to comets passing in front of the star (Grady et al., 1997), others have argued for a nearly edge-on disk scenario in which one narrowly looks over the surface of the disk toward the star, where small hydrodynamic perturbations temporarily pass through the line of sight (Bertout, 2000; Natta & Whitney, 2000). The short time scales for these extinction events indicate that the perturbations should happen close to the dust evaporation radius. It was argued by Natta et al. (2001) and Dullemond et al. (2003) that the puffed-up inner rim of the dusty part of the disk (see also Dullemond et al., 2001) is likely to be the location where these extinction events are produced. The inclination of the disk is such that the line of sight passes just over (or just through) the upper edge of the puffed-up inner rim, and hydrodynamic fluctuations can then vary the extinction of starlight along the line of sight on a time scale consistent with what is observed. Since the central star is typically not strongly attenuated outside a UX Orionis event, this scenario works only if the line of sight does not pass through many magnitudes of extinction in the outer regions of the disk. Hence, the outer parts of the disk cannot have a flaring geometry for these sources.
The conclusion reached by Dullemond et al. (2003) was that all UX Orionis stars should be self-shadowed disks, in which the outer disk is geometrically thin enough to lie entirely in the shadow cast by the puffed-up inner rim, and therefore does not intersect a line of sight passing just over the edge of this rim. A marginal flaring, in which the outer disk just barely appears above the inner-rim shadow, may be possible as well, as long as the resulting extinction along the line of sight is marginal. It was shown by these authors that the shape of the spectral energy distributions of all known UX Orionis objects indeed indicate that they are mostly non-flared (self-shadowed) disks, with some exceptions lying just on the border between flaring and self-shadowing disks. This gives strong support for the “inclined disk” scenario.
As part of the Spitzer Legacy program ‘From Molecular Cores to Protoplanetary Disks’ (c2d) (Evans et al., 2003), we obtained 5.2–37.0 m spectroscopy as well as IRAC and MIPS images of the well-known UX Orionis star VV Ser. The star was originally singled out for further study due to the presence of an extended (over ) mid-infrared nebulosity surrounding it. This nebulosity is analyzed in detail in a companion paper (Pontoppidan et al., 2006, hereafter Paper II), in which it is argued that the nebulosity is due to the quantum heating of Polycyclic Aromatic Hydrocarbons (PAHs) as well as very small silicate or carbon grains. Imprinted on the nebulosity is a wedge-like dark band which we interpret as a shadow cast by a small (less than a few 100 AU) nearly edge-on disk (see also Pontoppidan & Dullemond, 2005). The presence of a disk shadow allows a relatively accurate determination of the inclination and position angle of the system, which is crucial for the interpretation of VV Ser as a UX Orionis star.
In this paper we concentrate on analyzing VV Ser in terms of the UX Orionis phenomenon. To do this we create an axisymmetric radiative transfer model using a wide range of data to constrain the disk structure. This includes not only the Spitzer data, but also JCMT-SCUBA submillimeter imaging, near-infrared interferometric visibilities and optical light curves from the literature. Although some aspects of an axisymmetric model cannot be uniquely constrained, we can make firm conclusions about the disk geometry, grain sizes, inner rim structure, etc. More importantly, our analysis gives further strong evidence in favor of the scenario for UX Orionis stars put forward by Dullemond et al. (2003). In doing so, this lends support for the puffed-up inner rim model of Natta et al. (2001) and Dullemond et al. (2001), as well as for the interpretation of the near-IR to far-IR slope of the SED in terms of flaring versus self-shadowed disks (Dullemond & Dominik, 2004; Meeus et al., 2001). This scenario allows us to interpret all the observed data of VV Ser in terms of a single disk model with a simple geometrical interpretation.
We construct an axisymmetric radiative transfer model of the entire system from 0.5 to 50,000 AU scales. The main objectives are to test the scenario in which the UX Ori phenomenon is caused by a nearly edge-on disk, whether a disk shadow can plausibly be projected into the mid-infrared PAH nebulosity (see Paper II) and finally to use the model to constrain the structure and dynamics of the puffed-up inner rim.
This method necessarily targets specific objects for detailed modeling, and one should take care when generalizing from one specific object to a class of disks. One central point to this study is to determine observable predictions that can be applied to other UX Orionis stars, or even proto-planetary disks in general.
In this paper we first describe the observations that have been collected (Sect. 2) and the characteristics of the source (Sect. 3 ). In Sect. 4 the radiative transfer model is presented. Sect. 5 discusses how each observational constraint is implemented into the model as well as possible sources of degeneracies.
2. Observations
The primary constraints on the model of VV Ser are provided by mid-infrared spectroscopy and imaging obtained with the Spitzer Space Telescope (Werner et al., 2004). Mid-infrared spectra of VV Ser were obtained with the Spitzer Infrared Spectrometer, IRS (Houck et al., 2004) using the Short-Low (SL) module from 5.2–14.5 m, the Short-High module from 9.9–19.6 m and the Long-High module from 19–37 m. The spectra were reduced using the pipeline version S11.0.2 and extracted with the c2d extraction routines. The SL spectra were extracted in a 12 pixel aperture. The background was estimated using the entire length of the slit and subtracted using a high-order polynomial fit to the measured background in order to minimize any additional noise from the background subtraction. The SH and LH spectra were extracted using full aperture extractions. The short slits in the high resolution modules cause any background subtraction to be highly PSF-model dependent. Consequently, the background was not subtracted from the SH and LH spectra. Since VV Ser is a bright source between 10 and 40 m, we estimate the background to be a minor contribution, even considering the extended emission present around the source (see Paper II). The orders and modules were matched by scaling to the shortest wavelength order. The scaling factors applied were 5-10%, and the absolute flux level of the spectrum is therefore considered accurate only to 10-20%. The spectrum of VV Ser has AOR Key 0005651200. We present IRAC and MIPS imaging at 3.6, 4.5, 5.6, 8.0, 24 and 70 m of the area surrounding VV Ser in Paper II.
In support of the Spitzer observations, additional continuum data at 850 and 450 m were obtained in service mode with the Submillimetre Common User Bolometer Array (SCUBA) on the James Clerk Maxwell Telescope (JCMT)111The JCMT is operated by the Joint Astronomy Centre in Hilo, Hawaii on behalf of the parent organizations: the Particle Physics and Astronomy Research Council in the United Kingdom, the National Research Council of Canada and the Netherlands Organization for Scientific Research. on 2005 January 27. VV Ser was observed in a 64 point jiggle map (2.3′ field) with approximately one hour of integration. The weather was good with 225 Gz sky opacities of about 0.05. The pointing was checked regularly and found to be accurate to within a few arcseconds. Maps of CRL2688 and Mars were used for calibration purposes. The absolute calibration is accurate to about %. The beam size (HPBW) of the SCUBA observations is approximately 14′′ at 850 m. No continuum emission was detected toward VV Ser with a 3 upper limit of 10 mJy beam-1.
An ultraviolet spectrum obtained with the International Ultraviolet Explorer (IUE) was taken from the Multimission Archive at STScI (MAST)222 Some of the data presented in this paper were obtained from the Multimission Archive at the Space Telescope Science Institute (MAST). STScI is operated by the Association of Universities for Research in Astronomy, Inc., under NASA contract NAS5-26555. Support for MAST for non-HST data is provided by the NASA Office of Space Science via grant NAG5-7584 and by other grants and contracts.. More than 12 years of photometric monitoring in the optical UBVRI bands was taken from the catalogue of Rostopchina & Grinin (2001). The photometry for the VV Ser point source is summarized in Table 1.
| Wavelength (m) | Flux [Jy]1 | Reference |
|---|---|---|
| 0.2 | IUE | |
| 0.365 | (Rostopchina & Grinin, 2001) | |
| 0.44 | (Rostopchina & Grinin, 2001) | |
| 0.55 | (Rostopchina & Grinin, 2001) | |
| 0.70 | (Rostopchina & Grinin, 2001) | |
| 0.90 | (Rostopchina & Grinin, 2001) | |
| 1.235 | 2MASS | |
| 1.662 | 2MASS | |
| 2.159 | 2MASS | |
| 3.79 | (Berrilli et al., 1992) | |
| 4.64 | (Berrilli et al., 1992) | |
| 5.5 | Spitzer-IRS, this paper | |
| 8.0 | Spitzer-IRS, this paper | |
| 12.0 | Spitzer-IRS, this paper | |
| 25.0 | Spitzer-IRS, this paper | |
| 36.0 | Spitzer-IRS, this paper | |
| 70.0 | Spitzer-MIPS, paper II | |
| 450 | JCMT-SCUBA, this paper | |
| 850 | JCMT-SCUBA, this paper |
-
1
The optical photometry is for the “quiescent” state.
3. Source description
VV Ser is a typical UX Orionis star located in the Serpens molecular cloud. The adopted distance of VV Ser is pc as determined for the Serpens molecular complex by Straizys et al. (1996). There is some variation in the literature regarding the effective temperature of VV Ser, although most classify the star as a late B-type. Hernández et al. (2004) identify VV Ser as a B6 star due to the presence of a number of He lines in their low-resolution spectra. Mora et al. (2001) find a spectral type of A0 using high resolution spectroscopy. The exact choice does have measurable consequences for the model SED at wavelengths below m. The optical colors favor a star closer to A0 than B6. The stellar luminosity of 49 also suggests that VV Ser is of later type since a B6 classification puts it below the ZAMS in the HR diagram (Siess et al., 2000).
Since the optical-UV spectrum of VV Ser does not appear to be strongly veiled and is of high quality, it is possible to derive an accurate stellar luminosity of . Using the evolutionary tracks of Siess et al. (2000) and an effective temperature of 10,200 K, this gives a stellar mass of and an age of Myr for a solar metallicity. The uncertainties reflect the uncertainties in the luminosity and rather than those of the model tracks.
The optical colors of the star correspond to a steady extinction of , but with frequent, non-periodical dips lasting of order 10 days with brightness minima corresponding to 0.5–4.0 mag of additional extinction.
4. Model
To model the observed SED and Spitzer imaging of VV Ser, we use the axisymmetric Monte Carlo radiative transfer code RADMC (Dullemond & Dominik, 2004) in combination with the raytracer of the more general code RADICAL (Dullemond & Turolla, 2000). The density structure is axisymmetric, but the photons are followed in all three dimensions. The code is used to derive the temperature structure of a given dust distribution. The dust temperature is determined for a passive disk, i.e. it is assumed that accretion heating is negligible relative to direct stellar irradiation. This is justified by the high luminosity of the central star (49 ), since the accretion luminosity is for accretion rates (Kenyon et al., 1993). The low mass of the disk [], where is the gas to dust mass ratio (see. Sect. 5.1) also limits the possible range of accretion rates, since only a small fraction of the entire disk mass can be expected to accrete per year. The low mass of the disk is particularly well constrained by the 70 m MIPS point as well as the upper limit to the 850 m flux.
Once a temperature structure has been determined, RADICAL can be used to create SEDs and images. The code is restricted to isotropic scattering. Taking non-isotropic scattering into account may change the optical colors of the model somewhat, but without resolved optical images of the disk, non-isotropic scattering effects cannot be properly constrained. One advantage of the code is the ability to include an arbitrary number of dust components, each with a unique opacity. The setup has been used to model similar protostellar disks (Pontoppidan et al., 2005; Pontoppidan & Dullemond, 2005), while the code itself has been extensively tested for other applications (van Bemmel & Dullemond, 2003; Dullemond & Dominik, 2005; Meijerink et al., 2005) and has recently been benchmarked relative to independent continuum radiative transfer codes (Pascucci et al., 2004).
4.1. Disk geometry
VV Ser is modeled using a density structure consisting of a central disk surrounded by a spherically symmetric envelope. For the central disk, the following density structure is adopted:
| (1) |
where is the surface density and
| (2) |
is the disk scale height with the flaring index. The flaring index is for a passive irradiated disk with a grey dust opacity (Chiang & Goldreich, 1997). For the disk is non-flaring and shadowed. We have chosen an intermediate value of . However, once the disk is self-shadowed, the exact value of the flaring parameter does not have a strong influence on the SED. Eq. 1 is appropriate for the vertical structure of an isothermal disk in hydrostatic equilibrium and gives a convinient parametrization, even for disks that are non isothermal and not in hydrostatic equilibrium.
Indeed, we do not require a vertical structure determined by hydrostatic equilibrium such as that described in Chiang & Goldreich (1997) and Dullemond et al. (2001), but let the outer vertical scale height be a free parameter. While the unique solution of Chiang & Goldreich (1997) assumes that gas and dust are well-mixed and thermally coupled, there are several mechanisms that may operate to cause the vertical structure of the dust to deviate significantly from hydrostatic equilibrium. For instance, dust grains may decouple from the gas by grain growth and settling in which case hydrostatic equilibrium no longer applies. Recent modeling of dust settling indicates that it is a rapid process in circumstellar disks and produces highly observable effects (Dullemond & Dominik, 2004).
For the structure of the inner disk, we adopt a puffed-up inner rim model similar to that of Dullemond et al. (2001). The scale height of the inner rim, , is included as an adjustable parameter. The radius, , of the inner rim is set to the location at which a temperature of 1500 K is reached. Note that since the dust in the inner rim does not have a grey opacity, the radius of the inner rim is pushed to a significantly larger radius than that of grey dust. The puffed-up inner rim is connected to the “normal” disk structure by changing the scale height power law of Eq. (2) at a few times the inner rim radius such that the scale height rises inwards to meet the puffed-up inner rim. The radius of the break in the power law is not strongly constrained, and a presumably reasonable value of is adopted here.
The disk is surrounded by a large “envelope” simulating the presence of the large-scale molecular cloud. The column density of the cloud is adjusted to reproduce the measured extinction toward VV Ser outside of extinction events. A cavity centered on the star+disk system is carved out of the cloud. Paper II discusses the model fit on large spatial scales, including the detailed structure of the envelope, and how a local model grid for the envelope parameters was calculated, while this paper deals with the parameters of the disk itself.
4.2. Dust opacities
The mid-infrared spectrum and the optical colors indicate that several different dust opacities must be included in the model, corresponding to different parts of the disk. The silicate emission band at 9.7 m is broader and flatter than an interstellar feature (see Sect. 5.5), indicative of grain growth (Bouwman et al., 2001; Kessler-Silacci et al., 2006), whereas the colors of the flux variations at optical wavelengths indicate that the grains in the innermost parts of the disk are not very different from small interstellar grains. Grains large enough to produce a flat silicate feature will have grey opacities in the optical wavebands. Finally, the PAHs necessary to model the large nebulosity surrounding VV Ser contribute an opacity of their own (see paper II for details).
The model allows for an arbitrary number of distinct dust reservoirs with relative abundances that may vary throughout the grid. In the VV Ser disk, we use two distinct dust components: The first consists of small grains that produce non-grey opacities in the optical wavebands, the second component consists of larger m grains. The small-grain dust is located in the puffed-up rim (AU), while the rest of the disk is populated with the larger grain component.
The opacities of the thermalized dust grains are calculated using Mie theory. The grains are spherical silicates with inclusions of carbonaceous material. The silicate optical constants are those of oxygen-rich silicates from Ossenkopf & Henning (1994), while the carbon optical constants are of carbon clusters formed at 800 K from Jäger et al. (1998). We do not include any ice component in the dust opacity. The Maxwell-Garnett effective medium formula (e.g. Bohren & Huffman, 1983) has been used to calculate the optical constants of the silicate with carbon inclusions. The volume fraction of the carbon is 30%, roughly consistent with that determined by Draine (2003). The final opacities are then calculated with a grain size distribution consisting of a power law: with minimal () and maximal () grain sizes. The disk SED is attenuated by foreground dust from an extended envelope, which is discussed in detail in Paper II. The exact choices of grain size distributions for the disk dust are justified in Sects. 5.4 (optical colors) and 5.5 (silicate emission feature), and the dust parameters are summarized in Table 2. For comparison to other dust opacities, it is useful to note that the “large grain” dust opacity of the disk has , where is the gas to dust ratio. This is similar to, but on the small side of the opacities (for coagulated grains) of Ossenkopf & Henning (1994).
5. Observed features explained by the model
5.1. Constraining the model
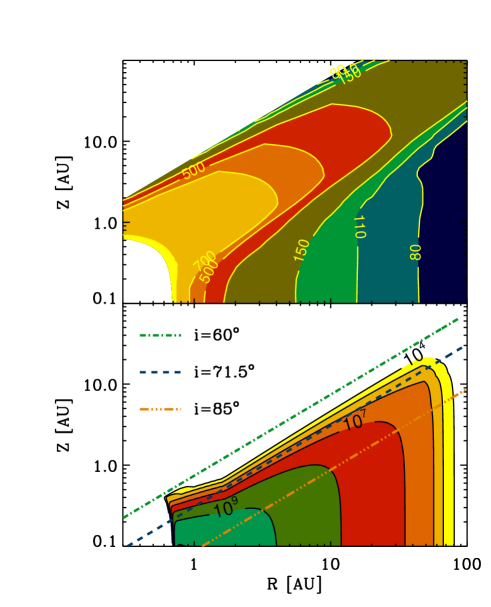
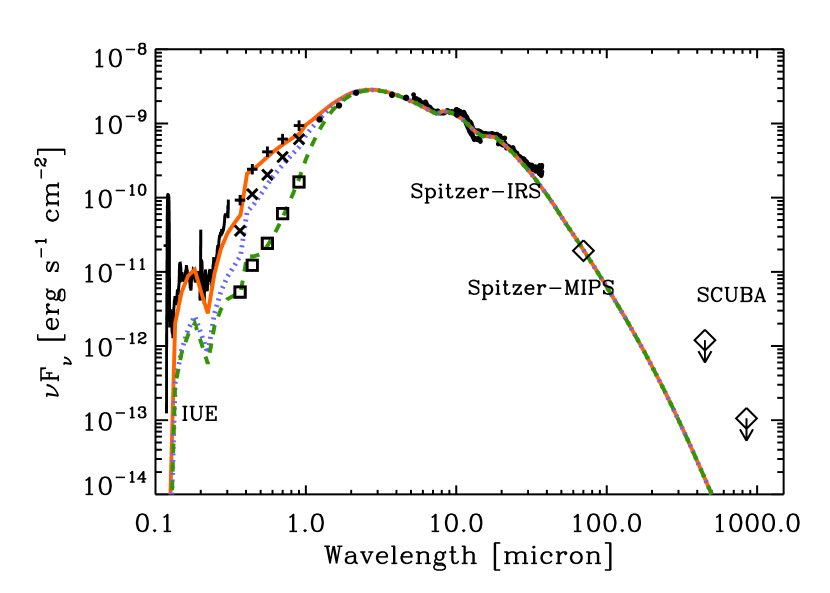
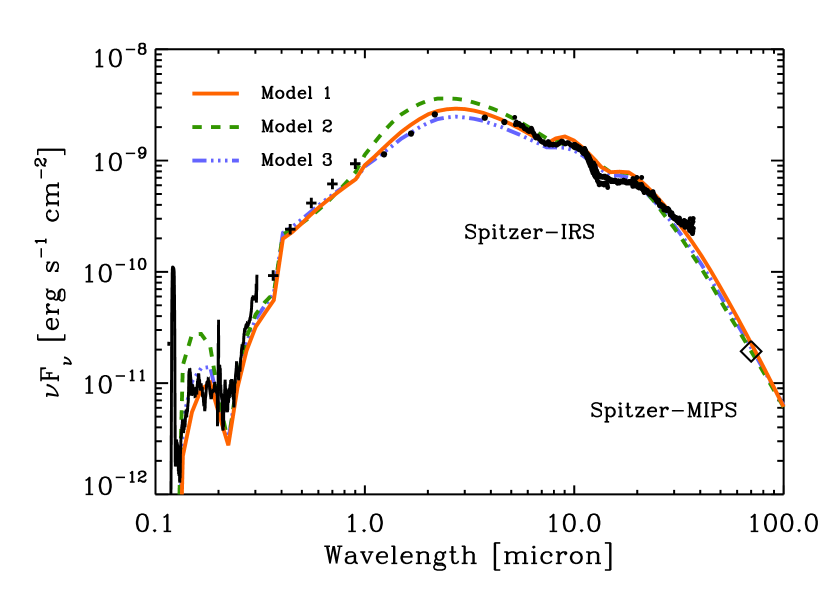
Due to the long computing times for a single model, the model parameters are varied by hand. Rather than calculating a comprehensive grid in all parameters, hundreds of models were calculated until a good fit was found to all the observable quantities. While this is not an optimal method for quantifying any degeneracies in the fit, some parameters may be independently constrained on physical grounds. In Table 3, the parameters of the best-fitting model are summarized. This model has been constructed using all available observational constraints apart from the near-infrared interferometry visibilities discussed in Sect. 5.6. We will refer to this model as “Model 1”. The density and temperature structure of Model 1 are shown in Fig. 1. The SED of Model 1 is compared to the observed SED of VV Ser in Fig. 2. In Sect. 5.2–5.5, we discuss how each observation property is connected to the model. In Sect. 5.6, it is discussed how the near-infrared interferometry from the literature requires Model 1 to be modified on small scales.
5.2. Extinction events
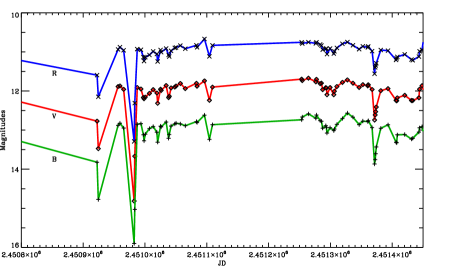
The optical light curve of VV Ser, observed by Rostopchina & Grinin (2001), is shown in Fig. 3. It is seen that the light curve of VV Ser contains a number of extinction events, each lasting a few days. Although each event is undersampled, their average duration can be estimated by searching for the duration most compatible with all the observed events. Assuming that the extinction events have an identical Gaussian shape in the light curve and vary only in intensity, it is found that the events are consistently shorter than 5.5 days and longer than 3.0 days (FWHM). The best-fitting Gaussian is shown in the right panel of Fig. 3. The width of any perturbation of the inner rim causing an extinction event is likely to be less than or comparable to the pressure scale height of the disk. Scenarios where this is not the case are interesting to consider, but probably require hydrodynamical simulations to constrain. Assuming Keplerian rotation, this requirement constrains the radius of the inner rim of the disk, since a rim radius that is too small will cause extinction events to be shorter than those observed. An inner radius corresponding to a dust sublimation temperature of 1500 K for small grains is located at 0.7–0.8 AU at the VV Ser luminosity of . This corresponds to a rotation period of the inner rim of days and a physical size of the dust perturbation causing the extinction in the azimuthal direction of 0.09–0.15 AU. A spherical dust perturbation then has an average density of 2–3 cm-3 in order to produce a maximum observed extinction of 5 magnitudes in the band. These values are close to those of the model with an inner rim scale height of and a maximum gas density along the line of sight of cm-3 between extinction events for an inclination of . A specific extinction event then corresponds to creating an over-density in the inner rim enhanced by a factor of a few compared to the “quiescent” state of the inner disk.
5.3. The outer radius
The outer radius of the disk is not well constrained and is somewhat degenerate with the disk opening angle. The mass is constrained by the 70 m MIPS point and the 850 m upper limit to be as low as . As usual, it must be stressed that the observations do not probe grains that have grown to sizes of more than a few mm, and the disk may contain a significant population of such grains in the mid-plane. Similarly, any total mass estimate will necessarily assume a dust-to-gas ratio of 100, but this is likely to be very different for a disk as evolved as VV Ser. The mass of small dust grains is accurate to the uncertainty in the far-infrared opacity, i.e. by a factor of a few.
| Component | [m] | [m] | Disk regime |
|---|---|---|---|
| Model 1 (Standard model) and Model 2 | |||
| Small grains | 0.005 | 0.4 | AU, AU |
| Large grains | 0.3 | 3.0 | AU |
| Model 3 | |||
| Small grains | 0.005 | 0.4 | AU, AU |
| Large grains | 0.3 | 3.0 | , AU |
| Parameter | Model 1 | Model 2 | Model 3 | Estimated range (see text) |
| Lum. | 49 | – | – | 45–55 |
| Sp. T. | B9 (10 200 K) | – | – | A2–B6 |
| Dust mass | – | – | 0.1–8.0 | |
| – | – | not explored | ||
| 1/7 | – | – | not explored | |
| 0.125 | – | – | 0.1–0.15 | |
| 0.105 | – | – | 0.1–0.15 | |
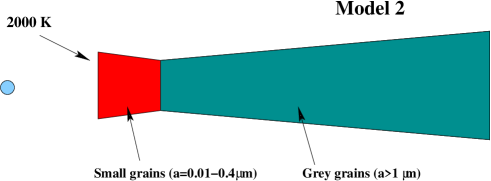
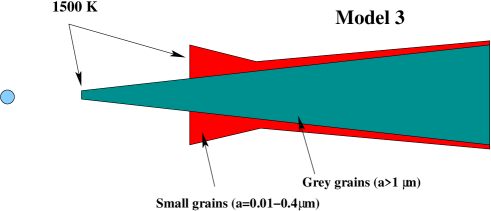
| 1500 K | 2000 | 1500 | 1300–1600 K | |
| 0.7 AU | 0.4 | 0.27 and 0.80 | given by | |
| 50 AU | – | – | 20–200 AU | |
| Incl. | 65–75° | |||
| P.A. | 10–20°(see Paper II) |


5.4. Optical photometry and variability
As discussed in Sect. 4.2, the observation that the grains responsible for the silicate emission features appear to be different from those responsible for the extinction events is taken into account in the model. While many UX Orionis stars appear to have disks in which the dust causing the extinction events is dominated by small grains (m) (van den Ancker, 1999), models of grain growth predict that the inner parts of disks very quickly become dominated by large grains (Dullemond & Dominik, 2005). A priori, it is not clear why the grains responsible for the extinction events have a different size distribution than those of the outer disk. As a first attempt, we simply model the observations by changing the opacity of the dust in the puffed-up inner rim at radii between the rim and the break in the scale height power law defined in Sect. 4 (see Table 2). This has the effect of converting the grey (in the UV–NIR) disk opacity to one reproducing the optical colors. Note that this also causes the inner rim to absorb visible photons more efficiently than it re-emits the energy in the near-infrared. This significantly increases the temperature of the star-facing surface of the rim and has the effect of pushing the rim outwards, given a certain dust sublimation temperature. Possible alternative geometries are discussed in Sect. 5.6.
The grain model of the material causing the extinction events is constrained by the optical extinction curve that can be derived by the observed optical reddening vectors. The extinction events correspond to grains that appear to have properties similar to those of interstellar grains. The reddening vectors in the optical color-magnitude diagrams are fitted by a power-law grain size distribution by varying the minimum and maximum sizes as well as the power law index. Not unexpectedly, a good fit is found for m, m, giving an optical extinction law with .
As discussed in Sect. 5.1 the perturbations of the inner rim are presumably not wider in the azimuthal direction than the pressure scale height. In essence this means that a dust perturbation in a Keplerian orbit roughly subtending as seen from the star is responsible for an extinction event. The optical variability of VV Ser is therefore fundamentally a three-dimensional effect and to model it within the axisymmetric framework presented here requires some assumptions. If it is assumed that the azimuthal angle the dust perturbation subtends as seen from the star is , and that the shadowing and scattering effects caused by the perturbation will not affect the thermal part of the SED. In this case, only the extinction at a specific inclination through the perturbation needs to be taken into account. This means that the temperature structure of the system can be calculated for the “quiescent” state of the inner rim in which no localized perturbation of dust is providing extra extinction toward the star. The “active” state corresponding to an extinction event is simulated by using the temperature structure calculated by the Monte Carlo code, but adding extra extinction to the input spectrum of the central star when calculating the final SED by raytracing. Thus, by attenuating the star by a variable amount of dust, model tracks through the optical color-magnitude diagrams can be constructed and compared to the observed tracks. The effect on the SED of attenuating the input stellar spectrum by a variable extinction () is shown in Fig. 2 and compared to photometric data obtained during and outside of extinction events.
In the model for VV Ser, a blueing effect occurs naturally because scattering dominates the optical flux for high optical depths through the extincting blob of dust. The resulting model tracks are plotted on the observed photometric points for VV Ser in Fig. 4. The tracks correspond to ’s of 0.0–4.0 mag. It is seen that a strong blueing effect appears for mag. The blueing is strongest in the color. In a slight reddening is seen instead. This is due to the band photons being slightly dominated by thermal emission from the 1500 K inner rim rather than from scattering of photospheric photons. The model approximately reproduces this behaviour, although some differences are noticeable. The use of isotropic scattering, as opposed to non-isotropic scattering that tends to be forward-throwing, may account for some (up to a factor of 2 in absolute flux) of this difference. There are also slight absolute offsets between the model colors and the observed colors. This offset may be due to inaccuracies in the stellar spectrum. The differences in colors between the possible range of spectral types (A2 to B6, see Table 3) is 0.55, 0.20, 0.14 and, 0.12 magnitudes for , , and , respectively, differences similar to or larger than the model-data offsets. Finally, small changes in the Johnson filter curves used in the models can produce similar offsets.
5.5. Mid-infrared spectrum
The 5.2–37.0 m spectrum as observed by Spitzer-IRS is dominated by the silicate emission bands at 9.7 and 18 m. The 9.7 m band is significantly broader and flatter than that of interstellar silicate grains. This is illustrated in Fig. 5 where the shapes of the observed silicate bands are compared to those of dust opacities corresponding to grains of different sizes. In the figure, the disk continuum has been subracted by fitting a power law to the spectrum at 5.5, 13 and 30-40 m, following the procedure of Kessler-Silacci et al. (2006). A broadening of the 9.7 m silicate band is indicative of a grain size distribution dominated by grains larger than m (van Boekel et al., 2005; Kessler-Silacci et al., 2006). Other emission features may appear to broaden the silicate bands. These include emission bands due to PAHs that in the case of VV Ser are visible at 6.2 m and possibly at 11.3 m, although this feature may also be due to crystalline silicates (see also Geers et al., accepted). Because they are bright and unresolved, the PAH emission features are not related to the larger nebulosity discussed in Paper II and are most likely due to material associated with the disk. The exact dust size distribution of the “large grain” component is not strongly constrained by the silicate features, in particular not in the disk mid-plane. Here, we adopt a dust mixture with diameters m and m. The most important property of the large grain mixture, for the purposes of this model, is that it has grey optical and near-infrared opacities. As long as this condition is satisfied, the conclusions reached from the modeling are not sensitive to the details in the size distribution of the large grain component. It is likely that the dust mass of the disk has a significant population of much larger (millimeter-sized) grains (e.g. Dullemond & Dominik, 2005), but this component is not constrained by the observations presented here.
Another parameter constrained by the Spitzer-IRS spectrum, central to the discussion of VV Ser as a UX Orionis class Herbig Ae star, is the slope of the mid-infrared SED. As suggested by Dullemond et al. (2003), if the inner-most regions of the disk are responsible for the extinction events, the outer disk must have a scale height, , similar to or smaller than that of the puffed-up inner rim. This is the definition of a self-shadowed disk, characterized by a declining spectrum for m with weak silicate emission features. This type of object also corresponds to a “group II” object in the classification of Meeus et al. (2001). VV Ser clearly has a mid-infrared SED that suggests that the disk is self-shadowed. However, in the model, the declining SED is in part caused by the low mass of the disk, i.e. to avoid predicting too much flux at , the models are constrained both to be self-shadowed and to have a total gas + dust mass of . In particular, the low mass is necessary to keep the SED declining beyond m, while the shadow of the puffed-inner rim ensures that the SED declines between 5 and 30 m. A simple test of this was conducted by removing the puffed-up inner rim from the model, which resulted in a flat SED below 30 m. In the best-fitting model, 90% (1.3 mag) of the extinction at 0.2 m in the disk along a sight-line inclined at 71.5°relative to the disk axis occurs within 1.5 AU.
Does the model suggest that the scale height of the disk has been lowered due to dust settling, or has only the apparent dust mass been lowered? The scale height, for hydrostatic equilibrium at 50 AU is . This is somewhat smaller than the model scale height of . However, this value is not strongly constrained, as long as the inner disk shadows the outer, it is difficult to tell the difference without having more sensitive photometry at wavelengths longer than 70 m.

5.6. Near-infrared interferometry
Several interferometric measurements of the near-infrared morphology of the innermost part of the VV Ser system are available in the literature. Eisner et al. (2003, 2004) presented -band interferometry observations of VV Ser performed with the Palomar testbed interferometer. These authors find a -band size of VV Ser of mas for a generic flared disk with a puffed-up inner rim from Dullemond et al. (2001). This corresponds to AU, or exactly half of the radius used in Model 1. In principle, this smaller radius will result in a dust temperature in the inner rim of 2000 K, using the opacity stipulated by the extinction events. While the interferometry does suffer from a poor sampling of the u-v plane, this is a discrepancy which deserves a closer look. There are several ways of resolving the problem: the presented model includes a large cleared-out inner region due to the high temperatures of small grains. However, the location of the rim, given a dust sublimation temperature, actually depends on the dust opacity. A non-grey opacity will tend to absorb more energy in the optical than it can emit in the near-infrared, increasing the temperature of the grains in the optically thin region of the puffed-up inner rim. This will tend to erode the inner edge of the rim, as small grains are heated above their sublimation temperature. This is reflected in the inner radius of Model 1. Conversely, larger grains with a more grey opacity will significantly decrease the temperature at a given radius of the inner rim, and consequently will decrease for the same dust sublimation temperature. Specifically, using the grain opacity for the outer (¿2 AU) disk rather than the grains responsible for the UX Orionis events, will place the inner rim close to the value determined by Eisner et al. (2004), i.e. 0.3–0.4 AU for an optically thick inner rim. This scenario then requires that small grains only appear in the upper layers of the puffed-up rim, while larger grains can penetrate close to the star in a flatter structure. This extra copmonent of large grains within the present inner rim does not strongly affect the model SED of VV Ser.
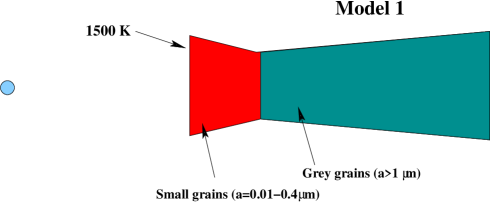
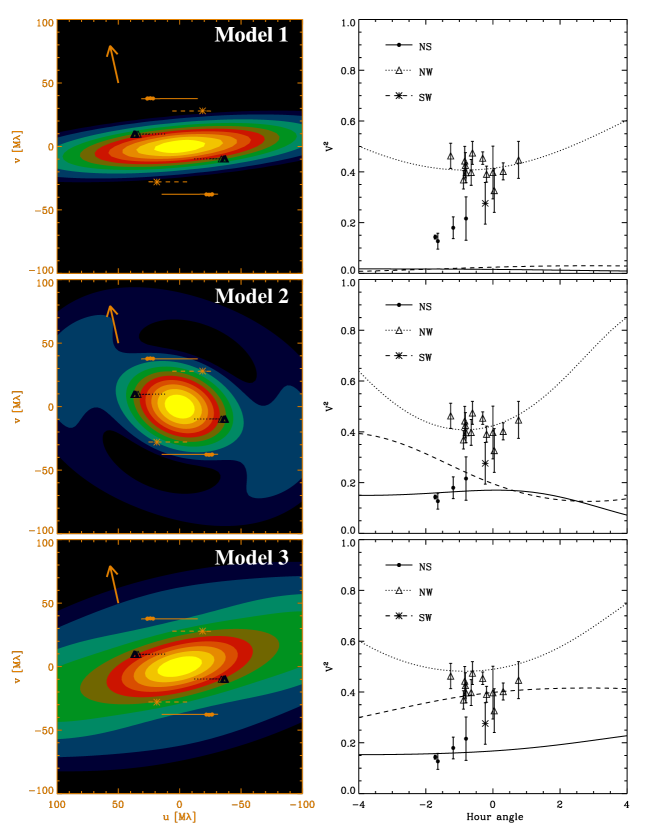
To explore the possibilities offered by interferometry, we have calculated the visibilities for our model as well as several alternative structures of the inner rim and compared them to those from Eisner et al. (2004). In Fig. 6, the structures of three different types of inner rim are sketched (Model 1 refers to the standard model discussed in the previous sections). Fig. 7 shows the calculated SEDs for the three models, while Fig. 8 shows the best fit visibilities from the three models (allowing the position and inclination angles to vary). In the following, position angles are those of the disk plane measured east of north. It is clear that given the position angle derived from the Spitzer images presented in paper II, the NW baseline visibilites can be well fitted, but the NS and SW baselines produce visibilities that are severely underpredicted by Model 1, i.e. the visibilities are overresolved in the direction of the disk plane. As noted by Eisner et al. (2004), the single point observed with the SW baseline may be significantly more uncertain than the statistical error bar indicates. We therefore assign little weight to this point. However, the bad fit to the NS baseline appears significant. Given the sparse uv coverage, several widely different scenarios may provide better fits.
First, assuming that the position angle of 10–20 from paper II is correct, the easiest way to amend the model to fit the near-infrared visibilities is by making the radius of the inner rim significantly smaller, thereby increasing the visibility along the major axis of the system. -band visibilities of a model in which the inner rim radius has artificially been placed at 0.4 AU has been calculated (Model 2 in Fig. 6). A significant problem with this model is that it does not fit the SED because the small grains in the inner rim reach temperatures of 2000 K. Note that Eisner et al. (2004) finds a temperature of 1500 K at this radius due to an assumption of a grey opacity for the inner rim. Additionally, a good fit to all three baselines can only be found for a position angle of and an inclination of 40°, consistent with that found by Eisner et al. (2004), but inconsistent with the orientation of the surrounding nebulosity as described in paper II. Recently, Isella et al. (2006) found a position angle of 60-120 using the same interferometric data, roughly consistent with the result of Eisner et al. (2004). If the single uncertain point of the SW baseline is ignored, a good fit can be found for the inclination and position angle found in paper II. These two possibilities need to be tested by further interferometric observations.
Another option to reconcile the interferometry with the Spitzer images is a model in which large grains in the disk mid-plane reach smaller radii in an optically thin region within the outer puffed-up inner rim (Model 3 in Fig. 6). This structure is, in fact, quite plausible since the temperature can be maintained below 1500 K, as discussed above. This is presumably a natural scenario in a disk in which the large grains have settled to the mid-plane. We therefore construct a model in which the structure of the “standard” model is maintained (with small grains in a puffed-up inner rim), but with an additional component between 0.27 and 0.8 AU consisting of the large grains of the outer disk and with a structure following Eq. (2). Essentially, this model represents a rough simulation of the effect of grain settling and density-dependent evaporation on the structure of the inner rim. This disk has basically two rims, both with a maximum dust temperature of 1500 K. The central idea of this scenario is that the SED is not strongly affected, since both dust components have a temperature of K. At the same time, the visibilities can be fitted by a disk with the same position angle and inclination as that found in paper II using the morphology of the nebulosity seen in the IRAC and MIPS images of VV Ser. By tweaking additional parameters such as the density structure of the grey dust and the exact location of the inner rim, an excellent fit to all the observables can be obtained. In particular, we find that a better fit to the visibilities is achieved if the surface density within 0.8 AU is lowered by a factor of 5 to create an inner large grain component with roughly unity optical depth in the radial direction. This creates an inner rim that is not perfectly sharp, but radiates at a range of radii. This seems consistent with the structure predicted by Isella & Natta (2005) using a density dependent grain evaporation temperature.
Another option to fit the interferometer data is to add an additional point source offset by a few mas to produce additional visibility in the NW and SW baselines. We do not attempt to model this scenario here, but simply note that a few extra visibility data points will be able to distinguish between an additional point source and a small inner rim.
Finally, it is possible that hot gas within the inner rim may produce a significant contribution to the -band continuum as suggested by Akeson et al. (2005), who showed models of PTI visibilities for a small sample of T Tauri stars. In fact, gas may produce much the same near-infrared morphology as that modeled here using two dust components. However, in order for the gas to be sufficiently luminous, a high accretion rate of at least is required (Muzerolle et al., 2004). The accretion rate of VV Ser is lower than this, as evidenced by the lack of UV excess and the very low disk mass.
6. Conclusions
We have presented Spitzer mid-infrared spectroscopy of the UX Orionis star VV Ser combined with additional spectroscopy and imaging data from the literature spanning wavelengths from 0.1 to 850 m. Using an axisymmetric dust radiative transfer model, we have reached the following conclusions:
-
•
All available data are consistent with the interpretation of the UX Orionis phenomenon in which the central star is transiently attenuated by dust clumps in the inner puffed-up region of an inclined, self-shadowed disk (the specific inclination is supported by the imaging data presented in Paper II). While VV Ser is a very specific case that has been singled out due to the availability of a wealth of multi-wavelength, high quality data, it provides strong support for this interpretation in the more general case.
-
•
The disk appears to be both self-shadowed and low-mass, and both properties contribute to the quick decline with wavelength of the SED at mid- and far-infrared wavelengths.
-
•
The duration of the extinction events is consistent with an orbit of the dust perturbations in the inner rim at a radius of AU.
-
•
The dust responsible for the extinction events must be dominated by small, interstellar-like grains, while the dust in the outer ( AU) disk appears to be dominated by somewhat larger grains (m). It is unlikely that the extincting dust clumps can be located significantly closer to the central star, since this would require them to subtend a much larger azimuthal angle than that corresponding to the scale height of the inner rim. Additionally, they would be heated above their sublimation temperature.
-
•
Our best-fit inner rim radius of 0.8 AU is in contradiction with the -band interferometry of Eisner et al. (2004) which clearly indicates an inner rim radius of 0.3–0.4 AU. A possible solution is to let the puffed-up inner rim consist of small grains at 0.8 AU while allowing a population consisting of larger grains to penetrate to 0.25 AU in a mid-plane that is optically thin to infrared photons.
-
•
The detailed structure of the inner rim described above is constrained both from the interferometry and the independent measurement of the disk inclination and position angles from large scale imaging as discussed in Paper II.
-
•
We therefore interpret the -band interferometric data of Eisner et al. (2004) as evidence for larger grains in the disk mid-plane penetrating closer to the star than the small grains in the puffed-up inner rim. This is consistent with a scenario in which all dust grains sublimate at K and larger grains have settled to the disk mid-plane, leaving only small grains in the disk surface.
-
•
Clearly, further tests of the detailed structure of the puffed-up inner rim are within reach of the current observational capabilities. Aperture synthesis observations with upcoming facilities such as VLTI-AMBER in combination with multi-wavelength imaging and spectroscopy are certain to greatly enhance our understanding of the innermost parts of proto-planetary disks.
References
- Akeson et al. (2005) Akeson, R. L., Walker, C. H., Wood, K., Eisner, J. A., Scire, E., Penprase, B., Ciardi, D. R., van Belle, G. T., Whitney, B., & Bjorkman, J. E. 2005, ApJ, 622, 440
- Berrilli et al. (1992) Berrilli, F., Corciulo, G., Ingrosso, G., Lorenzetti, D., Nisini, B., & Strafella, F. 1992, ApJ, 398, 254
- Bertout (2000) Bertout, C. 2000, A&A, 363, 984
- Bohren & Huffman (1983) Bohren, C. F., & Huffman, D. R. 1983, Absorption and scattering of light by small particles (New York: Wiley, 1983)
- Bouwman et al. (2001) Bouwman, J., Meeus, G., de Koter, A., Hony, S., Dominik, C., & Waters, L. B. F. M. 2001, A&A, 375, 950
- Chiang & Goldreich (1997) Chiang, E. I., & Goldreich, P. 1997, ApJ, 490, 368
- Draine (2003) Draine, B. T. 2003, ARA&A, 41, 241
- Duchêne et al. (2003) Duchêne, G., Ménard, F., Stapelfeldt, K., & Duvert, G. 2003, A&A, 400, 559
- Dullemond & Dominik (2004) Dullemond, C. P., & Dominik, C. 2004, A&A, 417, 159
- Dullemond & Dominik (2005) —. 2005, A&A, 434, 971
- Dullemond et al. (2001) Dullemond, C. P., Dominik, C., & Natta, A. 2001, ApJ, 560, 957
- Dullemond & Turolla (2000) Dullemond, C. P., & Turolla, R. 2000, A&A, 360, 1187
- Dullemond et al. (2003) Dullemond, C. P., van den Ancker, M. E., Acke, B., & van Boekel, R. 2003, ApJ, 594, L47
- Eisner et al. (2003) Eisner, J. A., Lane, B. F., Akeson, R. L., Hillenbrand, L. A., & Sargent, A. I. 2003, ApJ, 588, 360
- Eisner et al. (2004) Eisner, J. A., Lane, B. F., Hillenbrand, L. A., Akeson, R. L., & Sargent, A. I. 2004, ApJ, 613, 1049
- Evans et al. (2003) Evans, N. J., Allen, L. E., Blake, G. A., Boogert, A. C. A., Bourke, T., Harvey, P. M., Kessler, J. E., Koerner, D. W., Lee, C. W., Mundy, L. G., Myers, P. C., Padgett, D. L., Pontoppidan, K., Sargent, A. I., Stapelfeldt, K. R., van Dishoeck, E. F., Young, C. H., & Young, K. E. 2003, PASP, 115, 965
- Grady et al. (1997) Grady, C. A., Sitko, M. L., Bjorkman, K. S., Perez, M. R., Lynch, D. K., Russell, R. W., & Hanner, M. S. 1997, ApJ, 483, 449
- Grinin (1988) Grinin, V. P. 1988, Pis ma Astronomicheskii Zhurnal, 14, 65
- Hernández et al. (2004) Hernández, J., Calvet, N., Briceño, C., Hartmann, L., & Berlind, P. 2004, AJ, 127, 1682
- Houck et al. (2004) Houck, J. R., Roellig, T. L., van Cleve, J., Forrest, W. J., Herter, T., Lawrence, C. R., Matthews, K., Reitsema, H. J., Soifer, B. T., Watson, D. M., Weedman, D., Huisjen, M., Troeltzsch, J., Barry, D. J., Bernard-Salas, J., Blacken, C. E., Brandl, B. R., Charmandaris, V., Devost, D., Gull, G. E., Hall, P., Henderson, C. P., Higdon, S. J. U., Pirger, B. E., Schoenwald, J., Sloan, G. C., Uchida, K. I., Appleton, P. N., Armus, L., Burgdorf, M. J., Fajardo-Acosta, S. B., Grillmair, C. J., Ingalls, J. G., Morris, P. W., & Teplitz, H. I. 2004, ApJS, 154, 18
- Isella & Natta (2005) Isella, A., & Natta, A. 2005, A&A, 438, 899
- Isella et al. (2006) Isella, A., Testi, L., & Natta, A. 2006, A&A, 451, 951
- Jäger et al. (1998) Jäger, C., Mutschke, H., & Henning, T. 1998, A&A, 332, 291
- Kenyon et al. (1993) Kenyon, S. J., Calvet, N., & Hartmann, L. 1993, ApJ, 414, 676
- Kessler-Silacci et al. (2006) Kessler-Silacci, J., Augereau, J.-C., Dullemond, C. P., Geers, V., Lahuis, F., Evans, II, N. J., van Dishoeck, E. F., Blake, G. A., Boogert, A. C. A., Brown, J., Jørgensen, J. K., Knez, C., & Pontoppidan, K. M. 2006, ApJ, 639, 275
- Meeus et al. (2001) Meeus, G., Waters, L. B. F. M., Bouwman, J., van den Ancker, M. E., Waelkens, C., & Malfait, K. 2001, A&A, 365, 476
- Meijerink et al. (2005) Meijerink, R., Tilanus, R. P. J., Dullemond, C. P., Israel, F. P., & van der Werf, P. P. 2005, A&A, 430, 427
- Mora et al. (2001) Mora, A., Merín, B., Solano, E., Montesinos, B., de Winter, D., Eiroa, C., Ferlet, R., Grady, C. A., Davies, J. K., Miranda, L. F., Oudmaijer, R. D., Palacios, J., Quirrenbach, A., Harris, A. W., Rauer, H., Cameron, A., Deeg, H. J., Garzón, F., Penny, A., Schneider, J., Tsapras, Y., & Wesselius, P. R. 2001, A&A, 378, 116
- Muzerolle et al. (2004) Muzerolle, J., D’Alessio, P., Calvet, N., & Hartmann, L. 2004, ApJ, 617, 406
- Natta et al. (2001) Natta, A., Prusti, T., Neri, R., Wooden, D., Grinin, V. P., & Mannings, V. 2001, A&A, 371, 186
- Natta & Whitney (2000) Natta, A., & Whitney, B. A. 2000, A&A, 364, 633
- Ossenkopf & Henning (1994) Ossenkopf, V., & Henning, T. 1994, A&A, 291, 943
- Pascucci et al. (2004) Pascucci, I., Wolf, S., Steinacker, J., Dullemond, C. P., Henning, T., Niccolini, G., Woitke, P., & Lopez, B. 2004, A&A, 417, 793
- Pontoppidan & Dullemond (2005) Pontoppidan, K. M., & Dullemond, C. P. 2005, A&A, 435, 611
- Pontoppidan et al. (2006) Pontoppidan, K. M., Dullemond, C. P., & et al. 2006, ApJ
- Pontoppidan et al. (2005) Pontoppidan, K. M., Dullemond, C. P., van Dishoeck, E. F., Blake, G. A., Boogert, A. C. A., Evans II, N. J., Kessler-Silacci, J. E., & Lahuis, F. 2005, ApJ, 622, 463
- Rostopchina & Grinin (2001) Rostopchina, A. N., & Grinin, V. P. 2001, Astronomy Reports, 45, 51
- Siess et al. (2000) Siess, L., Dufour, E., & Forestini, M. 2000, A&A, 358, 593
- Straizys et al. (1996) Straizys, V., Cernis, K., & Bartasiute, S. 1996, Baltic Astronomy, 5, 125
- Thi et al. (2002) Thi, W. F., Pontoppidan, K. M., van Dishoeck, E. F., Dartois, E., & d’Hendecourt, L. 2002, A&A, 394, L27
- van Bemmel & Dullemond (2003) van Bemmel, I. M., & Dullemond, C. P. 2003, A&A, 404, 1
- van Boekel et al. (2005) van Boekel, R., Min, M., Waters, L. B. F. M., de Koter, A., Dominik, C., van den Ancker, M. E., & Bouwman, J. 2005, A&A, 437, 189
- van den Ancker (1999) van den Ancker, M. 1999, Ph.D. Thesis
- Watson & Stapelfeldt (2004) Watson, A. M., & Stapelfeldt, K. R. 2004, ApJ, 602, 860
- Werner et al. (2004) Werner, M. W., Roellig, T. L., Low, F. J., Rieke, G. H., Rieke, M., Hoffmann, W. F., Young, E., Houck, J. R., Brandl, B., Fazio, G. G., Hora, J. L., Gehrz, R. D., Helou, G., Soifer, B. T., Stauffer, J., Keene, J., Eisenhardt, P., Gallagher, D., Gautier, T. N., Irace, W., Lawrence, C. R., Simmons, L., Van Cleve, J. E., Jura, M., Wright, E. L., & Cruikshank, D. P. 2004, ApJS, 154, 1
- Wolf et al. (2003) Wolf, S., Padgett, D. L., & Stapelfeldt, K. R. 2003, ApJ, 588, 373
- Wood et al. (2002) Wood, K., Wolff, M. J., Bjorkman, J. E., & Whitney, B. 2002, ApJ, 564, 887