Molecular gas in extreme star-forming environments: the starbursts Arp 220 and NGC 6240 as case studies
Abstract
We report single-dish multi-transition measurements of the 12CO, HCN, and HCO+ molecular line emission as well as HNC J=1–0 and HNCO in the two ultraluminous infra-red galaxies Arp 220 and NGC 6240. Using this new molecular line inventory, in conjunction with existing data in the literature, we compiled the most extensive molecular line data sets to date for such galaxies. The many rotational transitions, with their different excitation requirements, allow the study of the molecular gas over a wide range of different densities and temperatures with significant redundancy, and thus allow good constraints on the properties of the dense gas in these two systems. The mass () of dense gas () found accounts for the bulk of their molecular gas mass, and is consistent with most of their IR luminosities powered by intense star bursts while self-regulated by O,B star cluster radiative pressure onto the star-forming dense molecular gas. The highly excited HCN transitions trace a gas phase denser than that of the sub-thermally excited HCO+ lines (for both galaxies). These two phases are consistent with an underlying density-size power law found for Galactic GMCs (but with a steeper exponent), with HCN lines tracing denser and more compact regions than HCO+. Whether this is true in IR-luminous, star forming galaxies in general remains to be seen, and underlines the need for observations of molecular transitions with high critical densities for a sample of bright (U)LIRGs in the local Universe – a task for which the HI-FI instrument on board Herschel is ideally suited to do.
1 Introduction
A cardinal result in extra-galactic astronomy over the last 20 years has been the discovery by IRAS of a population of local Ultra Luminous Infra-Red Galaxies (ULIRGs – Soifer et al. (1986); see also Sanders & Mirabel (1996), and Lonsdale, Farrah & Smith (2006)). Although these galaxies are rare in the local Universe, their extreme IR-luminosities () and merger morphologies strongly suggest that they signify a highly active and important phase in galaxy evolution – a scenario which is corroborated by the rapid increase in their space density with redshift. Furthermore, ULIRGs – being gas-rich mergers harboring the most extreme star-forming conditions encountered in the local Universe – are thought to re-enact the galaxy formation processes we are only barely able to glimpse in the distant Universe. Although, detailed studies of the interstellar medium (ISM) in proto-galaxies at high redshifts will be possible with the new generation of cm/mm/sub-mm telescopes and receivers coming online within the next decade, our expectations of how such objects will look in mm/sub-mm line emission are ill-informed due to the dearth of similar data locally. Multi-line studies of the low-intensity starbursts M 82 and NGC 253 have been made (Nguyen-Q-Rieu et al. 1992; Jackson et al. 1995; Paglione, Jackson & Ishizuki 1997), but given that their star formation rates are about three orders of magnitude lower than that of typical ULIRGs, they may very well not be good guides for the state of the ISM in local ULIRGs and high- starbursts (Aalto et al. 1995; Papadopoulos & Seaquist 1998; Downes & Solomon 1998).
In contrast, local ULIRGs, owing to their extreme IR/CO-brightness, are ideal targets for multi-line studies of heavy rotor molecules such as HCN, CS and HCO+. These lines are usually times weaker than their CO -level counterparts, making them currently impossible to detect in more distant galaxies and/or galaxies with lower star formation rates. Secondly, their compact H2 distributions – as revealed by interferometric maps (e.g. Scoville et al. 1997; Tacconi et al. 1999) – allow us to collect the total line flux of these often weak lines with a single pointing. This is important since multi-beam receivers, capable of observing many transitions of a variety of species within a reasonable amount of telescope time, are still lacking. These two factors, brightness and relatively compact molecular gas distributions, allow us to study the properties of the dense (cm-3) gas phase in local ULIRGs in much greater detail than would otherwise be possible. This is of great importance, because the dense gas provides the immediate star formation fuel in galaxies (Gao & Solomon 2004a,b; Wu et al. 2005). The possibility of a universal star formation efficiency, as proposed by these studies, can now be checked in a much more powerful manner, since we can estimate the dense H2 mass using multiple lines rather than a single line such as HCN .
In the local Universe, Arp 220 and NGC 6240 are ideally suited for studies of the dense gas in extreme starburst galaxies, as they are the two most studied (U)LIRGs to date. They have the best sampled FIR/sub-mm spectral energy distributions (SEDs) of their class (e.g. Dopita et al. 2005), and the largest number of mm/sub-mm CO, HCN, CS, and HCO+ transitions already observed. Thus not only are their dust continuum SEDs well constrained, but it is also relatively straightforward to fill the gaps in their molecular line inventory. Being the nearest and best studied, Arp 220 is the ULIRG most frequently used as a template for high- studies of starbursts. The prominent Active Galactic Nucleus (AGN) present in NGC 6240 (even double-AGN, Komossa et al. (2003), but not in Arp 220, cf. Iwasawa et al. (2005)) offers the possibility to study the influence of an AGN on the molecular ISM, for example how X-ray Dissociation Regions (XDRs) affect H2 cloud chemistry, significantly altering the HCO+ and HCN abundances (Lepp & Dalgarno 1996; Usero et al. 2004).
In this paper we present single-dish observations of a number of molecular emission lines from Arp 220 and NGC 6240, which together with results from the literature allows us to compile a very large (and almost identical) molecular transition catalog for these two extreme starbursts. Armed with this unique catalog, and the large range of excitation conditions it can probe (with significant overlap/redudancy between HCN and CS lines) we use it to: a) set constraints on the physical properties of the dense molecular gas phase, b) find the gas density probed per molecular species and its mass range, and c) explore underlying star formation efficiencies, density-size hierarchies, and examine the species best suited for tracing the true star forming phase.
The paper is outlined as follows: observations and results are described in §2 and 3, respectively. §4 details the analysis of our observations, which includes deriving dense gas mass and star formation efficiencies based on the radiative transfer modeling of the observed lines. In §5 we discuss the implications of our findings in the context of upcoming missions such as Herschel. In the flat cosmology (, , and km s-1 Mpc-3 – Spergel et al. 2003) adopted throughout this paper the luminosity distances to Arp 220 and NGC 6240 are 77.5 and 105.5 Mpc, respectively.
2 Observations
The 15-m James Clerk Maxwell Telescope111The JCMT is operated by the Joint Astronomy Centre on behalf of the United Kingdom Particle Physics and Astronomy Research Council (PPARC), the Netherlands Organisation for Scientific Research, and the National Research Council of Canada. (JCMT) on Mauna Kea, Hawaii was used to observe a number of 12CO, 13CO, HCN, CS, and HCO+ lines in Arp 220 and NGC 6240 (Table 1). These observations were done in good () to medium () weather conditions during several runs on the JCMT between January 2003 and December 2004. The two JCMT receivers (211-279 GHz) and (312-370 GHz) were employed in order to observe all the lines, with the receiver tuned in SSB mode. In order to ensure baselines as flat as possible, the observations were done in fast beam-switching mode with a chop throw of (AZ) and a chopping frequency of 1 Hz. As backend we used the Digital Autocorrelation Spectrometer (DAS) in its widest, GHz ( km s-1 for the B3 receiver) mode to cover the full velocity-width of the expected broad lines. The pointing was checked every 1-2 hr throughout each observing run and was (rms) or better. Aperture and main beam efficiencies were derived from observations of Mars and Uranus throughout the observing runs and were compared to mean JCMT values over for the observing periods. There is excellent agreement between the two sets of values so we adopt the latter under the assumption the mean values carry less inherent uncertainty than single measurements. The details of the observations, such as beam sizes, line frequencies, system temperatures and total on-source integration times, are summarized in Table 1.
The HCN 1–0 and 13CO 2–1 lines were observed with the IRAM 30-m telescope on Pico Veleta (Spain) in June 2006 as part of a larger molecular line survey of LIRGs (Papadopoulos et al. 2007a). Each line was observed simultaneously in two polarizations using a pair of SIS receivers. The 3 mm A100/B100 receivers were used for the HCN 1–0 line in conjunction with two 1 MHz filter banks, each with 512 channels and a channel separation of km s-1 at the observed frequency of 87 GHz. For the 13CO 2–1 line, we used the 1 mm A230/B230 receivers together with the two wide 4 MHz filter banks, each with 1 GHz bandpass and a channel separation of km s-1 at the observed frequency of 216.5 GHz. The beam size of the 30-m telescope is 28′′at 115 GHz and 12′′at 217 GHz. The data were acquired with the New Control System (NCS) in series of four minute scans, each comprised of eight 30 s sub-scans. Total integration times were 1.2 hours for Arp 220 and almost 2 hours for NGC 6240 in HCN 1–0 and 13CO 2–1 (Table 1). To obtain the flattest possible baselines, the wobbler switching (nutating subreflector) observing mode was employed with a frequency of 0.5 Hz and beam throws of . Both targets were observed under good weather conditions in the late night hours with K at 3 mm and K at 1 mm on the antenna temperature () scale. Pointing and focus were checked frequently throughout observations, and the pointing errors were found to be (rms).
Finally, we present previously unpublished observations of Arp 220 obtained with the IRAM 30-m during the period 1988-1992. These data include 13CO 1–0, CS 2–1, 3–2, C18O 1–0, and HNC 1–0, the isomer of HCN. For these observations, SIS receivers were used together with the spectrometers. The observations were done with a wobbler switching of 180-240′′ in azimuth. The data were calibrated with cold and ambient loads and, depending on frequency and weather, single sideband temperatures were 200-600 K. The pointing, checked with planets and quasars on a regular basis, was (rms).
The spectra of all the molecular lines observed in Arp 220 and NGC 6240 as part of this study are shown in Fig. 1 and 2, respectively. The spectra have been plotted on the temperature scale, i.e., the antenna temperature corrected for atmospheric absorption and rearward spillover (Kutner & Ulich 1981). The velocity-integrated line flux densities were estimated using
| (1) | |||||
| (2) |
where is the aperture efficiency, the telescope diameter, and Boltzmann’s constant (Gordon, Baars & Cocke 1992). We find for the JCMT and for the IRAM 30-m Telescope. is the baseline subtracted spectrum, and (where =source diameter) accounts for the coupling of the gaussian part of the beam with a finite-sized, disk-like source. Interferometric observations have shown that the CO emitting regions in Arp 220 and NGC 6240 are in angular diameter (Tacconi et al. 1999; Scoville et al. 1997). Our line observations collect, therefore, all the flux, with minimal dependence on , which is at most for the highest frequency (and thus smallest beam) observations reported here.
All of the measured line fluxes along with their errors are tabulated in Table 3. The errors include thermal and calibration errors, as well as errors on the assumed aperture efficiencies. Each of these are assumed to be uncorrelated and thus added in quadrature. The latter two sources of error were found to contribute by no more than 10 per-cent each, while the thermal noise was calculated for each line using:
| (3) |
where is the number of channels across the line, is the number of channels (each wide) used to estimate the baseline level, and is the channel-to-channel rms noise, assumed to be uniform across the spectrum.
2.1 Calibration issues with the A3 receiver
At GHz the receiver on the JCMT may present a calibration problem that has to do with the fact that the sideband ratio in this Double Sideband (DSB) receiver is not unity but can vary as a function of the LO frequency. This may have affected our HCN 3–2 measurements, which we now reduce separately for each sideband, and intend to correct properly before co-adding.
In the standard calibration the raw normalized spectrum is scaled by , where ( for DSB mode) is the ratio of the image and signal sideband gains, and depends on the mean atmospheric and telescope cabin temperatures, the telescope transmission efficiency, and the line-of-sight optical depth (see Eq. A12 of Kutner & Ulich 1981). The first step for reducing spectra for which is to divide the spectra by 2 in order to undo the standard online calibration. Next, the LSB and USB tuned spectra were averaged and corrected separately using the dependence given on the JCMT website222http://www.jach.hawaii.edu/JCMT/spectral_line/Instrument_homes/RxA3i/sidebands.html, which for for the HCN 3–2 line yielded . Finally, the resulting corrected spectra were co-added.
3 Results
In this section we describe the new transitions observed in Arp 220 and NGC 6240 as part of this study, along with previously detected transitions that we have re-observed. In order to compare the line strengths not only between the two galaxies but also between different transitions within the same system, we have calculated velocity-integrated line luminosities for all of the observed transitions. These were calculated using
| (4) |
(Solomon, Downes & Radford 1992b). The resulting line luminosities calculated in this manner are tabulated in Table 3.
3.1 Arp 220
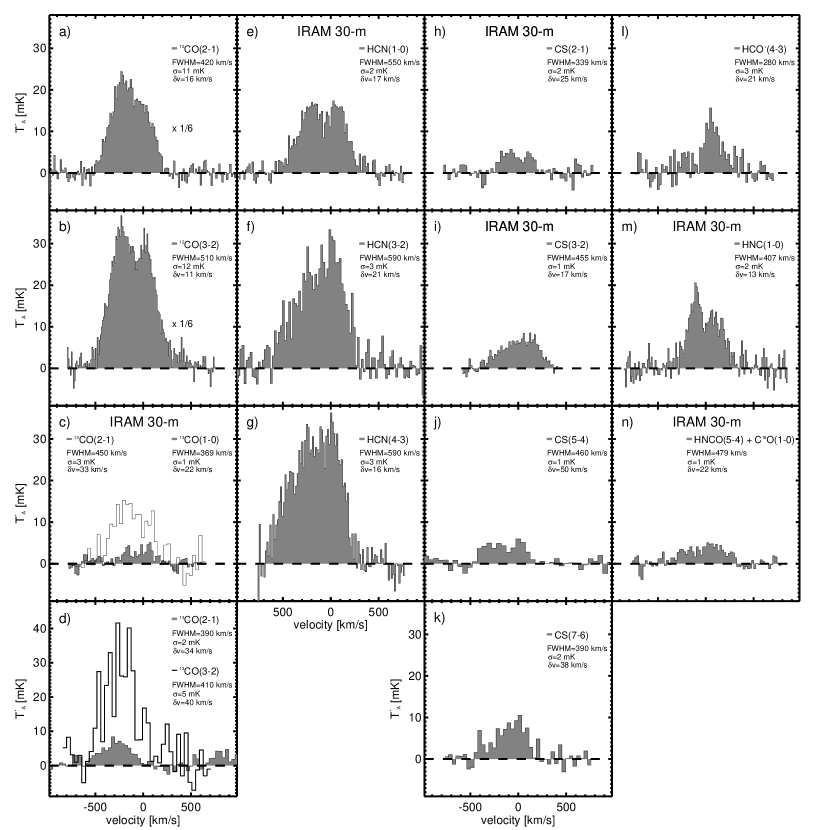
In Arp 220, high-resolution interferometric observations have revealed the double-horn profiles of the 12CO 1–0 and 2–1 lines (Scoville et al. 1991) to originate from two nuclei embedded within a circumnuclear ring or disk (Scoville et al. 1997; Downes & Solomon 1998). We see the same line profile in our 12CO 2–1 spectrum (Fig. 1a), with a strong emission peak at km s-1 (relative to ) and a less intense peak at km s-1. These two peaks correspond, respectively, to the western, blueshifted nucleus and to the eastern, redshifted nucleus in the molecular disk (Downes & Solomon 1998). Our 12CO 3–2 line, single-dish spectrum show a double-horn profile similar to the lower transitions (Lisenfeld et al. 1996; Mauersberger et al. 1999).
One subtle difference exists however, and is confirmed by our own 12CO 3–2 spectrum (Fig. 1b). The relative strength of the peak at km s-1 is greater in the 3–2 line than in the 1–0 and 2–1 spectra. In the 3–2 spectrum the western component is only slightly stronger than the eastern. Recent interferometric observations with the Submillimeter Array (SMA) showed that the CO 3–2 and the 890-m dust emission is indeed strongest in the western nucleus (Sakamoto et al. 2008).
The 13CO lines observed in Arp 220 with the IRAM 30-m and the JCMT are shown in Fig. 1c and d, respectively. Although the 13CO lines seem somewhat narrower than their 12CO counterparts, this may be simply an effect of the low signal-to-noise ratio in the line wings and the uncertain baseline level. In general all the 12CO and 13CO lines seem to have very similar line profiles, within the available signal-to-noise. Both the 13CO 1–0 and 2–1 spectra observed with the IRAM 30-m show tentative evidence of double peaks, consistent with the 12CO lines. In the 1–0 spectrum, both peaks are equally strong, whereas the peak at is stronger in the 2–1 spectrum. This also appears to be the case in the 2–1 and 3–2 spectra observed with the JCMT (Fig. 1d), although we note the 3–2 spectrum in particular is very noisy. The fact the 13CO 2–1 spectra obtained with the two telescopes are in agreement in terms of line shape as well as flux density gives us confidence our observations are able to robustly discern the line shapes of even faint lines like 13CO 2–1.
The HCN 1–0, 3–2, and 4–3 spectra observed in Arp 220 are shown in Fig. 1e-g, respectively. The HCN 1–0 spectrum shows a clear double-horn profile similar to 12CO 3–2, with equally strong peaks. The HCN 3–2 and 4–3 line profiles are both very broad (fwhm km s-1) and share the same overall shape. They both show evidence of double peaks with the km s-1 component being more prominent. The shape is unlike the HCN(1–0) spectrum – as well as the 12CO 2–1 and 3–2 spectra – where the km s-1 component is brighter.
The CS lines – of which only CS 3–2 has been previously reported for Arp 220 – trace a much overlaping excitation range with that of HCN (see Table 6), and are shown in Fig. 1h-k. All CS lines have double-horn profiles, with the km s-1 peak stronger in the CS 3–2, 5–4, and 7–6 spectra, while the two peaks are almost the same strength in the 2–1 spectrum. This mimicks the observed evolution from low- to high- in the HCN line profiles. We note, however, the apparent asymmetry of the CS 3–2 line may be an artifact of the limited receiver bandwidth. In determining the baseline, we forced the right edge of this spectrum to zero, so our line flux estimate for this line is likely an underestimate.
Finally, in the last column of Fig. 1, we show the HCO+ 4–3, HNC 1–0, and the blended C18O 1–0 and HNCO 50,5–40,4 lines. Similarly to the HCN and CS lines, the HCO+ spectrum peaks at km s-1, and shows some faint emission at km s-1, which corresponds to the stronger 12CO feature. In this respect, the HCO+ spectrum looks similar to CS 7–6, where the western component is almost completely quenched. In stark contrast to this, the double-horn spectrum of HNC 1–0 shows a remarkably strong emission peak at km s-1, suggesting a substantial fraction of the HNC is concentrated in the western nucleus. The blended C18O 1–0 and HNCO 50,5–40,4 spectrum is shown in Fig. 1n. In order to determine separate parameters for C18O 1–0 and HNCO 50,5–40,4, two gaussian components with the same width and fixed separation were fitted. From the resulting intensities we calculated integrated line fluxes and luminosities (Table 3).
It is telling that the double-horn structure seen in the low- 12CO spectra is also discernible in the high- spectra of HCN, CS, and HCO+, albeit with the relative strengths of the two peaks reversed. In fact, a rather clear trend is apparent: the km s-1 peak is stronger in the 12CO 2–1 spectrum, the peaks are about equally strong in the 12CO 3–2 and HCN 1–0 profiles, and the km s-1 peak is stronger in the HCN 3–2 and 4–3 spectra. Thus, as we climb the -ladder and probe higher and higher critical densities, the strength of the emission shifts from the western to the eastern nucleus. This picture is confirmed by the CS 7–6, and HCO+ 4–3 spectra which have even higher critical densities than the HCN 1–0 line and are completely dominated by the km s-1 component with very little or no emission at all at km s-1.
An important point to make here is that it is only due to the high-density gas tracers such as HCO+, HCN and CS that we are able to conclude that the eastern nucleus harbours most of the dense gas. Without those, we would have been inclined to conclude, based on the CO 3–2 spectrum (Fig. 1b) and its distribution (Sakamoto et al. 2008), that most of the dense gas was contained in the western component.
Given the modest (yet real) differences of the relative line strengths across the velocity range of Arp 220, and for reasons of simplicity and straightforward comparison to NGC 6240, we decided to use the line intensities average over its entire profile and the associated line ratios in our susbesquent analysis (§4).
3.2 NGC 6240
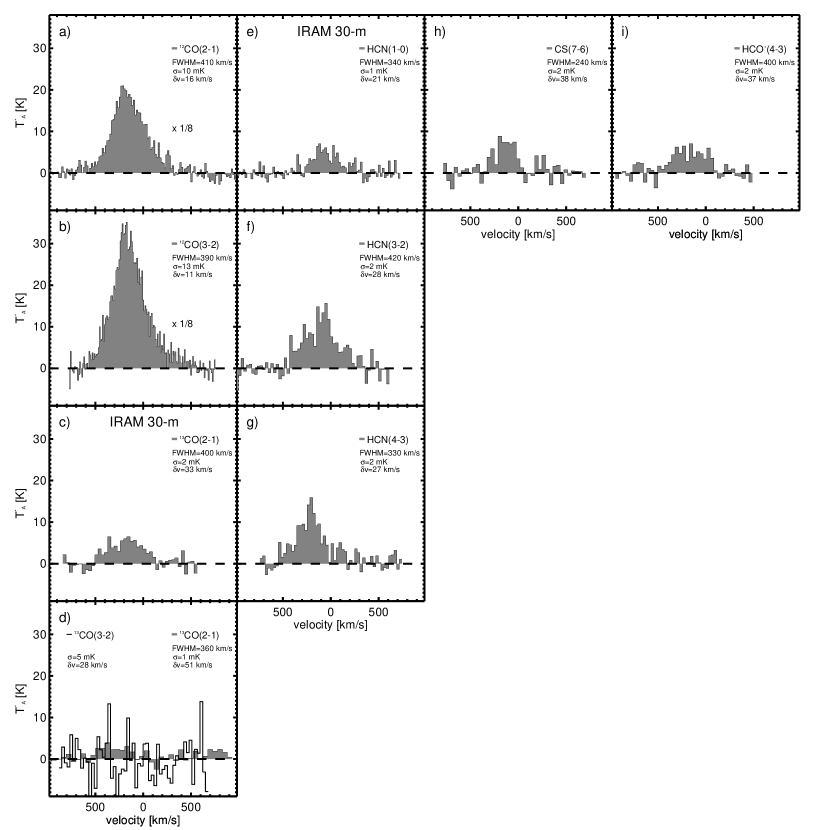
The 12CO 2–1 and 3–2 spectra of NGC 6240 are shown in Fig. 2a and b, respectively. Unlike Arp 220, the 12CO 3–2 and 2–1 spectra in NGC 6240 have almost identical shapes, with spectra having a single-peaked profile, skewed towards the blue ( km s-1 relative to ). This is consistent with high-resolution interferometric observations of low- 12CO lines in the inner regions of NGC 6240, which suggest more than half of the molecular gas resides in a central structure dominated by turbulent flows, rather than systematic orbital motion (Tacconi et al. 1999). The 13CO 2–1 spectra obtained with the JCMT and IRAM 30-m are shown in Fig. 2c and d, respectively, and both appear similar in shape to their 12CO counterparts. Unfortunately, we cannot compare the 13CO 3–2 spectrum (Fig. 2d) as no obvious detection of this transition was made. We are able, however, to set a sensitive upper limit on its integrated flux (Table 3).
The HCN 1–0, 3–2, and 4–3 transitions observed in NGC 6240 are shown in Fig. 2e-g. Although the HCN 1–0 line has previously been detected (Solomon, Downes & Radford 1992a; Tacconi et al. 1999; Nakanishi et al. 2005), this is the first time the 3–2 and 4–3 transitions have been detected in this galaxy. All three HCN lines peak at km s-1 and are consistent with the CO line profiles.
Unlike Arp 220, where several CS lines were observed, only the 7–6 line was observed in NGC 6240 due to limited observing time. The spectrum is shown in Fig. 2h. This is the only detection of CS in NGC 6240 to date and the line profile is consistent with those of CO and HCN.
Finally, the HCO+ 4–3 spectrum observed in NGC 6240 is shown in Fig. 2i. The HCO+ 4–3 line profile is in good agreement with the 1–0 line (Nakanishi et al. 2005) and is consistent with a single peak at km s-1.
In summary, all of the transitions detected in NGC 6240 exhibit a similar, Gaussian-like velocity profile, peaking at about the same velocity (km s-1), in contrast to Arp 220 where all the lines not only show a double-peaked profile but a strong evolution in the dominant peak is also discernible. The similar velocity profile over such a large range of densities probed in NGC 6240 signifies a kinematical state of the molecular gas where the various phases remain well-mixed down to much smaller scales than in Arp 220 where the denser phases seem settled to two counter-rotating dense gas disks, enveloped by a much more diffuse CO-bright gas phase. Sub-arcsec interferometric imaging of the HCN, CS and HCO+ imaging of these systems is valuable in confirming such a picture, a possible result of the different merger state of these two strongly interacting systems.
3.3 Literature data
A major goal of this study was to use our observations as well as results from the literature to compile a large, identical molecular line catalog for Arp 220 and NGC 6240. Thus the literature was scanned for all relevant molecular line measurements and for each transition the weighted average of every independent flux measurement was calculated. In cases where a measurement deviated significantly from the mean for obvious reasons (limited bandwidth, poor conditions, etc.), it was discarded from the average. Note that often in the literature line measurements are given only in (main beam or antenna) temperature units and only rarely in Janskys. In those cases, we used the aperture and/or main beam efficiencies quoted in the paper or, if those were not given, the average values for the particular telescope (typically tabulated in the observing manual). The final tally of lines is given in Table 3 along with their corresponding fluxes and global line luminosities. Global line ratios were calculated as the velocity/area averaged brightness temperature ratios (equivalent to taking the ratio of the line luminosities) and are listed in Tables 4 and 5.
Our observations of 12CO 2–1 in both Arp 220 and NGC 6240 yield somewhat higher line fluxes than previous single-dish and interferometry observations listed in Table 3, although, we note that Wiedner et al. (2002) using the JCMT measured an even larger line flux in Arp 220 than ours. A careful scrutiny of the individual sub-scans in our data and of the calibration on the dates the observations were made revealed nothing out of the ordinary. In fact, given that each source was observed on different nights, yet both have per cent higher line fluxes than previously published values, suggest that the offset may well be real. A close inspection of previously published 12CO 2–1 spectra reveals they all suffer from either limited bandwidth (the case for single-dish measurements), and/or the sources have been over-resolved spatially (in the case of interferometric observations). Because only few observations favor the higher 12CO 2–1 fluxes in Arp 220 and NGC 6240, however, we conservatively adopt the mean flux value of all available measurements for our analysis. The HCN 4–3 line in Arp 220 was first observed by Wiedner et al. (2002), who found a line flux only half as large as ours. Here, we adopt our own measurement since our spectrum has a higher signal-to-noise ratio than that of Wiedner et al. (2002), and the latter used aperture efficiencies which deviate significantly from the standard values given for JCMT.
In NGC 6240 we find a HCN 1–0 flux that is half the previously published single-dish measurement (Solomon, Downes & Radford 1992a) but is in excellent agreement with the infererometric measurement by Nakanishi et al. (2005). Because our data were obtained over the course of two days in excellent weather conditions and because a careful reduction of the data from each day separately yielded consistent results, we find the lower values more likely. In the case of Arp 220, our estimate of the HCN 1–0 line flux is about 35 per cent larger than that of Solomon, Downes & Radford (1992a), which is just within the errors. Recent, independent observations of the HCN 1–0 line in Arp 220 and NGC 6240 with the IRAM 30-m Telescope yield line fluxes in agreement with our measurements (Graciá-Carpio private communications), suggesting the HCN 1–0 line fluxes given by Solomon, Downes & Radford (1992a) may have been affected by systematic calibration uncertainties. Nonetheless, for the line ratio analysis in this paper, we conservatively adopt the weighted average of all three HCN 1–0 measurements in these two systems.
We end this section by noting that Table 3 constitutes the most extensive molecular line catalog available for any (U)LIRG. In terms of extragalactic objects in general, it is matched only by data published for the much less extreme starburst galaxies M 82 and NGC 253 (e.g., Weiß et al. 2005; Seaquist et al. 2006; Bayet et al. 2004; Bradford et al. 2003). However, unlike M 82 and NGC 253, where only the 12CO 1–0 and 2–1 transitions have been observed over their entire extent (e.g. Weiß, Walter & Scoville 2005), our study picks up the global emission from Arp 220 and NGC 6240 for all transitions, allowing for an unbiased study of the properties of their entire molecular gas reservoir using the corresponding mm/sub-mm line ratios. This mirrors observations of the mm/sub-mm lines observed in high- starbursts where much fewer lines are available, and thus cannot yield meaningful constraints on the conditions or the mass per gas phase for their molecular gas reservoirs.
4 Analysis
The first indication that the molecular ISM in extreme starburst galaxies is fundamentally different from that of normal galaxies came from the observation that the former have much larger 12COCO line ratios (e.g. Casoli, Dupraz & Combes 1992). These are almost exclusively observed in ULIRGs and were interpreted as either due to missing 13CO caused by a top-heavy initial mass function in these extreme systems (Casoli, Dupraz & Combes 1992) or due to purely optical depth effects (i.e., low 12CO optical depths) caused by a warm and highly turbulent H2 medium present in these objects (Aalto et al. 1995). Then the bulk of the 12CO emission arises from a diffuse enveloping phase where 12CO has low to moderate optical depths (), and the large 12CO/13CO ratios are due to 13CO-bright gas with a much a smaller filling factor than the diffuse 12CO-bright phase.
It is instructive to examine how far a single gas phase can go in terms of explaining the observed line ratios in Arp 220 and NGC 6240 before the fit becomes inadequate and a second gas phase must be introduced. To this end we employ a Large Velocity Gradient (LVG) model based on the work by Richardson (1985), which uses the observed CO line ratios to constrain the gas density (), kinetic temperature (), and , which is the CO abundance relative to H2 divided by the cloud velocity gradient. The models span cm-3 (in steps of ), K (in steps of 5 K), and (in steps of ). The model adopts the CO-H2 collisional rate constants from Flower & Launay (1985), and included all rotational levels up to for kinetic temperatures of 10, 20, 40, 60, and 100 K were included. Collision rates for intermediate kinetic temperatures were estimated by interpolation. Finally, because the assumed 12COCO abundance ratio can be important for whether a fit converges or not, we considered models with abundance ratios of 40, 60, and 100, values that span those found in the Milky Way (Langer & Penzias 1993).
The need for a two-phase molecular ISM is perhaps most obvious in Arp 220, where no single LVG solution can account for even the 12CO 1–0, 2–1, and 3–2 lines. In this system we have the interesting situation where the ratio CO (2–1)/(1–0) points towards sub-thermal excitation of even 12CO 2–1 () where typically and K fits such a ratio well (for LTE such a low ratio implies K the minimum gas temperature permitted by cosmic-ray heating, Goldsmith & Langer 1978). Such conditions cannot reproduce the observed CO(3–2)/(1–0) which indicates much more excited gas with density and kinetic temperature K. Going ahead to searcg for a LVG solution constrained by the 12CO 1–0, 2–1, 3–2 and just one 13CO line strength, the J=1–0 lines, yields predictably a much worse solution given by and K. Aside from poorly reproducing the aforementioned line ratios, barely satisfying the criterion for these galaxies (see 4.2), such a gas phase corresponds to brightness temperature 13CO (2–1)/(1–0), (3–2)/(1–0) ratios of and , in sharp contrast to the observed ones of and respectively.
In the case of NGC 6240, both and ratios indicate higly excited gas with a typical gas phase model of and K, that can also fit the observed large J=1–0 12CO/13CO ratio (). Nevertheless this solution fails dramatically for the J=2–1, J=3–2 12CO/13CO line ratios where it yields , much lower than the observed values (Table 4), even for the largest plausible abundance of [12COCO]. This could not have been found without our sensitive 13CO 2–1 and 3–2 measurements, which in the case of NGC 6240, have pushed the and ratios to the highest such values reported in the literature.
Finally, using different abundance ratios namely , encompasing the range deduced for the Milky Way (Langer & Penzias 1993; Casassus, Stahl & Wilson 2005) we still find no single set of average molecular gas physical conditions that comes even close in reproducing the 12CO and the 13CO line ratios in either galaxy.
4.1 C18O emission and the opacity of the 13CO lines
The emergence of 13CO transitions as the first ones marking a strong deviation from any single gas phase reproducing the relative strengths of the 12CO transitions is further highlighted in the case of Arp 220 by the observed strong C18O J=1–0 line emission. There the C18OCO 1–0 line ratio of is the highest such ratio obtained over an entire galaxy – – by comparison, Papadopoulos, Seaquist & Scoville (1996) measure such high values towards only a few of the brightest GMCs in NGC 1068. Assuming the low abundance of found for the Milky Way (Langer & Penzias 1993) such high C18OCO brightness ratios argue for much of the 13CO J=1–0 emission emerging from a phase where , sharply deviating from the optical thin transitions deduced from the LVG of only the 12CO, 13CO transitions described in the previous section. A much denser gas phase can naturally yield the significantly higher optical depths needed to explain the high C18OCO J=1–0 ratio.
4.2 The properties of the dense molecular gas
In this section we use the many transitions of HCN, CS, and HCO+ in our catalog – probing a wide range of critical densities and excitation temperatures in a redundant manner (see Table 6) – to constrain the properties of the dense gas phase.
In order to model the radiative transfer of these lines, we constructed a modified version of the original LVG code. The modifications were straightforward since HCN, CS, and HCO+ are simple linear molecules like CO. For HCN, CS, and HCO+, the collision rate constants provided by Green & Thaddeus (1974), Turner et al. (1992), and Flower (1999) were adopted. We explored a similar density range as we did for the CO lines, but limited the temperature range to K. The lower limit set by the dust temperature (), reflects the fact that the dust and gas are thermally de-coupled, with the FUV-induced photoelectric and turbulent gas heating (and its cooling via spectral line rather than continuum emission) setting . Only in the densest, most FUV-shielded and quiescent regions of the GMCs can we expect . The upper limit is the typical equilibrium temperature of purely atomic, C+-cooled HI in the cold neutral medium (e.g. Wolfire et al. 2003). Based on detailed fits to their FIR/sub-mm SEDs (Dopita et al. 2005), we adopted a dust temperature of K for both Arp 220 and NGC 6240. Since the molecules have different abundances, the range in is also different for a common velocity gradient (). In our own Galaxy, typical abundances are (Bergin, Snell & Goldsmith 1996; Lahuis & van Dishoeck 2000), (Paglione et al. 1995; Shirley et al. 2003) and (Jansen 1995). In order to accommodate the substantial uncertainties associated with the abundances, the range of used was , , and for HCN, CS, and HCO+, respectively. These correspond to velocity-gradients in the range km s-1 pc-1 for the abundances quoted above.
In the case of Arp 220, the observed HCN ratios are consistent with LVG solutions in the range , and , for which . From the fit of the CS lines we find , and . Finally, the subthermal HCO+ ratios allow for solutions in the range , and . All the aforementioned solutions are for K and their details are shown in Table 7. There it can be seen that while HCN, CS, and HCO+ all trace what in broad terms can be characterized as dense gas (i.e., ), with the density range of the CS and HCN solutions being very similar. Moreover we find the CS and HCN emission tracing gas with densities higher than that traced by the HCO+ lines. This simply reflects the high HCN, CS and the low HCO+ line ratios measured in Arp 220, further reinforced by the times lower critical densities of the HCO+ transitions than e.g those of HCN at the same rotational level (see Table 6). These results are certainly consistent with Galactic surveys of CS lines, which have shown they are unmistakable markers of very dense, high-mass star forming cores (Plume et al. 1997; Shirley et al. 2003).
For NGC 6240, the HCN LVG fits converge mostly over , K, and , with an optically thick HCN J=1–0 line (). From the HCO+ lines we find solutions in the range , K, and . Thus in NGC 6240, as in Arp 220, HCN is tracing gas which is significantly denser than that traced by HCO+, over a similar range of temperatures.
In an attempt to “break” the significant degeneracy that still exists in the LVG solutions for the dense gas we make use of the fact that at least in the Galaxy, most of the dense star-forming gas is found in self-gravitating cores (Shirley et al. 2003). In the cases of Arp 220 and NGC 6240, we use this to try and limit the allowed (, , )-parameter space by examining the ratio of the velocity gradient infered from the LVG fits to that expected for virialized cores, namely
| (5) |
where [XH2] is the abundance ratio of the given molecule X (see Papadopoulos & Seaquist 1999, or Goldsmith 2001 for a derivation), and is a constant whose value depends on the assumed density profile of a typical cloud (Bryant & Scoville 1996).
For virialized gas we expect to within a factor of a few (due to uncertainties in cloud geometry, density profile, and abundance assumed to deduce the observed from ). LVG solutions that correspond to indicate non-virial, unbound motions and are ruled out for dense star-forming gas along with those that have (gas motions cannot be slower than those dictated by its self-gravity). For Arp 220 and Table 7 we see that for both HCO+ and HCN, LVG solutions with K have , and thus this conditions does not single out any particular range of solutions. For CS however, we find for most solutions except for K, and . This suggests that the true CS abundance may be significantly higher than assumed (by at least an order of magnitude). Finally for NGC 6240 all solutions that fit the HCO+ ratios are consistent with , while for HCN this is the case for K and cm-3 and km spc (see Table 7).
4.2.1 HNC vs. HCN
Observations of HCN and HNC in Galactic GMCs (Goldsmith et al. 1981), as well as steady state chemical models (Schilke et al. 1992), predict an increase in the HCN/HNC abundance ratio with increasing temperature and density, and attribute this to the destruction of HNC (but not HCN) via neutral-neutral reactions with atomic oxygen or hydrogen. Then, at densities , temperature-independent ion-neutral reactions, which form HCN and HNC in equal amounts, may become dominant (Schilke et al. 1992; Aalto et al. 2002), and as a result the HNC abundance can be substantial. However, given the high optical depths implied for the HCN J=1–0 transition from our excitation analysis of the HCN line ratios, no useful limits can be placed on the abundance ratio from the observed brightness temperarure ratio of measured for their J=1–0 transition in Arp 220 (consistent with both lines being optically thick). For a comparative analysis of HCN versus HNC excitation using several rotational transitions, and the diagnostic nature of the abundance ratio for the excitation environment of ULIRGs the interested reader is referred to recent work by Aalto et al. (2007).
4.3 Sub-thermal HCO+ line excitation: HCO+ as dense gas mass tracer
In both galaxies the low HCO+ line ratios result in LVG solutions with densities mostly times lower than those deduced from the analysis of the HCN ratios (Table 7). Thus if only HCO+ line observations were used, they would imply a bulk dense gas phase dominated by less extreme densities than is actually the case, especially in Arp 220. The several HCO+ and HCN transitions observed, and the independent analysis afforded by the CS transitions (for Arp 220), make it unlikely that the aforementioned conclusions can be attributed to enhanced HCN abundances (and thus thermalization of its transitions at lower densities because of radiative trapping) caused by XDRs, or simply to IR-pumping of HCN J=1–0. Thus recent claims that HCO+ is a better tracer of the dense gas in (U)LIRGs than HCN (Graciá-Carpio et al. 2006), do not seem to hold in the cases of Arp 220 and NGC 6240, and a more comprehensive approach is needed to decide the case (Papadopoulos 2007b).
4.4 The mass of the dense gas phase in Arp 220 and NGC 6240
In this section we make use of the constraints on the dense gas in Arp 220 and NGC 6240 obtained in §4.2 to derive the total mass of the dense gas in these two systems. We do this using two different methods, the results of which are summarized in Table 8. The first one assumes the dense gas reservoir to be fully reducible to an ensemble of self-gravitating units whose molecular line emission does not suffer any serious cloud-cloud shielding. Then it can be shown (e.g. Dickman, Snell, & Schloerb 1986) that the total mass of e.g. an HCN-luminous dense gas phase can be found from
| (6) |
where is a conversion factor (e.g. Radford, Solomon & Downes 1991a). We insert the range of and values inferred from the LVG solutions to the HCN line ratios, which for Arp 220 are and K, and for NGC 6240 and K. From these values we find: and for Arp 220 and NGC 6240, which in turn yields dense gas mass traced by HCN of and for these two systems respectively.
In a similar fashion, the analysis of HCO+ and CS line ratios with their corresponding and values yields corresponding conversion factors which, along with the luminosities of the lowest HCO+ and CS transitions available, yield the dense gas mass traced by each species (Table 8). The constraints of an underlying density-size cloud hierarchy (see section 4.5) demand (since the HCN, CS lines are tracing a denser gas than those of HCO+). Thus from Table 8 we obtain (Arp 220) and (NGC 6240) as the best dense gas mass estimates conforming to the aforementioned inequality. Systematic biases can be introduced by a) the lack of a pressure-term in eq. 6 correcting for molecular gas overlying the dense gas regions, b) by the existence of substantial stellar mass even within the dense gas phase. In both of these cases the true conversion factor and the deduced gas masses will be lower (see Bryant & Scoville 1996; Downes & Solomon 1998 for the appropriate formalism).
Finally, given the significant number of HCN transition available for both systems, we can estimate the dense gas mass by assuming the bulk of the HCN molecules are in rotational states . Then
| (7) |
where is the total number of HCN molecules in state and accounts for He. The HCN population numbers are calculated from
| (8) |
where and are the Einstein coefficient and the escape probability for the transition, respectively. Unlike the first method this approach depends directly one the assumed abundance ratio while it is in principle independent of any assumptions regarding the velocity field of the dense gas phase (i.e. it remains valid for a non-virialized, unbound gas phase), as long as the HCN line emission remains effectively optically thin (i.e. any large ’s emerge within small gas “cells”). The dense gas masses estimated with the second method (see Table 8) bracket the best estimates yielded by the first one (constrained by the density-mass hierarchy assumtion), though more tightly for Arp 220 than NGC 6240.
The two methods overlap over the same range of for both galaxies, which is comparable to the total molecular gas mass estimated independently from models of their interferometrically imaged CO emission (Downes & Solomon 1998), or their CI J=1–0 fluxes (Papadopoulos & Greve 2004). Thus the bulk of the molecular ISM in these two extreme starbursts is in a dense state with .
It is worth comparing this mass to the fundamental upper limit set by the dynamical mass in these objects. For Arp 220, the latter was estimated to be (adopted to the cosmology used here) within a radius of 1.4 kpc, based on resolved observations of CO (Downes & Solomon 1998). For NGC 6240 within a radius of pc (Tacconi et al. 1999; Bryant & Scoville 1999). The CO emitting region in NGC 6240 extends significantly beyond that (Tacconi et al. 1999) and thus a significant amount of molecular gas may reside beyond the inner 500 pc. Assuming a constant rotation curve, we obtain an upper limit of within kpc for NGC 6240. Since any HCN/CS/HCO+ bright region will be contained within the CO-bright regions we expect in both systems. Thus the range of corresponds to of the dynamical mass in Arp 220, and up to 100% for NGC 6240.
4.5 The density-size relation for the dense gas: steeper than Larson’s law?
In this section we attempt to go a step beyond using HCO+, HCN, and CS lines as isolated estimators of the dense gas mass by assuming their emission emerging from an underlying density-size hierarchy, found for Galactic molecular clouds by Larson (1981), and verified by subsequent high-resolution multi-transition studies. The origin of the density-size and linewidth-size power laws revealed for GMCs in the Galaxy may lie in the characteristics of supersonic turbulence and its global driving mechanisms (Heyer & Brunt 2004) when present on self-gravitating structures. As such they may remain similar even in the extreme ISM conditions present in ULIRGs.
A rigorous approach to test this in extragalactic environments (where molecular clouds cannot be viewed with the same level of detail) using the global molecular line emission of various species would require incorporating such power laws in the radiative transfer model used to interpret the emergent molecular line emission. In our case we opt for a simpler approach in which the denser HCN-bright gas is simply assumed to be “nested” within the less dense regions traced by the HCO+ transitions.
We can rudimentary test for this by deriving the velocity-averaged area filling factor of the HCN-bright relative to the HCO+-bright gas phase: , which ought to be . This can be found from
| (9) |
For the LVG solution ranges above (Table 7) and the J=1–0 transition of both species, the observed line luminosities and LVG-deduced intrinsic brightness temperatures yield: (Arp 220) and (NGC 6240). For an underlying density-size power law , we set as an approximation (, are the mean volume densities deduced from the LVG fits of the HCN and HCO+ line ratios). For the range of densities corresponding to LVG fits of the HCN and HCO+ ratios (for ), we find , steeper than the value of typical for Galactic molecular clouds. Using the HCO+ and HCN J=4–3 transitions instead yields (Arp 220), and (NGC6240). These smaller values are expected for emission from the two lines bracketing the entire range critical densities in our line inventory (Table 6), and an underlying density-size ISM hierarchical structure. However, even for these values of the corresponding density ranges yield , still steeper than a Larson-type power law. Such a steepening could in principle be the result of extreme tidal stripping of GMCs and then merging of the surviving densest clumps to super-dense structures, yet another signature of vastly different average molecular gas properties in extreme starbursts than those in more quiescent environments.
4.6 The diffuse gas phase
The observed 12CO line emission will have contributions from both the dense and diffuse gas and the observed global line ratio of any given line with respect to 12CO 1–0 can therefore be written as
| (10) |
where is the line ratio for the diffuse phase (denoted by A), the one for the dense phase (denoted by B), and the contrast factor, is discussed below. It is seen from eq. 10 that in order to constrain the properties of the diffuse gas, one has to determine and subtract the contribution from the dense gas phase. Fortunately, this can now be done with the constraints put on the dense phase properties in §4.2. The contrast factor, which determines the relative emission contribution of the two gas phases, is given by , where is the velocity-integrated relative filling factor between the two phases and are the velocity- and area-integrated line brightness temperatures of 12CO 1–0. In order to determine this quantity, we make the reasonable assumption that the HCN emission is dominated by the dense gas phase and, as a result, we can write the global (observed) HCN(1–0)/12CO(1–0) line ratio as
| (11) |
We then estimate using the observed value of and the values obtained from the LVG fits of the dense gas phase. The observed global line ratio for Arp 220 is , and as estimated from the dense gas solution range. In the case of NGC 6240 the same two line ratios are and . Folding in the uncertainties on the observed global ratios and allowing for the range in the ratio predicted for the dense gas, we find (Arp 220) and (NGC 6240).
With determined, we can then disentangle the contributions to the 12CO line ratios from the diffuse and dense phases using Eqs 10. If we assume the ratios dominated by the diffuse phase, the resulting 12CO and 13CO emission line ratios for Arp 220 are consistent with cm -3, K, and . For NGC 6240, the LVG model converges on cm -3 K, and . All solutions correspond to non-virialized values (assuming a Galactic abundance [CO/H2]) and have moderate 12CO J=1–0 optical depths (). This seems to be the typical diffuse gas phase found in such systems (e.g. Aalto et al. 1995; Downes & Solomon 1998) which, while dominating their low-J CO line emission, it does not contain much of their total molecular gas mass.
5 Dense gas mass, star formation, and its efficiency in Arp 220 and NGC 6240
The dense gas masses derived for Arp 220 and NGC 6240 in §4.4, allow us to derive accurate star formation efficiencies in these two galaxies. Although the star formation efficiency (SFE) was originally defined as , where SFR is the star formation rate and is the total molecular gas mass, we shall here focus on the SFE per dense gas mass, with the SFR parameterized by the IR luminosity (i.e. ).
Using the original definition of IR luminosity as the SED integrated from 40- to 120-m (Helou et al. 1986), we derive (Arp 220) and (NGC 6240). For the deduced dense gas mass range of we obtain (Arp 220) and (NGC 6240), suggesting a somewhat higher star formation efficiency in Arp 220. Finally these values are within the range of those found for a large sample of infra-red galaxies, consisting of large spiral galaxies, LIRGs, and a few ULIRG by Gao & Solomon (2004a,b) using the HCN 1–0 line as a linear tracer of dense gas.
A density-size hierarchy found for Galactic GMCs remaining valid in other galaxies would suggest that HCO+, HCN, and CS lines, given their increasing excitation requirements, would probe progressively deeper into the warm and dense gas phase fueling star formation. We briefly explore this scenario by calculating three separate star formation efficiencies, , , and , using the separate dense gas mass estimates based on HCO+, HCN, and CS available for Arp 220 only. For this galaxy we find () is larger than (), which may suggest that the star formation increases as we probe higher densities (Shirley et al. 2003). On the other hand, this trend is not confirmed by HCO+, which yields , just as we do not see a significantly narrower range in SFE-values at higher densities as one might otherwise expect (Shirley et al. 2003). In NGC 6240 the star formation efficiency derived from HCO+ () is smaller than the efficiency obtained from HCN (). We conclude that given the uncertainties in the mass estimates we cannot robustly claim a significant increase in the SFEs derived using HCO+, HCN and CS.
Theory currently provides some hints that support a small range of star formation efficiencies per dense gas mass. Simulations of star formation in turbulent media where dense (cm-3) gas clumps decouple from a supersonic, turbulent cascade to form stars at a constant efficiency seem to reproduce well some of the observed characteristics of SFR versus gas in galaxies (Krumholz & McKee 2005). Furthermore, Scoville (2003) showed that the negative feedback effect of high-mass star formation naturally leads to an upper bound on the SFE for star forming regions of . Although the exact value of this upper limit may change in the future (since it depends on the poorly constrained effective radiative opacity of the dust), the underlying physics is expected to apply to local star forming regions as well as those in circumnuclear starbursts. We note that our derived SFEs are consistent with the current upper limit.
6 Implications for dense star forming gas at high redshifts
Evidence from Galactic observations and recent results from the ULIRG/QSO Mrk 231 (Papadopoulos, Isaak & van der Werf 2007) point to the same gas phase responsible for both HCN and high- CO line emission. This is expected, as such a phase is intimately linked with ongoing star formation and thus its warm and dense conditions will excite the high- CO transition and those of HCN, CS and HCO+ alike. Thus the weaker lines of heavy rotor molecules with frequencies within the numerous transparent atmospheric windows at , can be used to probe the gas emitting also the luminous CO lines at frequencies of beyond which the atmospheric transparency window rapidly closes, even in sites where prime sub-mm telescopes are located.
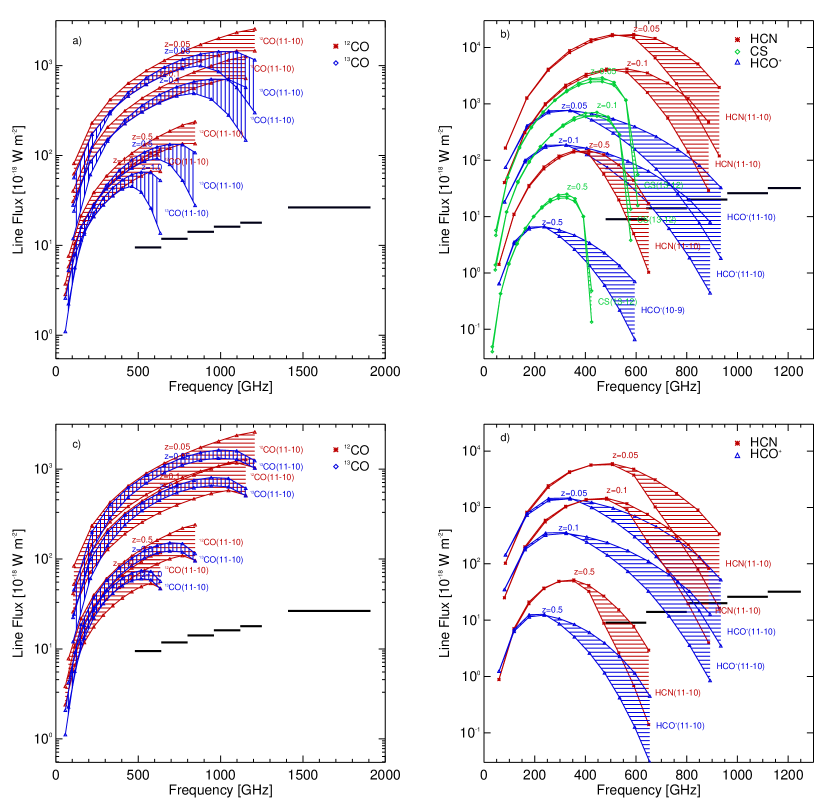
In Fig. 3(a) and (c) we have plotted the expected line fluxes of the 12CO and 13CO line templates – based on Arp 220 and NGC 6240, respectively – for redshifts , and . The 12CO and 13CO line fluxes were extracted from the LVG model with input conditions set by the HCN solution ranges for the dense gas in these two systems (Table 7). Similarly, Fig. 3(b) and (d) show the HCN/CS/HCO+ line templates for the solution ranges given in Table 7. For comparison we also show the latest sensitivity estimates for the HI-FI instrument (de Graauw et al. 1998, 2005) – a series of highly advanced heterodyne receivers due to fly onboard Herschel, an ESA cornerstone mission expected to launch in 2008. HI-FI will observe in six bands covering the frequency range 480–1910 GHz, enabling it to target the highest -transitions in low- sources. Fig. 3 shows that if Arp 220 and NGC 6240 are not significantly different from the bulk population of (U)LIRGs in the redshift range , HI-FI/Herschel will be able to detect the CO lines in such objects out to in less than 1 hr. At the CO lines are still within the HI-FI frequency range, and are easily detectable. We see the HCN and HCO+ lines are detectable in systems akin to Arp 220 and NGC 6240 out to . At , however, HCN lines are still detectable only in Arp 220-like systems. The predicted HCO+ lines fluxes for both type of systems at fall below the 1 hr - sensitivity limits of HI-FI.
Thus for (U)LIRGs in the redshift range , HI-FI will complement ground-based (sub)mm facilities where only the low- lines are accessible and thereby densely sample the rotational ladder for a number of important molecules in such systems. This will allow a full inventory of the molecular ISM in luminous starbursts and (U)LIRGs and provide a valuable set of low- templates for interpretation of high- detections in extremely distant galaxies () with ALMA. Characterizing these transitions relative to the lower ones in the local extreme starburst population – similar to the need to understand local dust SEDs before interpreting the very few frequency points detected for the dust continuum in high- galaxies – will prove to be extremely valuable before embarking on the high-, high- ventures with ALMA.
7 Summary
The main results presented in this paper are:
1. Using the JCMT and IRAM 30-m telescopes we report first detections of a number of important molecular lines, including transitions of , HCN, CS, and HCO+, in the two prototypical ULIRGs Arp 220 and NGC 6240. These observations along with measurements from the literature complete what is currently the largest molecular line catalog for such systems, capable of probing a wide range of densities and temperatures, especially for their important dense and warm star-forming gas phase.
2. In Arp 220 a systematic change in line profile as higher
densities are probed suggests large scale gas phase segregations within this
ULIRG. This is not observed in NGC 6240 even in the profiles of lines widely
separated in their excitation requirements such as 12CO J=2–1 and HCN
J=4–3. This points to the exciting possibility of using high-/high-dipole
molecular lines to deduce the state of gas relaxation in ULIRGs by simply
comparing the profiles of lines with widely different excitation requirements.
This could prove important since currently only in the closest ULIRGs can
interferometry be relied upon to reveal the state of the gas directly.
3. A single molecular gas phase is inadequate to account for the
observed properties of the molecular ISM in Arp 220 and NGC 6240. Analysis
of the numerous line ratios using a two-phase LVG model finds a diffuse
() phase that is most likely
unbound, and a dense gas phase ()
that contains the bulk of the molecular gas in these systems
().
4. The four highly excited HCN rotational transitions (also four CS
transitions for Arp 220) correspond to a gas phase that is
times denser than that suggested by the low, sub-thermal, HCO+ line ratios
measured in both systems. Thus HCN trace a denser gas phase than the
HCO+ lines. Moreover, these two phases are found consistent with an
underlying density-size power law, albeit with a steeper exponent than that
found in Galactic GMCs (i.e. the Larson’s law for densities). We argue that
this could be another result of the extreme tidal stripping of GMCs in
these strongly interacting systems. We also find that for CS all realistic
solutions imply , which suggest that the true CS abundance
is significantly higher (by an order of magnitude) than the assumed abundance
().
5. Finally, using Arp 220 and NGC 6240 as templates for starburst galaxies at higher redshifts, we show that the HI-FI instrument onboard Herschel will be ideal for detect very high- transitions of CO/HCN/CS/HCO+ in such objects out to redshifts of while still preserving the all important information about their relative velocity profiles. Thus the Herschel Space Observatory, in conjuction with an ongoing large mm/sub-mm molecular line survey of extreme starbursts, will be able to produce the first densely sampled rotational ladders of CO, HCN, and HCO+ for (U)LIRGs in the local Universe, a prerequisite in understanding star formation and its relation to dense gas in extreme starbursts localy and in their high redshift counterparts.
References
- Aalto et al. (1995) Aalto S., Booth R. S., Black J. H., Johansson L. E. B. 1995, A&A, 300, 369.
- Aalto et al. (2002) Aalto S., Polatidis A. G., Hüttemeister S., Curran S. J. 2002, A&A, 381. 783.
- Aalto et al. (2007) Aalto S., Spaans M., Wiedner M. C., Hüttemeister 2007, A&A, 464, 193
- Bayet et al. (2004) Bayet E., Gerin M., Phillips T. G., Contursi A. 2004, A&A, 427, 45.
- Bergin et al. (1996) Bergin E. A., Snell R. L. & Goldsmith P. F. 1996, ApJ, 460, 343.
- Bradford et al. (2003) Bradford C. M., Nikola T., Stacey G. J., Bolatto A. D., Jackson J. M., Savage M. L., Davidson J. A., Higdon S. J. 2003, ApJ, 586, 891.
- Bryant & Scoville (1996) Bryant P. M. & Scoville, N. Z. 1996, ApJ, 457, 678.
- Bryant & Scoville (1999) Bryant P. M. & Scoville, N. Z. 1999, AJ, 117, 263.
- Casassus, Stahl & Wilson (2005) Casassus S., Stahl O. & Wilson T. L. 2005, A&A, 441, 181.
- Casoli et al. (1992) Casoli F,. Dupraz C. & Combes F. 1992, A&A, 264, 55.
- Downes & Solomon (1998) Downes D. & Solomon P. M. 1998, ApJ, 507, 615.
- Dopita-et-al- (2005) Dopita M. A., et al. 2005, ApJ, 619, 755.
- Dickman, Snell, & Schloerb (1986) Dickman R. L., Snell R. L. & Schloerb F. P. 1986, ApJ, 309, 326
- Flower & Launay (1985) Flower D. R. & Launay J. M. 1985, MNRAS, 214, 271.
- Flower (1999) Flower D. R. 1999, MNRAS, 305, 651.
- (16) Gao Y. & Solomon P. M. 2004a, ApJS, 152, 63.
- (17) Gao Y. & Solomon P. M. 2004b, ApJ, 606, 271.
- Goldsmith & Langer (1978) Goldsmith P. F. & Langer W. D. 1978, ApJ, 222, 881.
- Goldsmith et al. (1981) Goldsmith P. F., Langer W. D., Ellder J., Kollberg E., Irvine W. 1981, ApJ, 249, 524.
- Goldsmith (2001) Goldsmith P. F. 2001, ApJ, 557, 736.
- Gordon et al. (1992) Gordon M. A., Baars J. W. M. & Cocke W. J. 1992, A&A, 264, 337.
- Graciá-Carpio et al. (2006) Graciá-Carpio J., García-Burillo S., Planesas P., Colina L. 2006, ApJ, 640, L135.
- de Graauw et al. (1998) de Graauw T., et al. 1998, SPIE, 3357, 336.
- de Graauw et al. (2005) de Graauw T., et al. 2005, BAAS, 37, 1219.
- Green & Thaddeus (1974) Green S. & Thaddeus P., 1974, ApJ, 191, 653.
- Heyer & Brunt (2004) Heyer M. H. & Brunt C. M. 2004, ApJ, 615, L45.
- Huttemeister-et-al- (1995) Hüttemeister S., Henkel C., Mauersberger R., Brouillet N., Wiklind T., Millar T. J. 1995, A&A, 295, 571.
- Iwasawa et al. (2005) Iwasawa K., Sanders D. B., Evans A. S., Trentham N., Miniutti G., Spoon H. W. W. 2005, MNRAS, 357, 565.
- Jackson et al. (1995) Jackson J. M., Paglione T. A. D., Carlstrom J. E. & Nguyen-Q R. 1995, ApJ, 438, 695.
- Jansen- (1995) Jansen D. 1995, Ph.D. thesis, Sterrewacht, Universiteit Leiden (1995).
- Komossa et al. (2003) Komossa S., Burwitz V., Hasinger G., Predehl P., Kaastra J. S., Ikebe Y. 2003, ApJ, 582, L15.
- Krumholz & McKee (2005) Krumholz M. R. & McKee C. F. 2005, ApJ, 630, 250.
- Kutner & Ulich (1981) Kutner M. L. & Ulich B. L. 1981 ApJ, 250, 341.
- Lahuis & van Dishoeck (2000) Lahuis F. & van Dishoeck E. F. 2000, A&A, 355, L699.
- Langer and Penzias (1993) Langer W. D. & Penzias A. A. 1993, ApJ, 408, 539.
- Larson (1981) Larson R. B. 1981, MNRAS, 194, 809.
- Lepp & Dalgarno (1996) Lepp S. & Dalgarno A. 1996, A&A, 306, L21.
- Lisenfeld et al. (1996) Lisenfeld U., Hills R. E., Radford S. J. E., Solomon P. M. 1996, in ’Cold Gas at High Redshifts’, p55, Kluwer Academic Publishers.
- Lonsdale, Farrah & Smith (2006) Lonsdale C., Farrah D. & Smith H. 2006, in “Astrophysics Update 2 - topical and timely reviews on astronomy and astrophysics”. Ed. John W. Mason. Springer/Praxis books.
- Mauersberger et al. (1999) Mauersberger R., Henkel C., Walsh W., Schulz A. 1999, A&A, 341, 256.
- Nakanishi et al. (2005) Nakanishi K., Okumura S. K., Kohno K., Kawabe R., Nakagaw T. 2005, PASJ, 4.
- Nguyen et al. (1992) Nguyen Q.-Rieu, Jackson J.M., Henkel C., Truong B., Mauersberger R. 1992, ApJ, 399, 521.
- Paglione et al. (1997) Paglione T. A. D., Jackson J. M., Ishizuki S. 1997, ApJ, 484, 656.
- Papadopoulos, Seaquist & Scoville (1996) Papadopoulos P. P., Seaquist E. R. & Scoville N. Z. 1996, ApJ, 465, 173.
- Papadopoulos & Seaquist (1998) Papadopoulos P. P. & Seaquist E. R. 1998, ApJ, 492, 521.
- Papadopoulos & Seaquist (1999) Papadopoulos P. P. & Seaquist E. R. 1999, ApJ, 516, 114.
- Papadopoulos and Greve (2004) Papadopoulos P. P. & Greve T. R. 2004, ApJ, 615, L29.
- (48) Papadopoulos P. P., Isaak K. G., & van der Werf P. P. 2007a, ApJ, 668, 815.
- (49) apadopoulos P. P., Greve T. R., van der Werf P. P., Müehle S. , Isaak, K., & Gao, Y. 2007b, Astrophysics & Space Science, special issue for 2006 conference ”Science with ALMA: a new era for Astrophysics” (arXiv:astro-ph/0701829).
- Papadopoulos (2007) Papadopoulos P. P. 2007, ApJ, 656, 792
- Plume et al. (1997) Plume R., Jaffe D. T., Evans N. J., Martín-Pintado J., Gómez-González J. 1997, ApJ, 476, 730.
- (52) Radford S. J. E., Solomon P. M. & Downes D. 1991a, ApJ, 368, L15.
- (53) Radford S. J. E., et al. 1991b, IAUS, 146, 303.
- Richardson (1985) Richardson K. J. 1985, Ph.D. thesis, Dept. Phys., Queen Mary College, Univ. London, (1985).
- Sakamoto et al. (2008) Sakamoto K., et al. 2008, ApJ, in press.
- Sanders & Mirabel (1996) Sanders D. B. & Mirabel I. F. 1996, ARA & A 34, 749.
- Schilke et al. (1992) Schilke P., Walmsley C. M., Pineau Des Forets, G., Roueff E., Flower D. R., Guilloteau S. 1992, A&A, 256, 595.
- Scoville et al. (1991) Scoville N. Z., Sargent A. I., Sanders D. B., Soifer B. T. 1991, ApJ, 366, L5.
- Scoville et al. (1997) Scoville N. Z., Yun M. S., Bryant P. M. 1997, ApJ, 484, 702.
- Scoville (2003) Scoville N. Z. 2003, proceedings of ”The Neutral ISM in Starburst Galaxies”, Marstrand, Sweden, Ed. S. Aalto, S. Hüttemeister & A. Pedlar, p. 253-261.
- Seaquist, Lee & Moriarty-Schieven (2006) Seaquist E. R., Lee S. W., Moriarty-Schieven G. H. 2006, ApJ, 638, 148.
- Shirley et al. (2003) Shirley Y. L., Evans N. J., Young K. E., Knez C., Jaffe D. T. 2003, ApJS, 149, 375.
- Soifer et al. (1986) Soifer B. T., Sanders D. B., Neugebauer G., Danielson G. E., Lonsdale C. J., Madore B. F., Persson S. E. 1986, ApJ, 303, L41.
- Solomon et al. (1990) Solomon P. M., Radford S. J. E., Downes D. 1990, ApJ, 348, L53.
- (65) Solomon P. M., Downes D., Radford S. J. E. 1992a, ApJ, 387, L55.
- (66) Solomon P. M., Downes D., Radford S. J. E. 1992b, ApJ, 398, L29.
- Solomon et al. (1997) Solomon P. M., Downes D., Radford S. J. E., Barrett J. W., 1997, ApJ, 478, 144.
- Spergel et al. (2003) Spergel D. N., et al. 2003, ApJS, 148, 175.
- Tacconi et al. (1999) Tacconi L. J., Genzel R., Tecza M., Gallimore J. F., Downes D., Scoville N. Z. 1999, ApJ, 524, 732.
- Turner et al. (1992) Turner B. E., Chan K, Green S., Lubowich D. A., 1992, ApJ, 399, 114.
- Usero et al. (2004) Usero A., García-Burillo S., Fuente A., Martín-Pintado J. 2004, ASPC. 320, 273.
- Weiss-Walter-Scoville- (2005) Weiß A., Walter F., Scoville N. Z. 2005, A&A, 438, 533.
- Wiedner-et-al- (2002) Wiedner M. C., Wilson C. D., Harrison A., Hills R. E., Lay O. P., Carlstrom J. E. 2002, ApJ, 581, 299.
- Wolfire et al. (2003) Wolfire M. G., McKee C. F., Hollenbach D., Tielens A. G. G. M. 2003, ApJ, 587, 278.
- Wu et al. (2005) Wu J., Evans N. J., Gao Y., Solomon P. M., Shirley Y. L., Vanden Bout P. A. 2005, ApJ, 635, L173.
| 12CO(2–1) | 12CO(3–2) | 13CO(2–1) | 13CO(3–2) | HCN(3–2) | HCN(4–3) | HCO+(4–3) | CS(5–4) | CS(7–6) | |
|---|---|---|---|---|---|---|---|---|---|
| Arp 220 | |||||||||
| [GHz] | 226.439 | 339.648 | 216.481 | 324.711 | 261.159 | 348.203 | 350.392 | 240.581 | 336.787 |
| [K] | 430 | 350-500 | 390-580 | 1020-1980 | 500-600 | 250-360 | 260-270 | 280-340 | 300-330 |
| [s] | 600 | 600 | 10800 | 2400 | 6000 | 5400 | 4800 | 5400 | 4200 |
| NGC 6240 | |||||||||
| [GHz] | 225.025 | 337.527 | 215.128 | 322.682 | 259.528 | 346.027 | 348.203 | 334.683 | |
| [K] | 410 | 290 | 400-480 | 700-810 | 280-290 | 370-750 | 310-460 | 280-300 | |
| [s] | 600 | 600. | 13200 | 3600 | 3000. | 7800 | 5400 | 3000 | |
| hpbw [′′] | 20.8 | 14.0 | 21.3 | 14.6 | 18.4 | 13.5 | 13.5 | 20.0 | 14.0 |
| 0.60(0.58)a | 0.53(0.51)a | 0.60(0.58)a | 0.53(0.51)a | 0.54(0.54)a | 0.53(0.51)a | 0.53(0.51)a | 0.56(0.57)a | 0.53(0.51)a |
| 13CO(1–0) | 13CO(2–1) | HCN(1–0) | CS(2–1) | CS(3–2) | HNC(1–0) | C18O(1–0) | |
|---|---|---|---|---|---|---|---|
| Arp 220 | |||||||
| [GHz] | 108.242 | 216.481 | 87.055 | 96.238 | 144.356 | 89.051 | 107.830 |
| [K] | 430 | 225-500 | 95-125 | 200-300 | 200-300 | 200-300 | 200-300 |
| [s] | 600 | 4320 | 4320 | ||||
| NGC 6240 | |||||||
| [GHz] | 215.128 | 86.512 | |||||
| [K] | 225-500 | 96-125 | |||||
| [s] | 7200 | 7200 | |||||
| hpbw [′′] | 22.4 | 11.4 | 28.3 | 25.1 | 18.0 | 27.1 | 22.4 |
| 0.56 | 0.41 | 0.62 | 0.59 | 0.52 | 0.59 | 0.56 |
| Arp 220 | NGC 6240 | |||||||||
|---|---|---|---|---|---|---|---|---|---|---|
| Line | fwhma | Telescope | Ref. | fwhma | Telescope | Ref. | ||||
| 12CO(1–0) | OVRO | [1] | IRAM 30m | [3] | ||||||
| OVRO | [2] | OVRO | [18] | |||||||
| IRAM 30m | [3] | |||||||||
| 12CO(2–1) | OVRO | [1] | IRAM PdBI | [19] | ||||||
| IRAM 30m | [4] | JCMT | This work | |||||||
| NRAO 12m | [5] | |||||||||
| OVRO | [6] | |||||||||
| JCMT | [9] | |||||||||
| JCMT | This work | |||||||||
| 12CO(3–2) | JCMT | [7] | JCMT | This work | ||||||
| HHT | [8] | |||||||||
| JCMT | [9] | |||||||||
| JCMT | This work | |||||||||
| 13CO(1–0) | SEST | [5] | IRAM 30m | [20] | ||||||
| IRAM 30m | This work | |||||||||
| 13CO(2–1) | IRAM 30m | [10] | JCMT | This work | ||||||
| JCMT | [11] | IRAM 30m | This work | |||||||
| IRAM 30m | This work | |||||||||
| JCMT | This work | |||||||||
| 13CO(3–2) | JCMT | This work | JCMT | This work | ||||||
| 12C18O(1–0) | IRAM 30m | This work | ||||||||
| HNCO(5–4) | IRAM 30m | This work | ||||||||
| HCN(1–0) | IRAM PdBI | [12] | IRAM 30m | [13] | ||||||
| IRAM 30m | This work | NMA | [21] | |||||||
| IRAM 30m | [13] | IRAM 30m | This work | |||||||
| IRAM 30m | [22] | IRAM 30m | [22] | |||||||
| HCN(2–1) | IRAM 30m | [22] | IRAM 30m | [22] | ||||||
| HCN(3–2) | JCMT | This work | JCMT | This work | ||||||
| IRAM 30m | [22] | IRAM 30m | [22] | |||||||
| HCN(4–3) | JCMT | This work | JCMT | This work | ||||||
| HNC(1–0) | IRAM 30m | [14] | SEST | [15] | ||||||
| SEST | [15] | |||||||||
| IRAM 30m | This work | |||||||||
| CS(2–1) | IRAM 30m | This work | ||||||||
| CS(3–2) | IRAM 30m | [10] | ||||||||
| IRAM 30m | This work | |||||||||
| CS(5–4) | JCMT | This work | ||||||||
| CS(7–6) | JCMT | This work | JCMT | This work | ||||||
| HCO+(1–0) | IRAM PdBI | [12] | NMA | [21] | ||||||
| IRAM 30m | [13] | IRAM 30m | [16] | |||||||
| IRAM 30m | [16] | |||||||||
| HCO+(3–2) | IRAM 30m | [16] | IRAM 30m | [16] | ||||||
| HCO+(4–3) | JCMT | This work | JCMT | This work | ||||||
| C i() | JCMT | [17] | JCMT | [17] | ||||||
b) Line flux densities are in units of Jy km s1.
c) Line luminosities are in units of K km s-1 pc2.
d) We assume a 30 per cent error on the flux measurement.
e) The fluxes are derived from the luminosities quoted by Graciá-Carpio et al. (2006).
| Galaxy | ||||||
|---|---|---|---|---|---|---|
| Arp 220 | ||||||
| NGC 6240 |
| Galaxy | |||||||||
|---|---|---|---|---|---|---|---|---|---|
| Arp 220 | |||||||||
| observed | |||||||||
| modeled | |||||||||
| NGC 6240 | |||||||||
| observed | |||||||||
| modeled |
| Transition | |||
|---|---|---|---|
| [GHz] | [K] | [cm-3] | |
| 12CO(1–0) | 115.271 | 5.5 | |
| 12CO(2–1) | 230.538 | 16.6 | |
| 12CO(3–2) | 345.796 | 33.2 | |
| HCN(1–0) | 88.632 | 4.3 | |
| HCN(3–2) | 265.886 | 25.5 | |
| HCN(4–3) | 354.734 | 42.5 | |
| HCO+(1–0) | 89.189 | 4.3 | |
| HCO+(3–2) | 267.558 | 25.7 | |
| HCO+(4–3) | 356.734 | 42.8 | |
| CS(2–1) | 97.980 | 7.1 | |
| CS(3–2) | 146.969 | 14.1 | |
| CS(5–4) | 244.936 | 35.3 | |
| CS(7–6) | 342.883 | 65.8 |
| /[K] | /cm-3 | / | |||
|---|---|---|---|---|---|
| Arp 220: | |||||
| HCO+ | |||||
| HCN | |||||
| CS | |||||
| NGC 6240: | |||||
| HCO+ | |||||
| HCN | |||||
| Arp 220 | NGC 6240 | |
| Method 1 | ||
| HCO+(1–0) | 0.5-1.6 | 1.3-2.2 |
| HCN(1–0) | 1.8-4.2 | 1.0-2.8 |
| CS(2–1) | 0.3-1.5 | . . . |
| Method 2 | ||
| HCN | 1.4-7.0 | 1.7-5.7 |
| Best Estimate | 0.3-1.6 | 1.0-2.2 |