Eavesdropping on Radio Broadcasts from Galactic Civilizations with Upcoming Observatories for Redshifted 21cm Radiation
Abstract
The question of whether intelligent life exists elsewhere is one of the fundamental unknowns about our Universe. Over the past decade extra-solar planets have been discovered, providing new urgency for addressing this question in these or other planetary systems. Independently of this perspective, new radio observatories for cosmology are currently being constructed with the goal of detecting 21cm emission from cosmic hydrogen in the redshift range . The radio frequency band covered by these experiments overlaps with the range of frequencies used for telecommunication on Earth, a regime that was never explored with high sensitivity before. For example, the Low-Frequency Demonstrator (LFD) of the Mileura Wide-Field Array (MWA), will cover in 8 kHz bins the entire frequency range of 80–300 MHz, which is perfectly matched to the band over which our civilization emits most of its radio power. We show that this and other low-frequency observatories (culminating with the Square Kilometer Array [SKA]) will be able to detect radio broadcast leakage from an Earth-like civilization out to a distance of pc, within a spherical volume containing stars, where (or 1.5) for a radar beam of solid angle that remains steady (or sweeps) across the sky. Such a radio signal will show-up as a series of narrow spectral lines that do not coincide with known atomic or molecular lines. The high spectral resolution attainable with the upcoming observatories will allow to monitor the periodic Doppler shift of the broadcasted lines over the planet’s orbital period around the parent star. Determination of the parent star mass through observations of its spectrum could then be used to infer the inclination, semi-major axis and eccentricity of the planet’s orbit. This, in turn, will allow to estimate the temperature on the planet’s surface and to assess whether it can support liquid water or life as we know it.
I I. Introduction
Over the past decade, more than 200 new planets outside the solar system were discovered Marcy . Because the majority of these planets were detected through precise radial velocity measurements, most of the known extra-solar planets have a mass comparable to that of Jupiter and a tight orbit around a star within a hundred parsec from the sun. Habitable conditions for life may exist on moons around these giant planets or in other planetary systems that better resemble the solar system. Given the high detection rate of new planets, the question of whether intelligent life exists elsewhere in the Galaxy is particularly timely.
The search for extra-terrestrial intelligence (SETI) has a long history Wilson . In 1960, a targeted search of two nearby sun-like stars used the 25-meter radio telescope of NRAO seven . This project OZMA eight was followed by other initiatives using radio telescopes nine and some SETI programs continue today (http://www.seti.org/). NASA’s program The High Resolution Microwave Search (HRMS) included both a targeted search at individual stars as well as an all sky survey, but was cancelled by Congress in the early 1990s ten . Funding for SETI initiatives today originates from non-profit organizations such as the Planetary Society eleven and the SETI Institute twelve . The SETI Institute has revived the targeted search component of HRMS through project PHOENIX. The SERENDIP program at UC Berkeley, as well as the joint venture between the SETI Institute and UC Berkeley involving the construction of the Allen Telescope Array (http://astron.berkeley.edu/ral/ata/), perform SETI work on radio telescopes that are also used for astronomical studies.
Most of the radio emission from our civilization on Earth originates in the frequency range of 50–400MHz. Table I summarizes the main sources of radio emission, including telecommunication and military radars. The bandwidth of the signals is narrow, with a fractional frequency width of for TV and FM stations and for the military radars. From a distance, the broadcasted power as a function of frequency would appear as narrow spectral lines.
For practical purposes, the traditional SETI searches focused on high radio frequencies that do not match the frequency range over which our civilization is most luminous (see Table I). Coincidentally, a new generation of radio observatories is being constructed around the globe with the primary goal of probing the redshifted 21cm (1420 MHz) emission from neutral hydrogen before it was ionized by the first galaxies. As these observatories focus on the redshift range of –15, they cover the frequency range of 80–300 MHz. This frequency range happens to coincide with the band over which our civilization is most luminous. Coincidentally, these sensitive new instruments could be suited for SETI work in this frequency band. The goal of this paper is to characterize and motivate the use of these new observatories for SETI studies. SETI work requires frequency resolution which happens to coincide with the design for one of these forthcoming observatories, the Mileura Wide-Field Array (MWA). We therefore use this experiment as a benchmark example to illustrate our main conclusions.
II II. 21 cm Cosmology
II.1 II.1 Background
The targeted cosmic fluctuations in the 21 cm brightness temperature are small, around 10–20 mK, depending on redshift and angular scale. Detection of these fluctuations is particularly challenging since the sky brightness temperature at the same wavelength is four orders of magnitude higher Loeb ; FBO . The faintness of the signal will drive the design of instruments to have large collecting areas. During the cosmic epoch of reionization, when the universe is partially ionized, the 21 cm signal has a “swiss cheese” topology created by the bubbles of ionized hydrogen (which are invisible at 21cm) surrounded by regions in which hydrogen is neutral and can thus be observed Loeb . The characteristic bubble size grows during reionization and eventually reaches the large scale of tens of comoving Mpc at the end of reionization, depending on the detailed characteristics of the sources of radiation and the distribution of the gas WL ; FZH ; Zahn ; Shapiro ; furl-21cmsim ; sok01 ; sh03a . Getting a good measure of the size distribution of these bubbles and other statistical properties of the fluctuations will require mapping tens to hundreds of square degrees (necessary in order to probe many large bubbles at the end of reionization) with at least arcminute resolution (in order to capture the many small bubbles present at the beginning of reionization). The removal of the strong synchrotron foreground will be achieved by subtracting the sky maps at slightly different frequencies FBO . For the cosmological signal, this is equivalent to slicing the hydrogen distribution at different redshifts and hence one should see a different map of its bubble structure, while the synchrotron foreground remains nearly the same.
II.2 II.2 Upcoming Low-Frequency Observatories
Several observational groups around the globe are constructing low-frequency arrays that will be capable of mapping the three-dimensional distribution of cosmic hydrogen in the infant universe. These arrays are aiming to detect the long-wavelength (redshifted 21cm) radio emission from hydrogen atoms, and map the three-dimensional distribution of cosmic hydrogen by making measurements over a wide range of frequencies.
The Low-Frequency Demonstrator (LFD) of the Mileura Wide-Field Array (MWA; see http://web.haystack.mit.edu/arrays/MWA/ for details) is currently under construction, with completion expected in early 2008. The MWA-LFD will cover the frequency range of 80–300MHz in 8kHz bins and include 500 dipole-based antenna tiles. Each 4m4m tile will contain 16 dipole antennas. Altogether the total collecting area will be 8000 m2 at 150 MHz. The tiles will be scattered across a 1.5 km region, providing an angular resolution of a few arcminutes. MWA will be located in a radio-quiet site in Western Australia, called Mileura. Other experiments whose goal is to detect 21cm fluctuations from the epoch of reionization at include the Low-Frequency Array (LOFAR; http://www.lofar.org), the Primeval Structure Telescope (PAST; http://arxiv.org/abs/astro-ph/0502029), and in the more distant future expansions of MWA-LFD with the ultimate observatory being the Square Kilometer Array (SKA; http://www.skatelescope.org).
III III. Signal Detectability for SETI
It is difficult to gauge the likelihood of success for the SETI endeavor Marko . As a result, ambitious and thus expensive projects whose sole purpose is SETI are unlikely to be funded. It is thus particularly fruitful to understand the synergies and complementarities of other scientific projects with various types of SETI searches.
To motivate the potential of this approach we first summarize the expected sensitivity of MWA-LFD and other experiments. To assess what such detection levels could mean for SETI we use the current radio emission by our civilization as an example and also compare with other past and future SETI studies.
It is important to note that high-redshift 21 cm surveys will operate at different frequencies than past and current SETI searches, making them complementary. They will also have very different observing strategies and so they will explore a different part of the signal parameter space.
III.1 III.1 Possible Signals: Our Civilization as an Example
Forecasting how the signals from another civilization might look like is not an easy proposition. It is clear from the start that although one might be able to come up with educated guesses it is very possible that if we ever detect such a signal it will look different from our initial guesses.
For example, one might argue that the characteristics of the signal might be very different if the signal we receive was broadcasted intentionally by another civilization to announce its presence, a “beacon” of sorts, or just the leakage of signals that the extra-terrestrials produce for their own communication either within their own planet or between spacecrafts 111Note that aside from planet-based broadcasting, there is a possibility of discovering communication stations that were distributed throughout the Galaxy by another civilization which by itself resides far away (G. Laughlin, private communication)..
Whether we look for a beacon or unintentional leakage, the signal we are after must posses some characteristic that will enable us to distinguish it from naturally produced signals. Examples of such characteristics might be peculiar time variability and very narrow frequency structure centered on a frequency where there are no atomic or molecular lines.
A good starting point when considering “leakage”-type signals is the signal from our own civilization. A summary of the strongest emission component from the Earth is given in Table 1 (adopted from Ref. sullivan ). The strongest sources of emission in terms of their power are military radars 222Table I indicates that it would be easier to detect militant civilizations than their peaceful analogs. If this extrapolation from our own experience is to be believed, then we should make any effort to limit communication with the brightest civilizations in a survey. (), followed by TV stations and FM radio stations (). In terms of power per Hz, the strongest signal originates from TV stations. These two signals are emitted in a fairly isotropic way. If our civilization was using a telescope to beam those signals as a beacon or perhaps to communicate with a distant spacecraft, then the effective emitted power could have been much larger. Of course in that case only a correspondingly smaller fraction of distant observers would detect the signal at any given time. It is possible then that the signal we are after, would be much stronger than our own emission but with a small duty cycle.
It is important to keep in mind that various physical processes would broaden the bandwidth or modulate the frequency of the emitted radio signal. In particular the motion of the planet around its parent star and the spin of the planet, both introduce shifts. The shifts are especially important for long integration times with narrow bandwidths. For the case of the Earth, the spin velocity would introduce a shift of order,
| (1) | |||||
| (2) |
over the course of a day. The envelope of this variability will be modulated by the orbital velocity around the sun over the course of a year with,
| (3) | |||||
| (4) |
The significance of these frequency drifts will depend on the duration of the observations which could be very long, of order months, in the context of 21 cm experiments.
If the transmitters are not distributed uniformly on the surface of the planet, the planet’s spin will also introduce a modulation in the intensity of the signal. Of course if the signal originates from a beacon then it might be significantly beamed or pulsed. The modulations of both intensity and frequency could eventually become clues that the emission originates from another civilization or at least from a planet around a star.
In summary, the generic property of the expected signals are that they are narrow in frequency and that they might have interesting time variability as a result of both the orbital motion of the planet and its rotation around its axis, in addition to the variability introduced at the transmission.
Other observing techniques should be used to follow-up on any radio detection of planets in an attempt to check whether it could host life as we know it. The habitable zone is the range of orbital radii over which liquid water may exist on a rocky planet, so that life as we know it could develop there based on a similar network of chemical reactions to the one that existed on the early Earth. Obviously, the habitable zone straggles the distance of 1AU for a sun-like star, but its location changes for other stellar types Lopez ; Forget . The first extensive discussion on habitability was provided by Kasting et al. Kasting ; Kasting2 . Existing observational techniques could find planets in the habitable zone in the future Charb . Proposed space missions, such as the Terrestrial Planet Finder (http://tpf.jpl.nasa.gov/earthlike/earth-like.html) and Darwin (http://sci.esa.int/science-e/www/area/index.cfm?fareaid=28), focus on searches for signatures of life on extrasolar planets.
So far, no extrasolar planet was found to reside within the habitable zone of its parent star (but see the indirect constraints in Refs. Jones ; Raymond ). Obviously, all planets which will be found to reside in the habitable zone should be searched with great sensitivity for radio signals, and vice versa. The different search methods are complementary and one should use all probes at our disposal to constrain the physical conditions on such planets and determine whether they might support life. This obviously includes spectroscopy of the parent star, which would yield its distance, spectral type, as well as the location of its habitable zone.
III.2 III.2 Experiment Characteristics
The 21 cm signal from high-redshift hydrogen is faint, leading to brightness temperature fluctuations of the order of mK on top of a sky brightness of K dominated by Galactic synchrotron radiation FBO . The HII regions responsible for a large part of the signal subtend tens of arcminutes on the sky WL , and so large fields of view will be required to eliminate uncertainties due to cosmic variance. The MWA-LFD and other future surveys will be designed to have large collecting areas to be able to detect the weak 21cm signal, with fields of view that cover many square degrees on the sky. Observing the 21 cm signal will also require integrating on those fields for long periods of time. Finally the technique that will be used to distinguish the high-redshift 21 cm signal from various astrophysical foregrounds and radio frequency interference involves mapping the signal with high frequency resolution.
As a result, future experiments will have extremely good sensitivity and could thus place strong limits on potential SETI signals. The extensive time coverage would allow the study of signals which might only be transmitted in our direction for a small fraction of the time.
The point source sensitivity of an interferometer composed of antennae of individual area and baselines that observes for a time with a bandwidth is,
| (5) |
where is a constant of order unity that depends on the spatial distribution of baselines. The system temperature, , is dominated by the synchrotron emission from our Galaxy and is thus frequency dependent and variable across the sky.
For the MWA-LFD, the point source sensitivity at MHz is333The value of for other frequencies can be found at http://web.haystack.mit.edu/arrays/MWA/LFD .,
| (6) |
where the current design aims at kHz. For a given distance to the source , this formula can be turned into the minimum power required of the transmitter for MWA to see it,
| (7) | |||||
Here it is assumed that the intrinsic bandwidth of the signal is much smaller than . In this regime one gains by making smaller.
Note that the power level in equation (7) is only an order of magnitude larger than the present-day military radar emission from the Earth (Table I) even for a source which is 100 pc away. It is plausible that the actual emission from other civilizations would be stronger. It is also possible that the emission would be beamed or pulsed so that it would be visible to us for only a small fraction of the time. The required minimum power scales as . Thus a duty cycle of requires a source to be merely 10 times closer for the same emitted peak power. One way to increase the sensitivity is to reduce the bandwidth of the observations down to below which there is no additional gain.
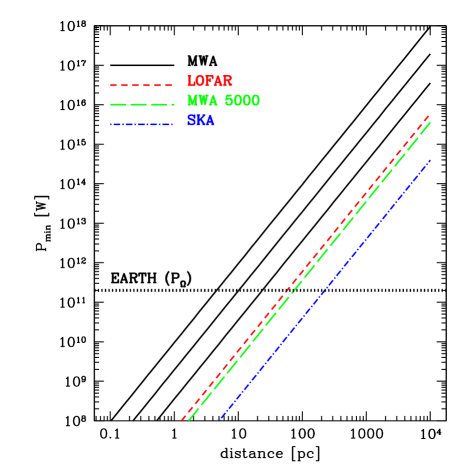
Figure 1 shows the power required for a transmitter (assuming isotropic emission) to be detectable by MWA-LFD as a function of distance to the source. The three solid lines show results for an hour, a day or a month of integration on a field. For a month of integration time, the Earth radio signal could be detected out to a distance of pc interior to which there are stars over the whole sky (the field of view of MWA is about a percent of the sky). However, only a fraction of the military radars may be beamed in our direction, where (or 1.5) for a radar beam of solid angle that remains steady (or sweeps) across the sky. We also plot the expected one-month sensitivity of LOFAR, MWA 5000 (a future extension of MWA with ten times its collecting area) and the SKA – which would be able to detect the Earth out to a distance of 0.2 kpc. We note that the use of the SKA in the broader context of the exploration of life was discussed in Ref. Lazio .
Another figure of merit that can be used to compare MWA with other previous and future SETI searches is the flux, in , that must be arriving on Earth for a source to be detectable,
| (8) |
The promise of future 21 cm surveys is evident from Figure 1. As the collecting area increases, the arrays will probe larger distances.
III.3 III.3 Comparison with Other SETI Probes
Next we compare the sensitivity of MWA with other SETI probes in the radio frequency range tarter . A very important difference between MWA and previous probes involves its sensitivity to lower frequencies. Most radio SETI programs have searched above 1 GHz and around the unredshifted 21 cm line at 1.42 GHz. There were several reasons to focus on this frequency range. First, the sky brightness temperature is smaller above 1 GHz as the synchrotron emission from relativistic electrons in our galaxy becomes sub-dominant relative to the Cosmic Microwave Background. Second, when looking for a “beacon” type signal it could be argued that other civilizations might center their transmitters around the 1.42 GHz line with the hope of reaching astronomers using that line for astronomical observations. It is difficult to gauge whether such an argument carries much weight.
Of course, our own radio broadcasting is far greater at lower frequencies, so at least for the purpose of “eavesdropping” on another civilization, lower frequencies might be more interesting. The fact that our civilization makes much use of the lower frequency spectrum presents severe technical difficulties for SETI programs trying to operate in this frequency range as they have to filter-out our own radio-frequency interference (RFI). Thus, 21cm cosmology is a case in which an unrelated science driver will open a new and potentially more suitable window for SETI programs. The interest in high-redshift 21 cm surveys means that there will be significant efforts to control RFI by, for example, placing the observatories in remote locations with the lowest RFI record (such as China, Australia, Africa, or even the moon), as well as developing new filtering techniques for RFI and ionospheric noise. Obviously SETI programs could benefit significantly from these technological developments.
A good summary of previous and planned SETI programs can be found in Ref. tarter . Here we will only comment on some of the most sensitive of those programs and focus our attention only on radio band examples. In doing so, we would like to demonstrate that SETI work with the MWA-LFD and other 21 cm surveys could have very competitive sensitivities.
The SETI programs carried out at Arecibo and the Parkes telescope in Australia achieved the best sensitivities with their very large collecting areas. For example, the Phoenix project carried out by the SETI institute reached a flux limit of by searching the nearest 600 stars at frequencies in the range 1.2–3 GHz with a frequency resolution of 1 Hz. The SERENDIP IV project out of UC Berkeley also uses Arecibo to monitor the sky visible from Arecibo up to a flux of . It covers the sky every three years and looks for recurring signals. It explores the frequency range GHz with a 0.6 Hz bandwidth. A companion SERENDIP search with similar characteristics operates from the Parkes telescope.
The collecting area of Arecibo is approximately m2, roughly ten times that of MWA-LFD. By working at higher frequencies where the sky is less bright, the sensitivity of previous surveys was enhanced. The MWA-LFD with its deep observations of certain fields will be competitive or even better than those previous surveys at least for steady signals. Production of detailed images from the epoch of reionization will require an increase in collecting area of future arrays by a factor of 10–100. Arrays of dipoles such as the MWA-LFD, have a much larger field of view, around 400 square degrees at 200 MHz, while a telescope like Arecibo has a field of view of less that a tenth of a square degree. The long observing times required for high-redshift 21 cm observations also open a new regime for SETI observations.
The next generation of SETI work will be carried out by the Allen Telescope Array (ATA), a joint venture of the SETI Institute and UC Berkeley. The will include about three hundred and fifty 6 m dishes. The plan is to survey of order stars three times in the frequency range of GHz over a period of 10 years. This instrument has a collecting area similar to that of the MWA-LFD but a smaller field of view. It is complementary to what could be done with proposed 21 cm arrays over a different range of frequencies. Again, the higher frequencies lead to a smaller sky temperature and thus to a better raw sensitivity in terms of . But the larger collecting area of future extensions of the MWA-LFD will partially compensate for their larger system temperature. The observing strategy of high-redshift 21 cm surveys, namely deep integration on selected fields, is also very different from the ATA survey. It will open a window to search for other types of signals, such as those that could be intense but with a short duty cycle, perhaps appearing for a short time once every rotation period of the planet.
It is very important to stress that all these different SETI projects have fairly different characteristics in terms of frequency coverage, time spent observing any given source, or bandwidth of the observation. Given our ignorance about the characteristics of the extra-terrestrial signal, it is certainly worth using all these different instruments for the search. In this context, it is clear that the redshifted 21 cm observatories could attain unique sensitivities that were never realized before.
IV IV. Discussion
Figure 1 indicates that integration times of months to years on upcoming low-frequency observatories will provide an unprecedented sensitivity to radio broadcasts from an Earth-like civilization at Galactic distances of 0.01–0.5 kpc, within a spherical volume containing stars, where (or 1.5) for a radar beam of solid angle that remains steady (or sweeps) across the sky. The challenge to detect redshifted 21cm radiation from the infant Universe will open a new opportunity for eavesdropping on the leakage of signals from Galactic civilizations in the same band of radio frequencies that our civilization uses for communication. Such an opportunity never existed before.
SETI work requires an optimized algorithm and software for extracting the artificial signal out of the data stream of upcoming observatories aiming to detect the cosmological 21cm brightness fluctuations. If not searched for, the desired SETI signal may be lost. Processing of the data will be done by filtering-out unwanted foregrounds. In particular, the radio-communication signal from a faint Earth-like source can be separated from the frequency structure of the redshifted 21cm fluctuations through its time dependence.
The desired radio signal would appear as a series of spectral lines whose frequencies would be Doppler shifting continuously on both the spin period of the brodcasting planet (a day for the Earth) as well as its orbital period around the parent star (a year for the Earth). The planet-star system resembles a spectroscopic binary in which one of the objects (the planet) is a test particle in the gravitational field of a companion object (the star) whose mass can be inferred from its emission spectrum through follow-up observations with optical-infrared telescopes. Under these conditions, measurements of the planet’s Doppler effect over a full orbit would determine the inclination, eccentricity and semi-major axis of the planet’s motion around the star 444The observed period and projected velocity can be used to infer the inclination if the mass of the star is known; see S. Shapiro & S.A. Teukolsky, Black Holes, White Dwarfs, and Neutron Stars: The Physics of Compact Objects, Wiley-New York (1983), p. 254. The orbital period, projected velocity, and inclination, can then be used to derive the semi-major axis, from which the eccentricity can be deduced based on the period. The results can be tested for consistency by observing the centroid shift of the radio image as a function of time, as this would provide an independent measure of the distance and hence the luminosity of the star.. The inferred orbital parameters can then be used to estimate the temperature on the surface of the planet and to assess whether it is likely to support liquid water or life as we know it.
The optimization of the detection algorithm could also lead to changes in hardware or observing strategy with the goal of improving the prospects for the detection of a SETI signal. Although MWA-LFD provided the benchmark example in this paper, our conclusions extend to other experiments such as LOFAR, PAST, or the SKA. In parallel to developing the detection and analysis filter for these experiments, it would be prudent to compile an extended catalog of all nearby stars with known planets where low-frequency radio emission might be detectable. This work will extend previous analysis Turnbull to include additional stars where planets were found recently, as well as to span larger distances than those probed by other SETI experiments.
Acknowledgments
We acknowledge support from the FQXi grant #RFP1-06-22 and Harvard university funds for A.L.; M. Z. is supported by the Packard and Sloan foundations, NSF AST-0506556 and NASA NNG05GG84G. We thank the anonymous referee for useful comments.
References
- (1) G. Marcy, R. P. Butler, D. Fischer, S. Vogt, J. T. Wright, C. G. Tinney, C. G., & H. R. A. Jones, Progress of Theoretical Physics Supplement, 158, 24 (2005); see also http://www.ifa.hawaii.edu/UHNAI/ppv.htm
- (2) T. L. Wilson, Nature, 409, 1110 (2001).
- (3) F. D. Drake, in “Current Aspects of Exobiology”, eds. G. Mamikunian & M. H. Briggs, pp. 323-345, Pergamon Press, New-York (1965).
- (4) L. F. Baum, “The Wizard of Oz”, Bobbs-Merrill, New-York (1990).
- (5) J. Tarter, in “The Search for Extraterrestrial Intelligence”, eds. K. I. Kellerman & G. A. Seilstad, pp. 79-98, National Radio Astronomy Observatory, Greenbank (1986).
- (6) J. Tarter, & M. Klein, in “Progress in the Search for Extraterrestrial Life, ed. G. S. Shostak, ASP Conf. Ser. 74, 419-422, The Astronomical Society of the Pacific (1995)
- (7) T. McDonough, in “Progress in the Search for Extraterrestrial Life, ed. G. S. Shostak, ASP Conf. Ser. 74, 419-422, The Astronomical Society of the Pacific (1995).
- (8) T. Pierson, in “Progress in the Search for Extraterrestrial Life, ed. G. S. Shostak, ASP Conf. Ser. 74, 443-444, The Astronomical Society of the Pacific (1995).
- (9) M. Horvat, Int. Journal of Astrobiology, 5, 143 (2006).
- (10) T. J. W. Lazio, J. C. Tarter, & D. J. Wilner, New Astronomy Reviews, 48, 985 (2004).
- (11) J. Tarter, Annu, Rev. Astron. Astrophys., 39, 511 (2001).
- (12) W. T. Sullivan III, S. Brown, C. Wetherill, Science, 199, 377 (1978).
- (13) B. Lopez, J. Schneider, & W. C. Danchi, Astrophys. J., 627, 974 (2005).
- (14) F. Forget, Earth Moon and Planets, 81, 59 (2000).
- (15) J. F. Kasting, D. W. Whitmire, & R. T. Reynolds, Icarus 101, 108, (1993).
- (16) J. F. Kasting, & D. Catling, Ann. Rev. Astr. & Astrophys., 41, 429 (2003).
- (17) D. Charbonneau, T. M. Brown, A. Burrows, & G. Laughlin, to appear in Protostars and Planets V, (2006), preprint astro-ph/0603376
- (18) B. W. Jones, P. N. Sleep, & D. R. Underwood, Astrophys. J. 649, 1010 (2006).
- (19) S. N. Raymond, Astrophys. J. Lett., 643, L131 (2006).
- (20) A. Loeb, “First Light”, to be published by Springer-Verlag (2006); preprint astro-ph/0603360.
- (21) S. Furlanetto, S. P. Oh, & F. Briggs, Phys. Rep., in press (2006); preprint astro-ph/0608032.
- (22) J. S. B. Wyithe, & A. Loeb, Nature, 432, 194 (2004).
- (23) S. R. Furlanetto, M. Zaldarriaga, & L. Hernquist, Astrophys. J., 613, 1 (2004).
- (24) O. Zahn, et al. Astrophys. J., submitted (2006); preprint astro-ph/0604177
- (25) G. Mellema, I. T. Illiev, U.-L. Pen, & P. R. Shapiro, Mon. Not. R. Astr. Soc., in press (2006); preprint astro-ph/0603518
- (26) S. Furlanetto, A. Sokasian and L. Hernquist, Mon. Not. Roy. Astron. Soc. 347, 187 (2004).
- (27) A. Sokasian, T. Abel, & L. Hernquist, NewA, 6, 359 (2001).
- (28) V. Springel, & L. Hernquist, MNRAS, 339, 289; 312 (2003).
- (29) M. C. Turnbull, & J. C. Tarter, Astrophys. J. Suppl., 145, 181; 149, 423 (2003).
| Service | Freq. | Transmitters | Max. Power | Bandwidth | Power | Power/Hz |
|---|---|---|---|---|---|---|
| (MHz) | (No.) | per Tr. (W) | (Hz) | (W) | (W/Hz) | |
| Military | 10 | |||||
| TV | 40-850 | 2000 | 0.1 | |||
| FM | 88-108 | 9000 | 0.1 |