GMRT Radio Halo Survey in galaxy clusters at z = 0.2 – 0.4.
Abstract
Aims. We present the first results of an ongoing project devoted to the search of giant radio halos in galaxy clusters located in the redshift range z=0.2–0.4. One of the main goals of our study is to measure the fraction of massive galaxy clusters in this redshift interval hosting a radio halo, and to constrain the expectations of the particle re–acceleration model for the origin of non–thermal radio emission in galaxy clusters.
Methods. We selected 27 REFLEX clusters and here we present Giant Metrewave Radio Telescope (GMRT) observations at 610 MHz for 11 of them. The sensitivity (1) in our images is in the range 35–100 Jy beam-1 for all clusters.
Results. We found three new radio halos, doubling the number of halos known in the selected sample. In particular, giant radio halos were found in A 209 and RXCJ 2003.5–2323, and one halo (of smaller size) was found in RXCJ 1314.4–2515. Candidate extended emission on smaller scale was found around the central galaxy in A 3444 which deserves further investigation. Furthermore, a radio relic was found in A 521, and two relics were found in RXCJ 1314.5–2515. The remaining six clusters observed do not host extended emission of any kind.
Key Words.:
Radio continuum: galaxies – galaxies: clusters: general – galaxies: clusters: individual:1 Introduction
Radio and X–ray observations of galaxy clusters prove
that thermal and non–thermal plasma components coexist in the
intracluster medium (ICM).
While X–ray observations reveal the presence of diffuse
hot gas, the existence of extended cluster–scale radio
sources in a number of galaxy clusters, well known as
radio halos and relics, prove the presence of
relativistic electrons and magnetic fields.
Both radio halos and relics are low surface
brightness sources with steep radio spectra, whose linear size
can reach and exceed the Mpc scale.
Radio halos are usually located at the centre of galaxy
clusters, show a fairly regular radio morphology, and
lack an obvious optical counterpart.
A total of about 20 radio halos have been detected up to now
(Giovannini, Tordi & Feretti giovannini99 (1999); Giovannini & Feretti
gf02 (2002); Kempner & Sarazin kempner01 (2001);
Bacchi et al. bacchi03 (2003)). Relics are usually found at
the cluster periphery, their radio emission is highly polarized
(up to 30%), and shows a variety of radio morphologies,
such as sheet, arc, toroids. At present
a total of 20 relics (including candidates) are known
(Kempner & Sarazin kempner01 (2001); Giovannini & Feretti
gf04 (2004)).
Evidence in the optical and X–ray bands has been
accumulated in favour of the hierarchical formation of galaxy clusters
through merging processes (for a collection of reviews on this subject
see Feretti, Gioia & Giovannini 2002), and this
has provided insightful pieces of information in our understanding of
radio halos. It is not clear whether all clusters with signatures
of merging processes also possess a radio halo; on the other hand,
all clusters hosting a radio halo show sub–structures in the X–ray emission,
and the most powerful radio halos are hosted in clusters
which most strongly depart from virialization (Buote buote01 (2001)).
Giovannini et al. (1999) showed that in the redshift interval 0 – 0.2
the detection rate of cluster radio halos increases with increasing X–ray
luminosity, which suggests a connection with the gas temperature and cluster mass.
The very large extent of radio halos poses the question of their origin,
since the diffusion time the relativistic electrons need to cover the
observed Mpc size is 30 – 100 times longer than their radiative lifetime.
Two main possibilities have been investigated so far: “primary models”, in which
particles are in–situ re–accelerated in the ICM, and “secondary models”
in which the emitting electrons are secondary products of hadronic collisions
in the ICM (for reviews on these models see Blasi blasi04 (2004);
Brunetti brunetti03 (2003) and brunetti04 (2004); Ensslin ensslin04 (2004);
Feretti feretti03 (2003); Hwang hwang04 (2004); Sarazin sarazin02 (2002)).
Cluster mergers are among the most energetic events in the Universe, with
an energy release up to 1064 erg, and a challenging question is if at
least a fraction of such energy may be channelled into particle reacceleration
(e.g. Tribble tribble93 (1993)).
Indeed observational support (for a review see Feretti feretti03 (2003)) is now
given to the particle re–acceleration model, which assumes that the
radiating electrons are stochastically re–accelerated by turbulence in the
ICM and that the bulk of this turbulence is injected during cluster mergers
(Brunetti et al. brunetti01 (2001); Petrosian petrosian01 (2001);
Fujita, Takizawa & Sarazin fujita03 (2003);
Brunetti et al. brunetti04b (2004)).
Although the physics of particle re–acceleration by turbulence has been
investigated in some detail and the model expectations seem to reproduce
the observed radio features, only recently statistical calculations
in the framework of the re–acceleration model have been carried out by
Cassano & Brunetti (cassano05 (2005), hereinafter CB05).
Making use of semi–analytical calculations they estimated the energy of turbulence
injected in galaxy clusters through cluster mergers, and derived the
expected occurrence of giant111Linear size 1 Mpc as defined in CB05, with
H0=50 km s-1 Mpc-1.
This size corresponds to 700 kpc with the cosmology assumed in
this paper, i.e. km s-1 Mpc-1, =0.3 and
=0.7. radio halos as a function of the mass
and dynamical status of the clusters in the framework of the merger–induced
particle re–acceleration scenario.
The most relevant result of those calculations is that the occurrence of giant
radio halos increases with the cluster mass. Furthermore, the expected fration
of clusters with giant radio halos at z 0.2 can be reconciled with the
observed one (Giovannini et al. giovannini99 (1999)) for viable values of the
model parameters.
Cassano, Brunetti & Setti (cassano04 (2004), hereinafter CBS04) and
Cassano, Brunetti & Setti (cassano06 (2006), hereinafter CBS06) showed
that the bulk of giant radio halos
are expected in the redshift range
as a result of two competing effects, i.e. the decrease of the fraction of clusters
with halos in a given mass range and the increase of the volume of the Universe with
increasing redshift. Given that inverse Compton losses increase with the redshift,
it is expected that powerful giant radio halos at are preferentially
found in massive clusters ()
undergoing merging events. In particular, it is expected that
a fraction of 10 – 35 % of clusters in this redshift interval and mass range
may host a giant radio halo.
With the aim to investigate the connection between cluster mergers and the
presence of cluster–type radio sources, in particular to derive
the fraction of massive galaxy clusters in the range 0.2 z 0.4
hosting a radio halo and constrain the predictions of the re–acceleration
model in the same redshift interval, we undertook an observational
study using the Giant Metrewave Radio Telescope (GMRT, Pune,
India) at 610 MHz. Our project will be presented here and in future papers,
and will be referred to as the GMRT Radio Halos Survey.
Here we report the results on 11 galaxy clusters observed with the GMRT in
January 2005. The paper is organised as follows:
in Section 2 we present the sample of galaxy
clusters; the radio observations are described in Section 3;
the analysis of our results and a brief discussion are given in
Section 4 and 5 respectively.
2 The cluster sample
| REFLEX Name | Alt. name | RAJ2000 | DECJ2000 | z | LX(0.1–2.4 keV) | MV | RV |
|---|---|---|---|---|---|---|---|
| erg s-1 | 1015M⊙ | Mpc | |||||
| √ RXCJ 0003.10605 | A 2697 | 00 03 11.8 | 06 05 10 | 0.2320 | 6.876 | 1.68 | 2.70 |
| ⋆ RXCJ 0014.33023 | A 2744 | 00 14 18.8 | 30 23 00 | 0.3066 | 12.916 | 2.58 | 2.99 |
| √ RXCJ 0043.42037 | A 2813 | 00 43 24.4 | 20 37 17 | 0.2924 | 7.615 | 1.80 | 2.67 |
| √ RXCJ 0105.52439 | A 141 | 01 05 34.8 | 24 39 17 | 0.2300 | 5.762 | 1.50 | 2.60 |
| √ RXCJ 0118.12658 | A 2895 | 01 18 11.1 | 26 58 23 | 0.2275 | 5.559 | 1.45 | 2.58 |
| √ RXCJ 0131.81336 | A 209 | 01 31 53.0 | 13 36 34 | 0.2060 | 6.289 | 1.58 | 2.69 |
| √ RXCJ 0307.02840 | A 3088 | 03 07 04.1 | 28 40 14 | 0.2537 | 6.953 | 1.69 | 2.67 |
| RXCJ 0437.10043 | 04 37 10.1 | 00 43 38 | 0.2842 | 8.989 | 2.02 | 2.79 | |
| √ RXCJ 0454.11014 | A 521 | 04 54 09.1 | 10 14 19 | 0.2475 | 8.178 | 1.89 | 2.78 |
| RXCJ 0510.70801 | 05 10 44.7 | 08 01 06 | 0.2195 | 8.551 | 1.95 | 2.86 | |
| √ RXCJ 1023.82715 | A 3444 | 10 23 50.8 | 27 15 31 | 0.2542 | 13.760 | 2.69 | 3.12 |
| √ RXCJ 1115.80129 | 11 15 54.0 | 01 29 44 | 0.3499 | 13.579 | 2.67 | 2.95 | |
| ⋆ RXCJ 1131.91955 | A 1300 | 11 31 56.3 | 19 55 37 | 0.3075 | 13.968 | 2.72 | 3.04 |
| RXCJ 1212.31816 | 12 12 18.9 | 18 16 43 | 0.2690 | 6.197 | 1.56 | 2.58 | |
| √ RXCJ 1314.42515 | 13 14 28.0 | 25 15 41 | 0.2439 | 10.943 | 2.30 | 2.98 | |
| √ RXCJ 1459.41811 | S 780 | 14 59 29.3 | 18 11 13 | 0.2357 | 15.531 | 2.92 | 3.24 |
| RXCJ 1504.10248 | 15 04 07.7 | 02 48 18 | 0.2153 | 28.073 | 4.37 | 3.75 | |
| √ RXCJ 1512.22254 | 15 12 12.6 | 22 54 59 | 0.3152 | 10.186 | 2.19 | 2.81 | |
| RXCJ 1514.91523 | 15 14 58.0 | 15 23 10 | 0.2226 | 7.160 | 1.73 | 2.74 | |
| ⋆ RXCJ 1615.70608 | A 2163 | 16 15 46.9 | 06 08 45 | 0.2030 | 23.170 | 3.84 | 3.62 |
| √ RXCJ 2003.52323 | 20 03 30.4 | 23 23 05 | 0.3171 | 9.248 | 2.05 | 2.75 | |
| RXCJ 2211.70350 | 22 11 43.4 | 03 50 07 | 0.2700 | 7.418 | 1.77 | 2.69 | |
| √ RXCJ 2248.51606 | A 2485 | 22 48 32.9 | 16 06 23 | 0.2472 | 5.100 | 1.37 | 2.50 |
| √ RXCJ 2308.30211 | A 2537 | 23 08 23.2 | 02 11 31 | 0.2966 | 10.174 | 2.19 | 2.85 |
| √ RXCJ 2337.6+0016 | A 2631 | 23 37 40.6 | 00 16 36 | 0.2779 | 7.571 | 1.79 | 2.69 |
| √ RXCJ 2341.20901 | A 2645 | 23 41 16.8 | 09 01 39 | 0.2510 | 5.789 | 1.49 | 2.57 |
| √ RXCJ 2351.62605 | A 2667 | 23 51 40.7 | 26 05 01 | 0.2264 | 13.651 | 2.68 | 3.16 |
Symbols are as follows: √ marks the clusters observed by us with the GMRT as part of our radio halo survey; ⋆ marks the clusters with radio halo known from the literature (A 2744 Govoni et al. govoni01 (2001); A 1300 Reid et al. reid99 (1999); A 2163 Herbig & Birkinshaw herbig94 (1994) and Feretti et al. feretti01 (2001)). All the remaining clusters are part of the GMRT cluster Key Project (P.I. Kulkarni).
In order to obtain a statistically significant sample of clusters
suitable for our aims, we based our selection on the ROSAT–ESO
Flux Limited X–ray (REFLEX) galaxy cluster catalogue
(Böhringer et al. boeringer04 (2004)) and on the extended
ROSAT Brightest Cluster Sample (BCS)
catalogue (Ebeling et al. ebeling98 (1998) & ebeling00 (2000)).
Here we will concentrate on the REFLEX sample, which was
observed with the GMRT in January 2005 (present paper, see next Section),
in October 2005 and August 2006 (Venturi et al., in preparation).
From the REFLEX catalogue we selected all clusters satisfying the following
criteria:
-
1)
LX(0.1–2.4 keV) 5 1044 erg s-1;
-
2)
0.2 z 0.4;
-
3)
30∘ +2.5∘.
The lower limit of was chosen
in order to ensure a good u–v coverage with the GMRT, while the value of
is the REFLEX
upper limit.
The limit in X–ray luminosity is aimed at selecting
massive clusters, which are expected to host giant radio halos
(CBS04, CB05 and references therein). It corresponds to a lower limit
in the virial mass of M
if the LX – MV derived in CBS06 is assumed.
We point out that the LX – MV correlation in CBS06 has
a statistical dispersion
of 30%. This error dominates over the systematic additional
uncertainty introduced by the fact that the correlation was obtained
using the z 0.2 cluster sample in Reiprich & Böhringer
(reiprich02 (2002)).
We obtained a total of 27 clusters. The source list is
reported in Table 1,
where we give (1) the REFLEX name, (2) alternative name from other catalogues,
(3) and (4) J2000 coordinates, (5) redshift, (6) the X–ray luminosity in the
0.1–2.4 keV band, (7) and (8) estimates for the virial mass MV
and virial radius RV respectively (from the
LX – MV correlation derived in CBS06).
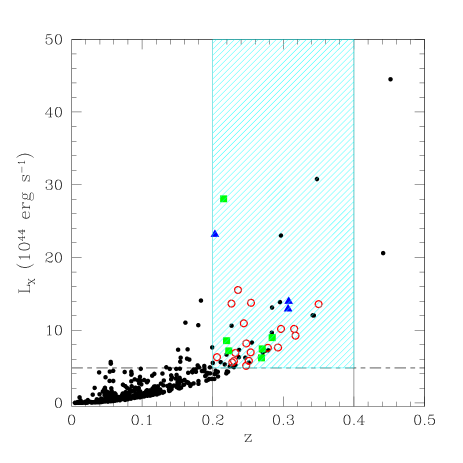
The location of the 27 clusters of the sample in the LX–z
plane for the whole REFLEX catalogue is reported in Fig. 1.
3 Radio observations
From the sample given in Table 1 we selected all clusters
with no radio information available in the literature at the time
our GMRT proposal was written. We also excluded all clusters belonging
to the GMRT Cluster Key Project (P.I. Kulkarni), and remained with
a total of 18 clusters, marked with the symbol in
Table 1.
From the list of marked clusters, 11 were given higher priority and
were observed with the GMRT during a 27–hour run allocated in January 2005.
Table 2 reports the following information: cluster name,
half power beamwidth (HPWB) of the full array of the observations (arcsec),
total time on source (minutes) and rms (1 in Jy b-1)
in the full resolution image.
Five clusters listed in Table 1 were observed with the GMRT in
a second observing run carried out in October 2005, i.e. A 2813, A 2485,
A 2895, RXCJ 1115.8+0129 and RXCJ 1512.2–2254; finally the two remaining
clusters A 2645 and A 2667 will be observed in August 2006.
They will all be presented in a future paper (Venturi et al.
in preparation).
| Cluster | Beam, PA | Obs. time | rms |
|---|---|---|---|
| (full array) , ∘ | min | Jy b-1 | |
| A 2697 | 8.55.0, –83 | 90 | 80 |
| A 141 | 7.77.4, 75 | 150 | 100 |
| A 209 | 8.05.0, 64 | 240 | 60 |
| A 3088 | 8.07.0, 40 | 190 | 65 |
| A 521 | 8.64.0, 57 | 210 | 35 |
| A 3444 | 7.64.9, 19 | 120 | 67 |
| RXCJ 1314.4–2515 | 8.05.0 15 | 150 | 65 |
| S 780 | 7.55.0 25 | 80 | 70 |
| RXCJ 2003.5–2323 | 6.95.0, –3 | 240 | 40 |
| A 2537 | 10.36.0 67 | 150 | 60 |
| A 2631 | 9.26.3 –77 | 240 | 50 |
The observations were carried out at 610 MHz, using simultaneously
two 16 MHz bands (upper side band, USB, and lower side band, LSB),
for a total of 32 MHz. Left and
right polarization were recorded for each band.
The observations
were carried out in spectral line mode, with 128 channels each
band, and a spectral resolution of 125 kHz/channel.
The data reduction and analysis were carried out with the NRAO
Astronomical Image Processing System (AIPS) package.
In order to reduce the size of the dataset, after bandpass calibration
the central 94 channels were averaged to 6 channels of 2 MHz each.
For each source the USB and LSB datasets, as well as the datasets
taken in different days, were calibrated and reduced separately,
then the final images from each individual dataset were combined in the
image plane to obtain the final image. Wide–field imaging
was adopted in each step of the data reduction.
For each cluster we produced images over a wide range of resolutions,
in order to fully exploit the information GMRT can provide.
We point out that the nominal largest detectable structure provided
by the GMRT at 610 MHz is 17′. This value ensures the possible
detection of the extended radio sources we are searching for,
since the angular scale covered by a 1 Mpc–size structure is
at z=0.2 and at z=0.4.
The sensitivity of our
observations (1 level) is in the range 35 – 100 Jy for
the full resolution images (see Table 2), which were
obtained by means of uniform weighting.
The spread in the noise level depends most critically
on the total time on source, on the total bandwidth available (in few
cases only one portion of the band provided useful data,
see individual clusters in §4),
and on the presence of strong sources in the imaged field.
Slightly lower values for the noise level are obtained for the low resolution
images (see Section 4 and figure captions), which were made
using natural weighting.
The average residual amplitude errors in our data are of the order of
5%.
4 Results
| Cluster | Source Type | S | logP | LAS | LLS | L1/L2 |
|---|---|---|---|---|---|---|
| mJy | W Hz-1 | arcmin | kpc | |||
| A 209 | Giant Halo | 24.0 3.6 | 24.46 | 4 | 810 | 2 |
| A 521 | Relic | 41.9 2.1 | 24.91 | 4 | 930 | 4.5 |
| RXCJ 1314.4–2515 | Western Relic | 64.8 3.2 | 25.03 | 4 | 910 | 3 |
| Eastern Relic | 28.0 1.4 | 24.67 | 4 | 910 | 4.3 | |
| Halo | 10.3 0.3 | 24.22 | 2 | 460 | 1.5 | |
| RXCJ 2003.5–2323 | Giant Halo | 96.9 5.0 | 25.49 | 5 | 1400 | 1.3 |
| A 3444 | Central Galaxy | 16.5 0.8 | 24.51 | 0.7 | 165 | 1.4 |
| surrounding Halo | 10.0 0.8 | 24.29 | 1.5 | 350 | 1.4 |
Cluster scale radio emission either in the form of radio halo or relic was detected in 4 clusters of the sample (§4.1); in one cluster extended emission was found around the dominant galaxy (§4.2); for the remaining six clusters no hint of extended emission is present at the sensitivity level of the observations (§4.3). Details on each cluster are given in this Section. In Appendix A we report the 610 MHz radio contours within the virial radius for all the observed clusters. All the images were convolved with a HPWB of 15.0, except for A2̇09, RXCJ 1314.4–2515 and RXCJ 2003.5–2323 where a different resolution was chosen in order to complement the information provided in Figs. 2, 3, 4, 5 and 6. Table 3 reports the observational information for the detected cluster–scale radio sources. The last column in the table, L1/L2, provides the ratio between the major (LAS) and minor axis of the extended emission. The linear size and flux densities were derived from the 3 contour level.
4.1 Clusters with halos, giant halos and relics
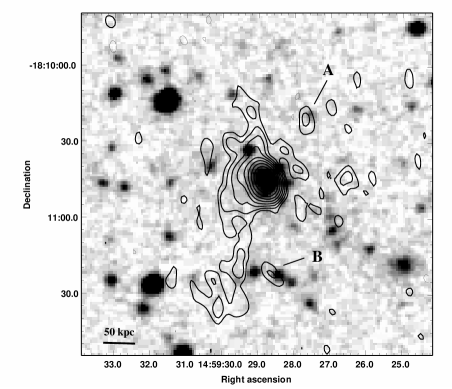
4.1.1 Abell 209
Abell 209 (RXCJ 0131.8–1336) is a richness R=3 cluster at
z=0.2060 (1′′=3.377 kpc). A high
X–ray temperature is reported in the literature.
Rizza et al. (rizza98 (1998)) estimated a mean gas
temperature of kT10 keV from the ROSAT
X–ray luminosity; this
value was confirmed by Mercurio et al. (2004a )
from the analysis of Chandra archive data.
The cluster has been extensively studied at optical (Mercurio et al.
mercurio03 (2003), Mercurio et al. 2004a and 2004b ,
Haines et al. haines04 (2004)), and X–ray wavelenghts (ROSAT–HRI,
Rizza et al. rizza98 (1998), Mercurio et al. 2004a ).
These studies show that A 209 is far from a relaxed dynamical stage, and
it is undergoing a strong dynamical evolution.
In particular the X–ray and the optical data suggest that A 209 is
experiencing a merging event between two or more components.
Mercurio et al. (mercurio03 (2003)) provided an estimate of the virial
mass of the cluster, ,
consistent with our estimate given in Table 1 if we account for the
uncertainty of our value (see Sect. 2).
The cluster merging scenario is confirmed by the weak lensing analysis
carried out by Dahle et al. (dahle02 (2002)), who found two significant peaks
in the mass distribution of the cluster: the largest one is close to the central
cD galaxy, and the secondary mass peak is located at about 5 arcmin
north of the cluster centre and associated to a peak in the optical galaxy
distribution.
610 MHz contours of the A 209 emission within the virial radius
are given in Fig. 11, while Fig. 2
shows the central part of the field at two different resolutions
superposed on the POSS–2 image. Inspection of Fig. 11
and of the right panel in Fig. 2
coupled with flux density measurements, suggests the presence
of extended emission around the individual central cluster
radio galaxies.
In order to highlight such emission we subtracted all the individual
sources visible in the full resolution image from the u–v data, and
convolved the residuals with a
HPBW with size .
The image is reported in Fig. 3.
The adopted procedure indeed confirms the existence of cluster
scale extended emission. The possible presence of a radio halo in
A 209 was suggested by Giovannini et al. (giovannini99 (1999))
from inspection of the NRAO VLA Sky Survey (NVSS), and confirmed
in Giovannini et al. (gg06 (2006)) on the basis of 1.4 GHz VLA observations.
Our GMRT image in Fig. 3
is in partial agreement with the size and morphology of the VLA 1.4 GHz
image shown by those authors. The largest angular size (LAS)
is , i.e. 810 kpc, therefore
we classify the source as a giant radio halo. Its total
flux density, measured after subtraction of the individual radio sources
(see left panel of Fig. 2) is
S mJy, which implies a total radio power of
logP (W/Hz)= 24.46.
The difficulty in subtracting the extended individual sources (in particular
the head–tail radio galaxy located just South of the cluster centre) reflects
both in the large error associated with the flux density measurement,
and in the unusual brightness distribution of the radio halo, characterised
by two peaks of emission.
Further observations are already in progress with the GMRT, in
order to better image and study this source.
4.1.2 Abell 521
A detailed study of A 521 (RXCJ 0454.1–1014, z=0.2475, 1′′=3.875 kpc) has already been published by Giacintucci et al. (giacintucci06 (2006)). This merging cluster hosts a radio relic located at the border of the X–ray emission. We discussed the origin of this source in the light of current scenarios for the formation of radio relics, i.e. acceleration of electrons from the thermal pool or compression of fossil radio plasma, both through merger shock waves. We refer to that paper for the images and radio information and will include A 521 in the discussion in Section 5. All values and observational parameters reported in Table 2 and 3 are taken from Giacintucci et al. (giacintucci06 (2006)).
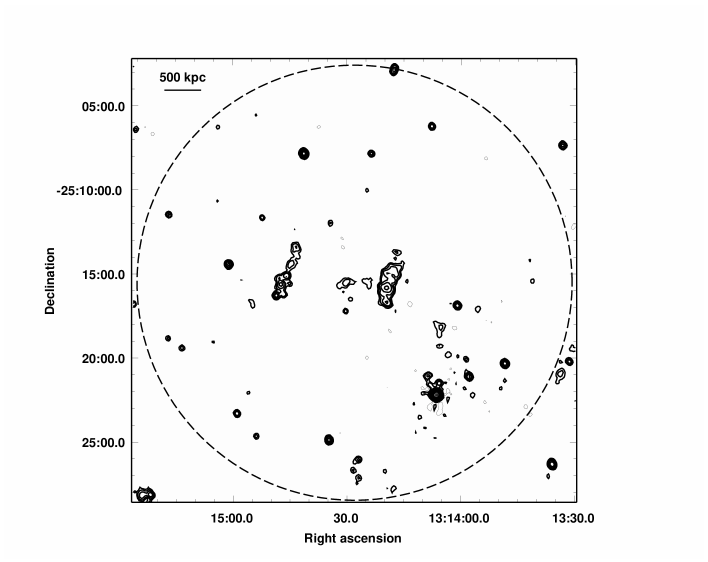
4.1.3 RXCJ 1314.42515
Evidence of a disturbed dynamical status for the cluster
RXCJ 1314.42515 (z=0.2439, 1′′=3.806 kpc)
is reported in the literature. The redshift distribution of the
cluster galaxies clearly shows a bimodal structure,
with two peaks separated in velocity space by 1700 km s-1
(Valtchanov et al. valtchanov02 (2002)). The X–ray morphology of the
cluster is also bimodal, and it is elongated along the
E–W direction, the western peak being the brightest
(Valtchanov et al. valtchanov02 (2002)).
This cluster was observed with the VLA at 1.4 GHz by Feretti
et al. (feretti05 (2005)), who revealed the presence of a radio halo at the
cluster centre and two peripheral sources, which they classified as relics.
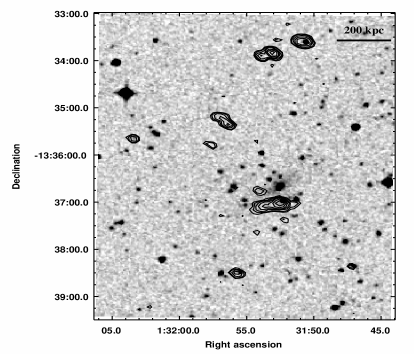
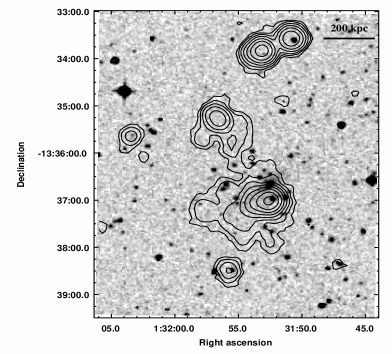
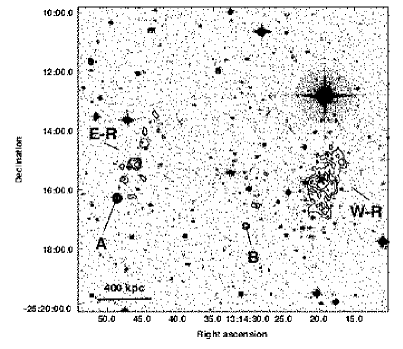
Fig. 12 reports the contour image of our 610 MHz
observations at the resolution of within the virial radius. The central part
of the cluster is given in the left and right panel of
Fig. 4, both superposed on the POSS–2 plate.
The left panel shows the full resolution image,
while in the right panel lower resolution contours are displayed.
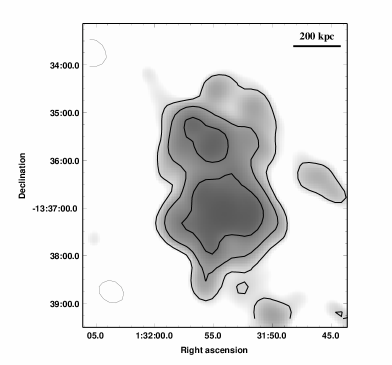
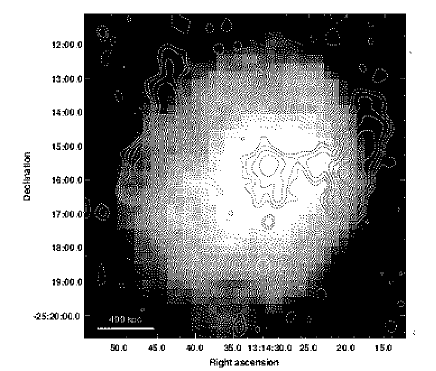
Fig. 5 shows the same region
overlaid on the X–ray ASCA image.
Our images confirm that RXCJ 1314.4–2515 has a complex radio morphology,
with the presence of three different regions of extended emission on the cluster
scale.
Two parallel features are easily visible in Figs. 12,
4 and 5.
They are separated by and extend in the SE–NW direction
for approximately 4′ (i.e. 910 kpc at the cluster redshift).
The remarkable superposition of the low resolution radio image with the
ASCA image in Fig. 5 clearly
shows that these two sources are located at the border of the detected
X–ray emission.
The overall morphology of these two features, coupled with their
location with respect to the intracluster gas, suggest that they
are radio relics, as also discussed in Feretti et al. (feretti05 (2005)),
who ruled out any association with individual galaxies.
In the following we will
refer to the eastern and the western relics as E–R and
W–R respectively, as also labelled in Fig.
4.
The morphology and flux density ratio of the two relics are
consistent with the 1.4 GHz data in Feretti et al. (feretti05 (2005)).
Their flux densities at 610 MHz are S mJy and
S mJy for W–R and E–R respectively.
The value given for E–R does not include the southernmost pointlike source
A (Fig. 4).
In order to derive the total spectral index of W–R and E–R between
1.4 GHz and 610 MHz we included also the contribution of source A to the
flux density of
E–R, for a consistent comparison with Feretti et al. (feretti05 (2005)), and
obtained 32.8 mJy. Our flux density measurements lead to the same
value for the spectral index in both features. In particular,
(W–R) = 1.40 0.09 and
(E–R) = 1.41 0.09.
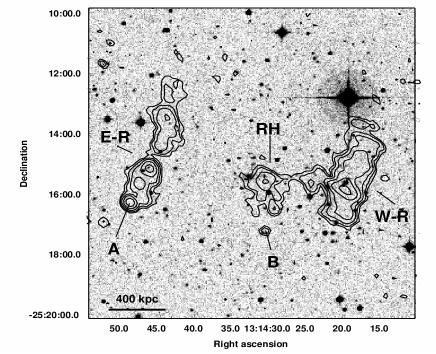
Figs. 4 (right panel)
and 5
show that extended emission is present in the region between
W–R and E–R, consistent with the 1.4 GHz VLA images in Feretti
et al. (feretti05 (2005)), who classified
this feature as a radio halo. This source is referred to as RH in the right
panel of Fig. 4. It is spatially coincident with the
bulk of the optical galaxies (see Valtchanov et al. valtchanov02 (2002)) and
its largest angular size is , corresponding to 460 kpc,
i.e. it is not a giant radio halo.
The radio halo seems to blend with the emission of the western relic
W–R, however it is difficult to say whether this is a true feature, since
projection effects are likely to play a role. Given the different
polarisation properties of radio halos and relics, polarisation information
would be necessary to investigate this issue.
We measured a flux density of S mJy for the
radio halo. No spectral index estimate between 610 MHz and 1.4 GHz can be
derived, due to the lack of a flux density value
at 1.4 GHz (Feretti et al. feretti05 (2005)).
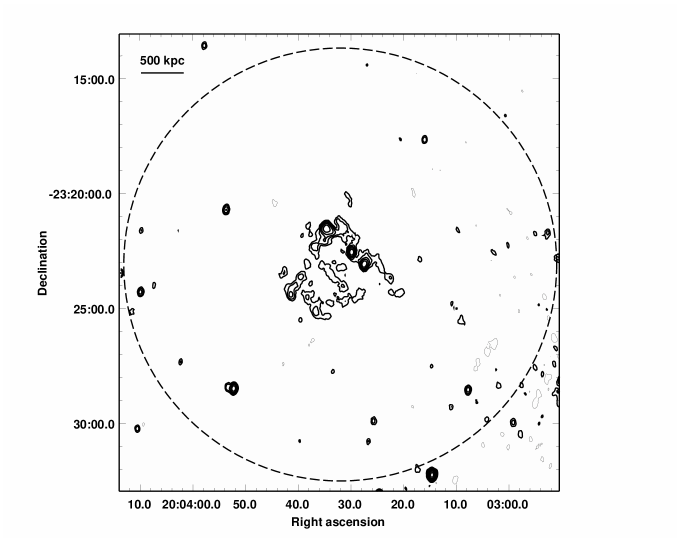
4.1.4 RXCJ 2003.5–2323
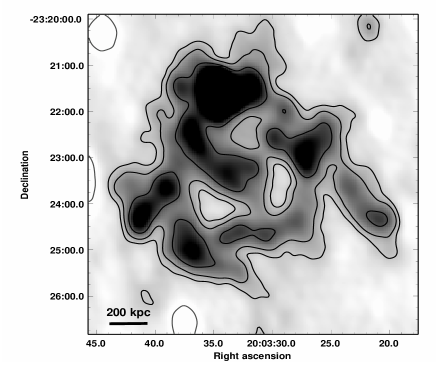
RXCJ2003.5–2323 is the most distant cluster in our
sample, with z=0.3171 (1′′=4.626 kpc).
Little information is available in the literature.
The ROSAT All Sky Survey (RASS) image shows that the X–ray emission
is elongated along the NW–SE direction, which
might suggest a disturbed dynamical status for RXCJ 2003.5–2323.
Our GMRT 610 MHz observations show that it is the most striking
cluster among those observed thus far.
It hosts a giant radio halo, one of the largest known up to date.
Its largest angular size is , corresponding to
1.4 Mpc.
Hints of the presence of this very extended radio halo were clear
already from inspection of the NRAO VLA Sky Survey (NVSS).
The cluster radio emission within the cluster virial radius
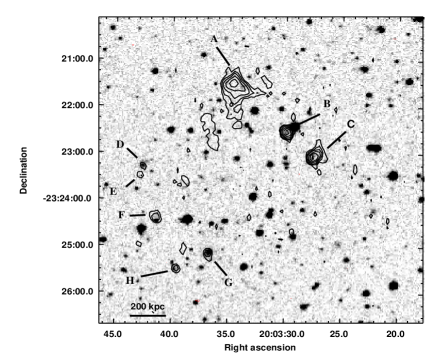
is given in Fig. 13. The central part of the cluster is
shown in Fig. 6.
The left panel shows a full resolution image
superposed to the POSS–2 optical image, to highlight the individual sources
(labelled from A to H). The sources with a clear optical counterpart (B to H) were
subtracted from the u–v data when producing the image shown in the right panel
of Fig. 6, which we convolved with a larger beam
in order to highlight the low surface brightness emission. We did not subtract
A, since no optical counterpart is visible on the POSS–2, therefore we
consider this feature as a peak in the radio halo emission.
One of the most striking features of this giant radio halo
is its complex morphology:
clumps and filaments are visible on angular scales of the
order of (clumps) and (filaments),
as clear from Figures 13 and
6 (right panel).
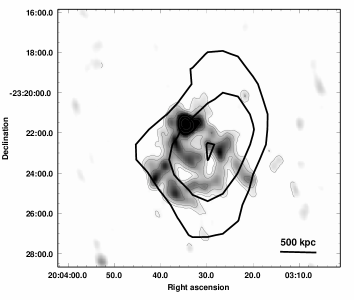
Unfortunately no deep X–ray images are available for this cluster,
therefore a combined radio and X–ray analysis cannot be carried out.
The only information we can derive from the RASS image of the cluster is
that the whole radio emission from the halo is embedded within the X–ray
emission, as shown in Fig. 7.
The total flux density of the radio halo (after subtraction of the point
sources) is S mJy, corresponding to
logP (W/Hz) = 25.49.
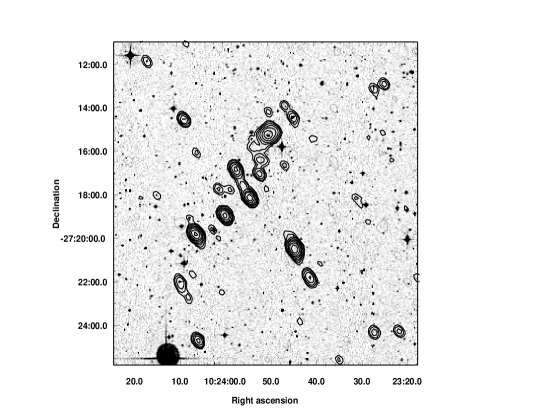
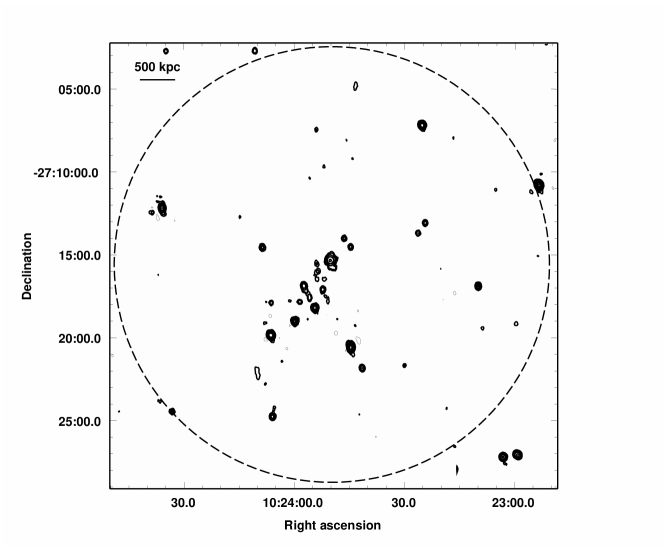
4.2 Candidate extended emission in Abell 3444
Abell 3444 (RXCJ 1023.82715, z=0.2542, 1′′=3.924 kpc) was
indicated as possible cooling core cluster
by Lémonon (lemonon99 (1999)) and Matsumoto (matsumoto01 (2001)) on the basis
of the analysis of ASCA data, though at limited significance.
The X–ray ASCA image shows that the inner part of the cluster is elongated
along the SE–NW direction.
No radio information is reported in the literature. Unfortunately, due to
calibration problems, we could use only the USB of our dataset to image
this cluster. Our GMRT 610 MHz image
of the radio emission within the cluster virial radius is reported
in Fig. 14, and shows that the radio emission is dominated by a
chain of individual sources, all with optical counterpart from the POSS–2.
The alignment of the chain of radio galaxies is in agreement with the inner
elongation of the archive ASCA X–ray image.
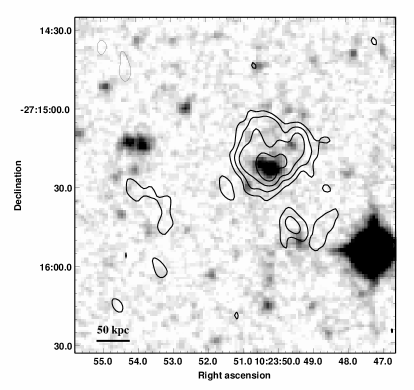
A radio–optical overlay of the central part of the field is given
in Fig. 8 (Left). The extended radio galaxy at
the north–western end of the chain is associated with the dominant
cluster galaxy (right panel in Fig. 8).
Its morphology is complex. Bent emission in the
shape of a wide angle tail is clear in the inner part of the source,
surrounded by extended emission. At least a couple of
very faint objects are visible in the same region of the extended
radio emission, so it is unclear if we are dealing with extended
emission associated with the dominant cluster galaxy, or if this
feature is the result of a blend of individual sources.
Under the assumption that all the emission detected within the
3 contour (left panel of Fig. 8) is associated
with the dominant cluster galaxy, we measured a flux density
S mJy,
which corresponds to logP(W/Hz) = 24.51. The largest
angular size of the radio source is , hence
the linear size is 165 kpc.
Both panels of Fig. 8 suggest that emission on
a larger scale may be present around the central radio source. Indeed
we measured a flux density of S mJy on
an angular scale of , i.e. 350 kpc.
This situation is reminiscent of the class
of core–halo sources, where extended emission surrounds a radio
component obviously associated with a galaxy.
Core–halo sources are usually located in cooling core clusters.
Some well–known examples are 3C 317 (Zhao, Sumi & Burns zhao93 (1993)),
3C84 (Böhringer et al. boeringer93 (1993)), PKS 0745–191 (Baum &
O’Dea baum91 (1991)).
4.3 Galaxy clusters without extended emission
For the remaining six clusters our 610 MHz GMRT observations did not show any indication of possible extended emission at the noise level of the final images.
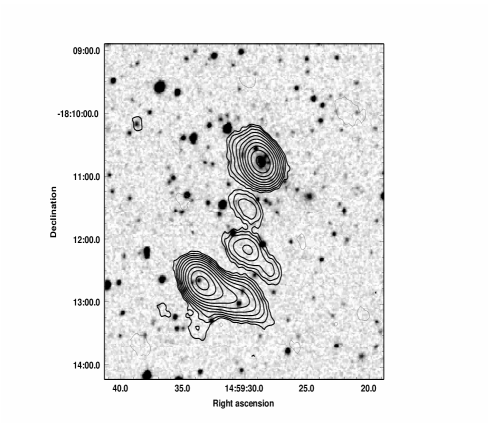
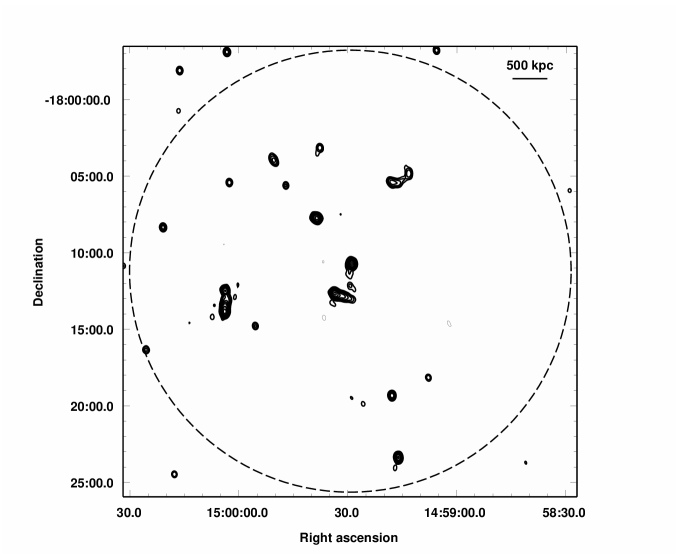
4.3.1 S 780
S 780 (RXCJ 1459.4–1811, z=0.2357, 1′′=3.952 kpc) is
the most X–ray luminous and most massive cluster
among those presented in this paper.
No information is available in the literature.
Inspection of the ROSAT archive indicates that the X–ray emission
is elongated in the E–W direction.
Fig. 15 reports the 610 MHz contours of the S 780 field
within the virial radius.
The radio emission from S 780 is typical of a very active cluster,
with a number of cluster–type radio galaxies.
Beyond the dominant central radio source, one head–tail radio
galaxy is clearly visible close to the cluster centre, one wide–angle tail
is located at from the cluster centre (well within
the virial radius) and one FRII radio galaxy (Fanaroff & Riley fr74 (1974))
with distorted jets is located at from the cluster centre
(in the S–E direction). A few more radio
sources in the cluster field are optically identified.
A visual inspection of the optical counterparts of all these radio sources
suggests they have similar optical magnitudes.
Radio–optical overlays are given in Fig. 9. The
left panel shows the central part of the cluster superposed on the
POSS–2 optical frame, and the right panel is a high resolution zoom of
the central cluster galaxy. The radio galaxy shows a compact component
coincident with the nucleus of the associated galaxy, extended emission
in the eastern direction and a filament aligned South–East.
The total angular size is , corresponding to
a largest linear size LLS 200 kpc. The flux density is
S mJy, i.e.
logP(W/Hz) = 25.32. Sources A and B highlighted in the right
panel of Fig. 9 were not included in the flux density
measurement. The flux density of the filament just South of the central
radio source is S.
No indication of residual flux density is present in the cluster centre.
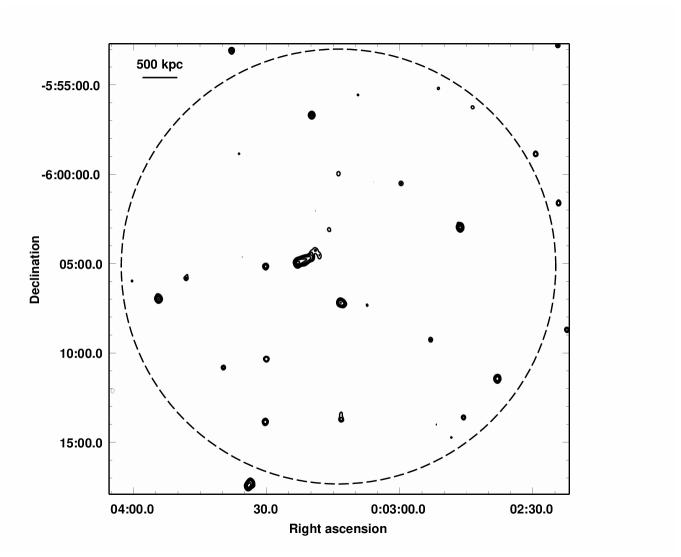
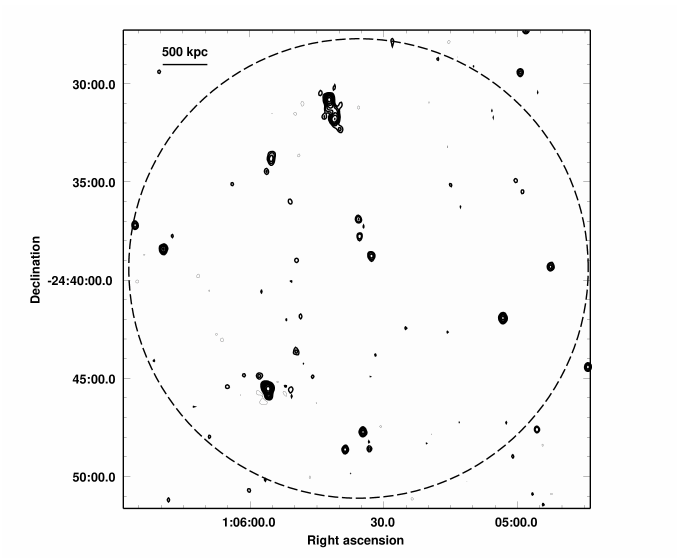
4.3.2 Abell 2697
Very little information is available in the literature for
A 2697 (RXCJ 0003.1–0605, z=0.2320, 1′′=3.698 kpc).
Archive X–ray ROSAT and ASCA images show that the hot intracluster
gas has a fairly regular distribution.
For this cluster only one portion of the band (USB) was available. We
imaged the cluster in a range of resolutions,
reaching a 1 noise level of
Jy b-1 in each image.
The radio field is dominated by a head–tail galaxy.
Radio contours are reported in Fig. 16 in the Appendix.
No cluster–type extended feature is visible at the sensitivity
level of the images, and no significant flux density from positive
residuals was found by integrating over a wide region of the
cluster centre.
4.3.3 Abell 141
The X–ray emission of A 141 (RXCJ 0105.5–2439, z=0.2300,
1′′=3.674 kpc) is bimodal. The archive X–ray ROSAT
images show that the North–South elongation of the ASCA image is the
result of two components, the northern one being the brightest and
largest. The same orientation was found also in the
distribution of the cluster galaxies by Dahle et al. (2002), who concluded
that the overall optical analysis is suggestive of recent
merger activity. Those authors reported also evidence of weak lensing.
High resolution radio imaging aimed at the detection of cluster radio
galaxies was carried out with the VLA–A at 1.4 GHz by Rizza et al.
(rizza03 (2003)).
For this cluster only one portion of the observing band (USB) was
available.
Our GMRT observations of A 141 revealed neither the presence of diffuse
emission at the level of Jy b-1, nor unusually high residuals.
Radio contours are reported in Fig. 17 in the Appendix.
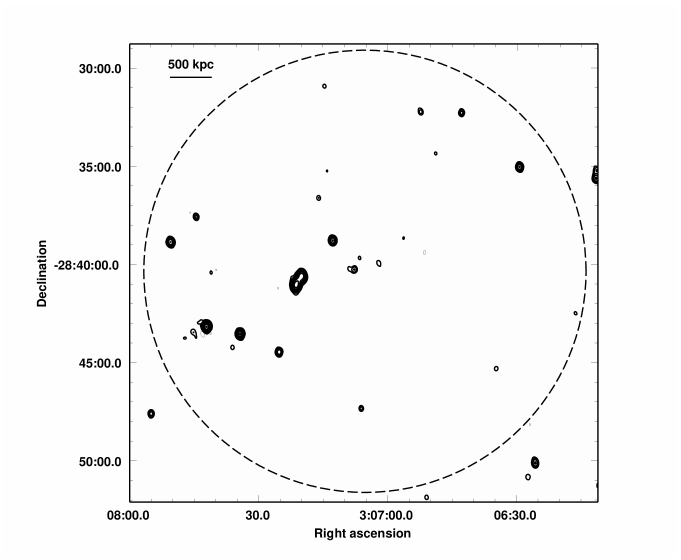
4.3.4 Abell 3088
Very little information is available in the literature for
A3088 (RXCJ 0307.02840, z=0.2537, 1′′=3.952 kpc).
It is a richness 2 galaxy cluster with a
very regular and symmetric X–ray morphology. On the basis of XMM–Newton
observations, Zhang et al. (zhang06 (2006)) reported a gas temperature
kT=6.40.3 keV and classified it as a “single dynamical state” cluster
with a cooling core (Finoguenov, Böhringer & Zhang finogue05 (2005)).
Our GMRT 610 MHz observations show that the field has only a few radio sources,
with a lack of positive residual flux density in the central cluster region
and no hints of diffuse emission from the cluster at the detection level
of our images, i.e 1Jy b-1.
Contours of the radio emission within the cluster virial radius
are shown in Fig. 18.
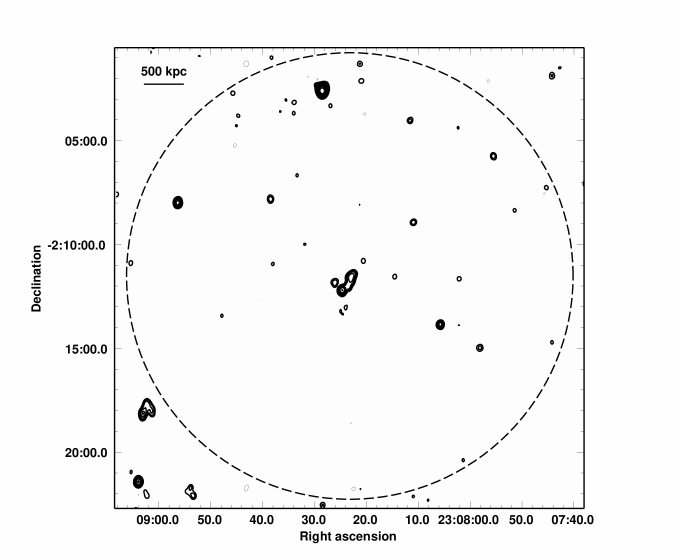
4.3.5 Abell 2537
Little information is available in the literature for
A 2537 (RXCJ 2308.2–0211, z=0.2966, 1′′=4.419 kpc).
Archive HST observations show the presence of several red and blue arcs,
and Dahle et al. (dahle02 (2002)) report evidence of weak lensing.
The cluster was observed in the X–ray band by XMM–Newton
and was classified as “single dynamical state”, with gas temperature
kT=7.90.7 KeV (Zhang et al. zhang06 (2006)).
A secondary X–ray peak is present at from the
cluster gas concentration.
For this cluster only the USB provided useful data.
The 610 MHz radio emission from the cluster, shown in Fig. 19
is dominated by a tailed radio galaxy located at the cluster centre.
Very few other radio sources are detected above the 5 level of
the image. No hint of extended emission is present in the field
at the level of Jy b-1 (1), and no
high positive flux density residuals were detected over the central
cluster region.
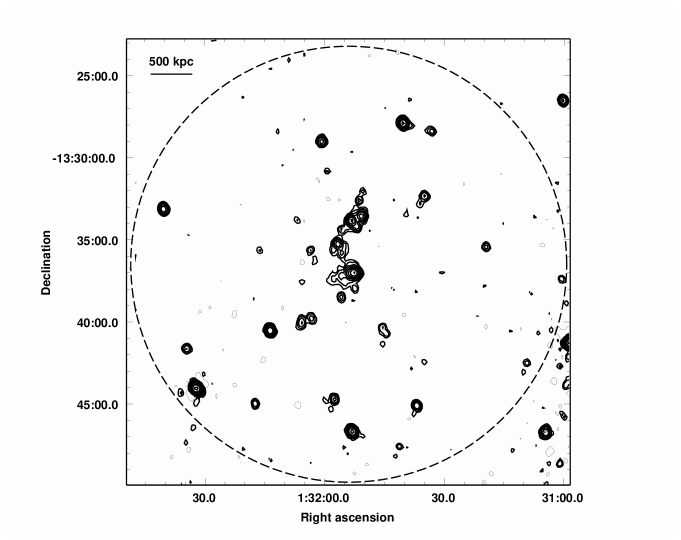
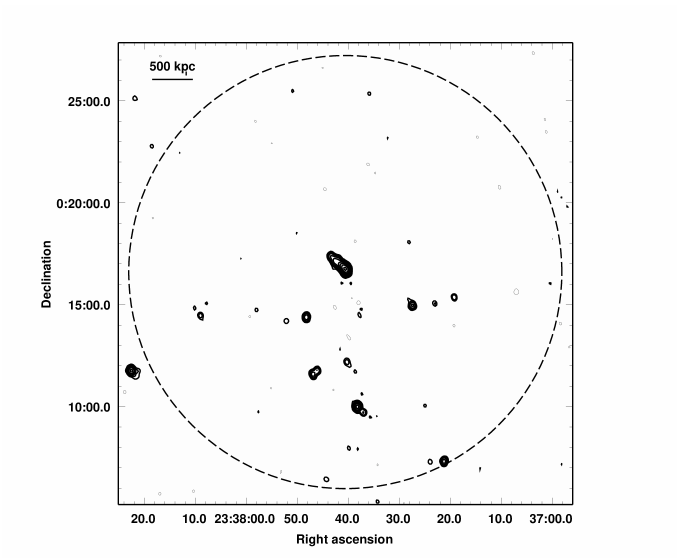
4.3.6 Abell 2631
Little information is available in the literature for the rich cluster
A 2631 (RXCJ 2337.6+0016, R=3, z=0.2779, 1′′=4.221 kpc).
Archive ROSAT X–ray images are available for A 2631, which show a
complex morpholgy. Based on XMM–Newton observations Zhang et al.
(zhang06 (2006)) classified it as “offset centre”, with varying
isophote centroids on different angular scales, and reported
a gas temperature kT=9.60.3 KeV. Finoguenov et al. (finogue05 (2005))
interpret the XMM properties of this cluster in terms of a late stage
of a core disruption.
The cluster was observed with the VLA–A at 1.4 GHz
(Rizza et al. rizza03 (2003)).
Our GMRT observations of this cluster were spread over two days,
however on both days only one portion of the band (USB) was available.
The 610 MHz radio emission of A 2631 within the virial radius is
shown in Fig. 20. It is dominated by a central
tailed radio galaxy and all the remaining sources above the 5
level are located South of the cluster centre. No signs of extended emission
are present in the field at the rms level of Jy b-1
(1), and no positive residuals were found by integrating over the
central region of the cluster.
5 Discussion and conclusions
Our 610 MHz GMRT radio halo survey has been designed in
order to statistically investigate the connection
between cluster merger phenomena and the presence of cluster–scale
radio emission. In particular, our main goal is to derive the fraction
of massive clusters (i.e. ) with
giant radio halos in the redshift range 0.2z0.4, in order to constrain
the expectations made by CBS04 and CB05 in the framework of the
particle re–acceleration model.
The total cluster sample consists of two sub–samples of massive clusters
extracted from the REFLEX and extended BCS catalogues, and includes a total
of 50 clusters.
The cluster sample presented here (see Table 1) includes 27 REFLEX
clusters, eleven of which were observed in a first run of GMRT observations
carried out in January 2005. If we consider the literature data, information
is now available for 15 of the 27 objects.
The most relevant results we obtained, as well as the status of the observations for
the remaining clusters in the sample are summarized below.
-
(a)
Two new giant radio halos were found, i.e. A 209 (also reported in Giovannini et al. gg06 (2006) while this paper was in preparation), and RXCJ 2003.5–2323, discovered with the present 610 MHz GMRT observations.
-
(b)
A radio halo (LLS460 kpc) was found in RXCJ 1314.4–2515.
-
(c)
Two relics were found in the cluster RXCJ 1314.4–2515, and one in A 521 (Giacintucci et al. giacintucci06 (2006)). These three relics are impressive structures. Their largest linear size is of the order of the Mpc, which suggests that particle acceleration, most likely related to the hierarchical formation of clusters and accretion processes, might be required to account for their formation (e.g. Ensslin & Brüggen eb02 (2002)). The relic in A 521 has already been studied in detail. Here we just wish to mention that RXCJ 1314.4–2515 is the third galaxy cluster known to date hosting two relics, after A 3667 (Roettiger, Burns & Stone roetti99 (1999); Johnston–Hollitt et al. jh02 (2002)) and A 3376 (Bagchi et al. bagchi06 (2006)). Furthermore, it is unique in hosting two relic sources and one radio halo, and hence a challenge for our understanding of the connection between radio halos, relics and the physics of cluster mergers.
-
(d)
Extended emission on smaller scale (of the order of kpc) was detected around the dominant galaxy in A 3444, whose radio morphology and monocromatic power are similar to those of core–halo radio galaxies found at the centre of cooling core clusters.
- (e)
-
(f)
No extended emission of any kind was detected at the level of 50 – 100 Jy b-1 in six of the 11 clusters observed by us and presented here.
-
(g)
The cluster RXCJ 0437.1+0043 is known not to host extended emission, based on low resolution 1.4 GHz VLA observations (Feretti et al. feretti05 (2005)).
-
(h)
Five clusters were observed by us in October 2005, two more will be observed in August 2006, and they will be presented in a future paper (see Sect. 3).
-
(h)
The remaining 5 clusters are being observed by other authors (GMRT Cluster Key Project, P.I. Kulkarni) and no literature information is available thus far.

In Fig. 10
we show the location of the giant radio halos in A 209 and
RXCJ 2003.5–2323 in the log LX – log(P) plane,
where all the previously known clusters with giant radio halos are also
reported (see CBS06 and references therein for the literature data).
The radio power at
1.4 GHz for these two clusters was obtained scaling the measured flux density
at 610 MHz with a spectral index (the uncertainty assumed here dominates over the 610 MHz
flux density error). Clusters at z0.2 and those at z0.2 are shown with
different symbols. Despite some overlap, the most powerful radio halos are
hosted in the most X–ray luminous clusters, which are also the most distant.
The location of A 209 and RXCJ2003.5–2323 on the plot is in good agreement
with the distribution of all giant radio halos known in the literature.
An important piece of information would be the knowledge of the
merging stage of the clusters in the sample, since cluster merger is a major
ingredient in the re–acceleration model.
The literature information on the clusters presented here is not
homogenous, and it is not possible to make conclusive statements
on the connection between merging/non–merging signatures and the
presence/absence of radio halos. A 209 is known to be undergoing merging
events, but no information is available for RXCJ 2003.5–2323, except
for the elongated X–ray emission imaged by ROSAT. The three
radio halo clusters known from the literature are all reported to
be dynamically active
(see for instance Zhang et al. zhang06 (2006) and Finoguenov et
al. finogue05 (2005)). Signature
of cluster merger is present in the optical and X–ray bands
for A 521 (Giacintucci et al. giacintucci06 (2006) and references therein)
and RXCJ 1314.4–2515, which host extended radio
emission in the form of radio halo and relics. Elongated or more
complex X–ray isophotes are visible in S 780, A 141, A 2631
and in RXCJ 0437.1+0043, which lack cluster scale
radio emission.
The remaining two clusters without extended emission are considered
“relaxed” on the basis of the X–ray emission
To summarize, the optical and X–ray information for the sample of
clusters presented here is not inconsistent with the findings that clusters
with radio halos are characterised by signatures of merging processes.
On the other hand, clusters without extended radio emission may or may not
show dynamical activity at some level.
This crucial issue will be further investigated in future works.
In the framework of the canonical particle re–acceleration model
giant radio halos are believed to be essentially
an on/off phenomenon, triggered by dissipation via collisionless
damping of turbulence injected during cluster mergers.
The physics of collisionless turbulence and of particle acceleration is
still poorly understood and many hidden ingredients could be of relevance
in computing the efficiency of the particle acceleration processes
in the ICM.
On the other hand, from simple energetic arguments,
it is clear that the possibility to develop a giant radio halo
is related to the efficiency of turbulence injection and to the
possibility to generate large enough (Mpc sized) turbulent cluster
regions. In this respect, the calculations in CBS04, CB05 and more recently
in CBS06 show that major cluster mergers (i.e. with mass ratio of the
order 5:1) between massive clusters (MM⊙) may
provide the necessary ingredients to develop giant radio halos.
During these mergers a fraction of up to of the cluster
thermal energy is believed to be injected in a region.
However, from a theoretical point of view, it is hard to predict if a
particular merging
clusters may host a giant radio halo, since this depends
on a number of parameters which cannot be easily estimated.
For instance, in order to have enough time for the turbulence injected
on large scales to cascade down to collisionless scales, it is necessary
that seed relativistic particles (to be reaccelerated) are present
in the turbulent ICM, and that the magnetic field in the ICM is strong
enough to allow GeV electrons to emit synchrotron radiation at the
observed frequency.
The statistical approach developed in CBS04, CB05 and CBS06 allows
a more reliable estimate of the fraction of clusters hosting a giant
radio halo.
Without going into the calculation details, the most
relevant result in the light of those papers is that the
fraction of galaxy clusters with mass
and redshift
expected to host a giant radio halo is in the range
.
In addition, CBS06 showed that the cluster magnetic field plays
an important role, and that this fraction depends
the scaling law between the magnetic field and cluster mass.
Radio information is now available for 15 of the 27
clusters considered in this paper, and 5 of them possess a giant radio
halo. However, at this stage of our work the statistics are still poor,
and no firm comparison with theoretical expectations can be reached.
For this reason our analysis, in the light of
the predictions made in CB05 and CBS06, will be carried out as soon
as the information on the whole selected sample (REFLEX and BCS) is
completed (Venturi et al. in prep.; Cassano et al in prep.).
Acknowledgements.
We thank the staff of the GMRT for their help during the observations.
GMRT is run by the National Centre for
Radio Astrophysics of the Tata Institute of Fundamental Research.
T.V. and S.G. acknowledge partial support from the Italian Ministry
of Foreign Affairs. G.B., R.C. and G.S. acknowledge partial support
from MIUR grants PRIN2004 and PRIN2005.
Appendix A Radio Images
In this appendix we report the 610 MHz radio contours of all the observed clusters in the present project. The images cover the region within the cluster virial radius. The resolution is 15.0 in all the images, except for A209, RXCJ 1314.4–2515 and RXCJ 2003.5–2323 (see figure caption).
References
- (1) Bacchi, M., Feretti, L., Giovannini, G., et al., 2003, A&A, 400, 465
- (2) Bagchi, J., Durret, F., Lima Neto, G.B., et al., 2006, in 29th International Cosmic Ray Conference, in press (astro–ph/0508013)
- (3) Baum, S.A., & O’Dea, C.P., 1991, MNRAS, 250, 737
- (4) Blasi, P., 2004, JKAS, 37, 483
- (5) Böhringer, H., Voges, W., Fabian, A.C., et al., 1993, MNRAS, 264, 25
- (6) Böhringer, H., Schuecker, P., Guzzo, L., et al., 2004, A&A, 425, 367
- (7) Brunetti, G., Setti, G., Feretti, L., et al., 2001, MNRAS, 320, 365
- (8) Brunetti, G., 2003, in Matter and Energy in Clusters of Galaxies, ASP Conf. Ser. Vol. 301, Eds. Bowyer S. & Hwang C.–Y., Astron. Soc. Pac., San Francisco, p. 349
- (9) Brunetti, G., Blasi, P., Cassano, R., et al., 2004, MNRAS, 350, 1174
- (10) Brunetti, G., 2004, JKAS, 37, 493
- (11) Buote, D.A., 2001, ApJ, 553, 15
- (12) Cassano, R., Brunetti, G., & Setti, G., 2004, JKAS, 37, 589 (CBS04)
- (13) Cassano, R., & Brunetti, G., 2005, MNRAS, 357, 1313 (CB05)
- (14) Cassano, R., Brunetti, G., & Setti G., 2006, MNRAS, 369, 1577 (CBS06)
- (15) Dahle, H., Kaiser, N., Irgens, R.J., et al., ApJS, 139, 313
- (16) Ebeling, H., Edge, A.C., Böhringer, H., et al., 1998, MNRAS, 301, 881
- (17) Ebeling, H., Edge, A.C., Allen, S.W., et al., 2000, MNRAS, 318, 333
- (18) Ensslin, T.A., & Brüggen, M., 2002, MNRAS, 331, 1011
- (19) Ensslin, T.A., 2004, JKAS, 37, 439
- (20) Fanaroff, B.L., & Riley, J.M, 1974, MNRAS, 167, 31
- (21) Feretti, L., Fusco–Femiano, R., Giovannini, G., et al., 2001, A&A, 373, 106
- (22) Feretti, L., Gioia, I.M., & Giovannini, G., 2002, Merging Processes in Galaxy Clusters, ASSL, Vol. 272
- (23) Feretti, L., 2003, XXI Symposium on Relativistic Astrophysics, Eds. R. Bandiera, R. Maiolino & F. Mannucci, World Scientific Publishing, p. 209
- (24) Feretti, L., Schuecker, P., Böhringer, H., et al., 2005 A&A, 444, 157
- (25) Finoguenov, A., Böhringer, H., & Zhang, Y.–Y., 2005 A&A, 442, 827
- (26) Fujita, Y., Tazikawa, M., & Sarazin, C.L., 2003, ApJ, 584, 190
- (27) Giacintucci, S., Venturi, T., Bardelli, S., et al., 2006, New Astron., 11, 437
- (28) Giovannini, G., Tordi, M., & Feretti, L., 1999, New Astron., 4, 141
- (29) Giovannini, G., & Feretti, L., 2002, in Merging Processes in Galaxy Clusters, Eds. L. Feretti, I.M. Gioia & G. Giovannini, ASSL, 272, 197
- (30) Giovannini, G., & Feretti, L., 2004, Journal of Korean Astr. Soc., Vol. 37, N. 5, p.323
- (31) Giovannini, G., Feretti, L., Govoni, F., et al., in Origin and Evolution of Cosmic Magnetism, 2006, Astron. Nachr., 327, 563
- (32) Govoni, F., Feretti, L., Giovannini, G., et al., 2001, A&A 376, 803
- (33) Haines, C.P., Mercurio, A., Merluzzi, P., et al., 2004, A&A, 425 783
- (34) Herbig, T. & Birkinshaw, M., 1994, BAAS, 26, 1403
- (35) Hwang, C.–Y., 2004, JKAS, 37, 461
- (36) Johnston–Hollitt, M., Clay, R.W., Ekers, R.D, et al., 2002, in The Universe at Low Radio Frequencies, IAU Symp. 199, Eds. A. P. Rao, G. Swarup & Gopal–Krishna, p. 157
- (37) Kempner, J.C., & Sarazin, C.L., 2001, ApJ, 548, 639
- (38) Lèmonon, L., Ph.D. Thesis, 1999, Université de Paris XI
- (39) Matsumoto, H., Pierre, M., Tsuru, T.G., et al., 2001, A&A, 374, 28
- (40) Mercurio, A., Girardi, M., Boschin, W., et al., 2003, A&A 397, 431
- (41) Mercurio, A., PhD thesis, 2004a, University of Trieste, astro–ph/0412077
- (42) Mercurio A., Busarello, G., Merluzzi, P., 2004b, A&A 424, 79
- (43) Petrosian, V., 2001, ApJ, 557, 560
- (44) Reid, A.D., Hunstead, R.W., Lemonon, L., et al., 1999, MNRAS, 302, 571
- (45) Reiprich, T.H., & Böhringer, H., 2002 ApJ, 567, 716
- (46) Rizza, E., Burns, J.O, Ledlow, M.J, et al., 1998, MNRAS, 301, 328
- (47) Rizza, E., Morrison, G.E., Owen, F.N., et al., 2003, ApJ, 126, 119
- (48) Roettiger, K., Burns, J.O., & Stone, J.M., 1999, ApJ, 518, 603
- (49) Sarazin, C.L., in Merging Processes in Galaxy Clusters, Eds. L. Feretti, I. Gioia & G. Giovannini, ApS&S Library, Kluwer, Dordrecht, Vol. 272, p. 1
- (50) Tribble, P.C., 1993, MNRAS, 263, 31
- (51) Valtchanov, I., Murphy, T., Pierre, M., et al., 2002, A&A, 392, 795
- (52) Zhang, Y.Y, Böhringer, H., Finoguenov, A., et al., 2006, A&A, 456, 55
- (53) Zhao, J.H., Sumi, D.M., & Burns, J.O., 1993, ApJ, 461, 51