Keck Infrared Observations of GRO J0422+32 in Quiescence
Abstract
We present Keck K-band photometry and low-resolution H&K-band spectroscopy of the X-ray nova GRO J0422+32 obtained while the system was in the quiescent state. No clear ellipsoidal modulation is present in the light curve, which is instead dominated by a strong flickering component. In the K-band we observe strong Br emission, with an equivalent width of 38 5 Å. From this we conclude that the accretion disc is the most likely source of the observed photometric contamination, and that previous infrared-based attempts to constrain the mass of the putative black hole in this system are prone to considerable uncertainty. We finally proceed to show how it is possible to place meaningful constraints on some of the binary parameters of this system, even in the presence of a relatively high level of contamination from the disc.
keywords:
stars: individual (GRO J0422+32) – X-rays: binaries1 Introduction
Low-mass X-ray binaries (LMXBs) are systems in which a degenerate primary, typically a neutron star or black hole, accretes from a low-mass (M2 1 M☉), late-type companion (secondary) star. X-ray novae (XRNe) form a subset of the LMXBs: these are transient systems which undergo periods of greatly enhanced emission, by factors of as much as or greater, before returning to quiescence over a timescale of months. However, for many of these systems, as they return to quiescence, the secondary (typically of K or M type) begins to make a significant contribution to the optical flux of the system. Observations of the secondary in this state are the most reliable means for determining the mass of the compact object. Thus far, 20 systems have been dynamically confirmed as having a probable black hole primary; of these, 3 are persistent sources while the other 17 are XRNe (Casares, 2005); see Tanaka & Shibazaki (1996) for a thorough review of XRNe and McClintock & Remillard (2006) for a more recent review of black hole binaries.
GRO J0422+32 was first detected by the Compton Gamma Ray Observatory (GRO) in August 1992 by Paciesas et al. (1992). The optical counterpart was identified soon thereafter and found to have V 13 mag (Castro-Tirado et al., 1993). The retreat to quiescence was punctuated by 3 further mini-outbursts of approximately 4 magnitudes each (Harmon et al., 1992; Filippenko et al., 1993; Zhao et al., 1993). By September 1994, the system was deemed to have returned to quiescence (Zhao et al., 1994), with V 22.4 mag, over 2 years after the initial outburst. In total the luminosity increased by over 9 magnitudes in V, making GRO J0422+32 the highest-amplitude XRN observed to date. Castro-Tirado et al. (1993) searched archival plates and found no indication of any previous outburst from this system since at least 1923.
Previous attempts to determine the mass of the compact object in this system have been made by Filippenko et al. (1995), Casares et al. (1995), and Webb et al. (2000); through optical observations, they determined the mass of the primary to be Mx = 3.57 0.34 M☉, 2.5M, and M, respectively. Recent work in the infrared (IR) by Gelino et al. (2003) has led to a value of Mx = 3.97 0.95 M☉; however, negligible contamination arising from the accretion disc was assumed. The observations we describe here were undertaken in an effort to constrain the IR contamination due to the accretion disc, and hence to determine the reliability of the current mass estimate for this black hole candidate.
2 Data
IR photometry and spectroscopy were undertaken using the Near Infrared Camera (NIRC; Matthews et al. 1994) at the f/25 forward Cassegrain port of the Keck-I 10-m telescope. NIRC is a 256 256 pixel InSb array with an angular scale of 0.15 pixel-1. Low-resolution spectra were obtained using a grism (R 120) and the HK filter, which covers the standard H and K-bands.
2.1 Photometry
Photometry of GRO J0422+32 was undertaken on the night of 1997 November 9 UT. The system was observed in the K-band for a full orbital cycle of 5.1 hr. Conditions were excellent throughout the night, with seeing no worse than 0.45 at any time. Individual exposure times were 4 s, with 30 coadds per image (i.e., 2 min exposure per image). The telescope pointing was dithered (using a 3 3 grid) to allow for accurate subtraction of the IR background; see Table 1 for a log of observations. A single 9-image grid of observations of similar duration was also taken nearly a year later (1998 September 28 UT), contemporaneously with the spectroscopy (see below).
2.1.1 Data Reduction
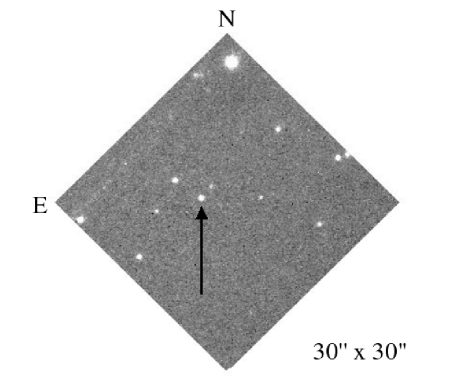
The data were dark-current subtracted, flat fielded, background subtracted, and combined using standard IRAF routines111IRAF is distributed by the National Optical Astronomy Observatories, which are operated by the Association of Universities for Research in Astronomy, Inc., under cooperative agreement with the National Science Foundation. Photometry of GRO J0422+32 and a number of nearby stars was carried out using the profile-fitting task DAOPHOT (Stetson, 1987). The standard stars FS12 and FS16222www2.keck.hawaii.edu/inst/nirc/UKIRTstds.html (Casali & Hawarden, 1992) were also observed to allow accurate calibration of the target frames. The magnitudes were cross-checked using the bright star to the north (2MASS J042142.57+325449.5), which is visible in the 2MASS333The Two Micron All Sky Survey is a joint project of the University of Massachusetts and the Infrared Processing and Analysis Center, California Institute of Technology, funded by NASA and the National Science Foundation. field of GRO J0422+32. We display one of our frames in Fig. 1. The resulting light curve was then phased to the ephemeris of Webb et al. (2000). As our data was taken 125 days after the ephemeris of Webb et al. (2000), any errors will be minimal.

We find that our magnitudes are in agreement with those of Gelino et al. (2003), confirming that our observations were indeed taken in quiescence. It is apparent from our images that there is a line-of-sight star to the northwest, lying approximately 2.6 from GRO J0422+32, which may have been unresolved in previous observations of the system (see Fig. 1). Profile fitting was carried out on this star simultaneously with our target star, GRO J0422+32. We find this star to have a mean magnitude of 19.62 0.06, which was constant over the course of our observations.
The photometric accuracy of our GRO J0422+32 light curve (2min resolution) was determined by applying a linear fit to the light curve of the star to the northeast (Fig. 1), of comparable magnitude to GRO J0422+32, which was assumed to be constant during the course of our observations. The uncertainty was then taken to be the root-mean-square (rms) deviation from this linear fit and was measured to be 0.024 magnitudes.
The 1998 observation was reduced in a manner identical to that described above. When phased and calibrated similarly to the previous epochs data, the magnitude was found to be consistent. This confirms that the system was in a quiescent state similar to that detected the previous year.
| JDa | Seeing [] | Exp. time [s] | Apparent K-band magc | |
|---|---|---|---|---|
| 2450762.91995413 | 0.40 | 1080 | 0.528 | 17.344 0.014 |
| 2450762.93619041 | 0.35 | 1080 | 0.605 | 17.389 0.010 |
| 2450762.95500179 | 0.35 | 1080 | 0.693 | 17.364 0.015 |
| 2450762.97392475 | 0.30 | 1080 | 0.783 | 17.397 0.014 |
| 2450762.98945141 | 0.30 | 1080 | 0.856 | 17.452 0.015 |
| 2450762.00493642 | 0.30 | 1080 | 0.929 | 17.406 0.015 |
| 2450763.02045906 | 0.30 | 1080 | 0.002 | 17.368 0.015 |
| 2450763.03688440 | 0.30 | 1080 | 0.079 | 17.311 0.015 |
| 2450763.05382848 | 0.30 | 1080 | 0.159 | 17.282 0.015 |
| 2450763.06980607 | 0.35 | 1080 | 0.234 | 17.345 0.014 |
| 2450763.08537309 | 0.40 | 1080 | 0.309 | 17.345 0.015 |
| 2450763.10399760 | 0.40 | 1080 | 0.392 | 17.389 0.015 |
| 2450763.11857811 | 0.45 | 1080 | 0.464 | 17.298 0.023 |
| 2451085.99342259 | 0.35 | 1080 | 0.310 | 17.264 0.093 |
aExposure time consists of nine 2-min exposures; JD is at the
midpoint.
= 2450274.4156, = 0.2121600 days
cMagnitudes correspond to those of the binned light curve; see
Fig. 2.
2.2 Spectroscopy
We obtained a number of low-resolution NIRC spectra of GRO J0422+32 on the night of 1998 September 28 UT. The HK filter was used (1.40–2.53 m) in conjunction with the gr120 grism and a 0.67 slit, giving a resolution R 120. Observing conditions were once again excellent, with seeing as good as 0.30, for the majority of the observations. The system was observed from orbital phase 0.36 to 0.78. Individual exposure times were 200 s, dithered to 5 positions along the slit. In total 30 spectra of the system were acquired.
2.2.1 Data reduction
The one-dimensional spectra were extracted in the standard manner using IRAF. Of the 30 exposures, 28 contained useful spectra. Spectra of the G0V stars BS8455 and BS1789 were also taken to aid with the removal of telluric features. No arc spectra were taken due to the availability of a known calibration, which was obtained from the NIRC online manual444http://www2.keck.hawaii.edu/inst/nirc/.
The GRO J0422+32 and G0V star spectra were normalised using a low-order spline. The region surrounding the Br feature in the G0V spectrum was masked and the GRO J0422+32 spectra were then divided by the G0V spectra to remove the telluric features. The resulting spectra were median combined so as to negate the effect of cosmic-ray hits and other spurious effects, while at the same time maximising the available signal-to-noise ratio (S/N).
No significant features were detected in the resulting H-band spectrum. In the K-band we observe strong Br emission, which we display in Fig. 3. The EW of the Br feature was measured to be 38 5 Å.

3 Analysis
3.1 Colour
We calculated the H-K colour index of the system from our spectra. This was achieved by fitting a polynomial to the continuum of the individual H&K-band spectra and then integrating the flux across the respective passband. The median colour was found to be H-K -0.02 0.01 mag, where the error is the rms deviation of the data. Correcting for interstellar extinction using a value of E(B-V) = 0.3 0.1 mag (Beekman et al. 1997) for the colour excess leads to an extinction-corrected colour of (H-K)0 = 0.07 0.08 mag, which equates to spectral types in the range B5 to K7 (Cox, 2000). This is somewhat earlier than the expected spectral type of M2 estimated by (Filippenko et al. 1995), although the uncertainties are large.
3.2 Power Density Spectrum
It is immediately apparent in the 2-minute resolution light curve (Fig. 2) that any ellipsoidal modulation in the data is masked by a strong flickering component. In an attempt to decouple the ellipsoidal variation of the secondary star from the flickering component, we followed the method of Zurita et al. (2003). As the data sampling was not uniform a Lomb-Scargle periodogram (Scargle, 1982) of the 2 minute resolution data was calculated. A significant signal ( 5) is detected at a period 2.5 hrs, half the orbital period.
The amplitude of the modulation at this period is only 0.03 magnitudes. However, as can be clearly observed from the binned (18 minute resolution data: Fig.2), this variation cannot be ellipsoidal in origin: the minima for this modulation occur at phases 0.3 & 0.8 and not at phases 0.0 & 0.5 as would be expected for an ellipsoidal modulation. This phase shift is much greater than the error in calculating the orbital phase from the known ephemeris of Webb et al. (2000). Hence, we can use our data to place a conservative upper limit of 0.03 magnitudes on the amplitude of any ellipsoidal variation present in our data.
In an attempt to characterise the shorter timescale variability present in our light curve, we computed the Power Density Spectrum (PDS). A power law fit to our data of the form yielded a power law index -0.9: see Fig. 4. This is consistent with the variability timescales observed in the optical in both A0620-00 and GRO J0422+32 by Zurita et al. (2003), who measured significant variability on timescales of up to 90 minutes.

4 Discussion
In the JHK photometry of Gelino et al. (2003), an ellipsoidal modulation is present in both sets of K-band observations (from 2000 and 2003). By contrast, our unbinned light curve (resolution 2 min), while showing rapid variability, appears to display little evidence of an ellipsoidal modulation. Binning the data to 18 min resolution (this is equal to the duration of our 3 3 dither pattern and comparable to that of Gelino et al. 2003), gives rise to a modulation that, although superficially ellipsoidal in nature, clearly is not (see section 3.2). Curry et al. (2003) observed this system in 2002 with the 3.5m WIYN telescope, they also report a modulation on a 5 hour period that is not ellipsoidal in nature. It is unclear why our results differ from those of Gelino et al. (2003), especially as the mean K-band magnitude we measure is consistent with theirs (and hence there cannot have been a significant change in the overall contribution of the flux from the disc to the light curve) but it may be that their K-band modulation is similar to the one we observe, but coincidentally at a phase that made it appear ellipsoidal in origin.
In any case we now discuss the likely sources of the lightcurve we observe: spots on the M-type secondary star, contamination originating in a radio jet and/or contamination from the quiescent accretion disc.
4.1 Spots on the M-type Secondary
Deviations from a pure ellipsoidal modulation have sometimes been attributed to the presence of spots on the rapidly rotating secondary star (Chevalier & Ilovaisky, 1993; Khruzina et al., 1995; Gelino et al., 2001). We searched the literature in an attempt to find examples of M-type dwarfs containing spots, but the number of candidate systems is few, given that we require a rapidly rotating companion: for GRO J0422+32 is close to 90 km s-1 (Harlaftis et al., 1999). The two best candidates are the isolated M1 stars HK Aqr and RE 1816+541, with rotational velocities of 70 km s-1 and 60 km s-1, respectively.
Detailed V-band light curves of HK Aqr (Young et al., 1990) show a 0.09 mag modulation due to spots. However, this modulation appears to be quite uniform and smooth, in contrast to the rapid variability which we observe in GRO J0422+32. Indeed, recent Doppler images (Barnes et al., 2001) reveal the presence of a large number of star spots on the surface of these rapidly rotating M-type stars even though the observed variability is quite low. Hence, we do not believe that star spots offer a satisfactory explanation for the observed rapid variability of GRO J0422+32 in the IR.
4.2 Contamination from a Jet
In recent years evidence has emerged that the synchrotron flux from a radio jet could be contributing to the flux emitted at other wavelengths, in particular the IR and optical (Fender, 2001). IR contamination, which has been attributed to a jet, has been observed in the halo black hole candidate XTE J1118+480 during outburst (Hynes et al., 2000). Fender et al. (2003) claim that all black hole XRBs will become jet dominated in the quiescent state. To date emission from a radio jet in quiescence has been detected for two XRBs, V404 Cyg (GS 2023+338, Gallo et al. 2005) and A0620-00 (Gallo et al., 2006). The observation of A0620 is the more pertinent here due to the similarity of its orbital period (7.8 hrs) and quiescent X-ray luminosity ( erg s-1) compared to those of GRO J0422+32 (5.1hrs and erg s-1 respectively). However, recent Spitzer observations (Muno et al., 2006) do not appear to be consistent with emission from the jet in A0620-00 longwards of 8 microns: shortwards of 8 microns Muno et al. (2006) argue that the emission appears to be consistent with that originating from an optically thick blackbody and not the photosphere of the secondary star. Hence, by analogy with A0620-00, we think it unlikely that the flux we observe in the case of GRO J0422+32 originates in a jet.
4.3 Contamination from the Accretion Disc
4.3.1 Photometric Constraints
Previous estimates of the fractional contribution of the accretion disc to the total flux range from 60% (Filippenko et al., 1995) to as little as 20% (Callanan et al., 1996) in the R-band. In a subsequent re-analysis of the data from Filippenko et al. (1995), Harlaftis et al. (1999) measured the flux from the accretion disc to contribute 40% of the total optical flux in quiescence. Similarly Webb et al. (2000) measured the contamination from the accretion disc to be 60% in the I-band. These measurements hint at an increasing level of contamination at longer wavelengths, although the different template stars used in the respective analyses (M2 vs M4) limit the conclusions that can be made.
In their analysis of GRO J0422+32, Gelino et al. (2003) assumed a negligible contribution from the accretion disc in the K-band. To check this assumption, we have used the ELC light curve modelling code (Orosz & Hauschildt, 2000) to model the flux from an accretion disc, assuming a temperature profile of the form , with chosen so as to ensure a steady state disc, and an outer disc radius of 0.55 RL (these values being consistent with observations of the quiescent disc in the XRNe A0620-00 and XTE J1118+480 (Marsh et al. 1994; McClintock et al. 1995, 2003). We calculate that for any value of the accretion disc contribution to the total flux in the R-band, the fractional contribution of the accretion disc flux to the K-band is similar, if not greater. This is in contrast to the canonical picture where the flux from the disc falls off as we venture towards the IR. The contributions from the accretion disc measured in the R & I-band in the case of GRO J0422+32 agree with this simple model and hence we would expect a similar level of contamination in the K-band. This result is dependent on the inclination of the system, as the flux from the accretion disc relative to that from the secondary increases with lower inclination.
In Fig. 5, we plot the VRJHK spectral energy distribution (SED) for various M-type secondary stars along with that of GRO J0422+32. A distance of 2.6 0.2 kpc and a reddening of E(B-V) = 0.3 0.1 have been assumed (from Jonker et al. (2004)). The absolute V-band magnitudes and the various colour relations of the M-type stars are taken from Leggett (1992). The dashed line indicates the observed SED of GRO J0422+32. The error bars account for both the uncertainty in the reddening and the distance values quoted above. The observed colours are broadly consistent with a spectral type of M1, and suggest a disk contribution in the K-band of no more that 0.3 mag (albeit at the 1 level). This value would be consistent with that observed in the R-band, as expected from the modelling discussed above. Alternatively, if there existed a cool optically thick component to the accretion disc (as might be expected theoretically - see Hynes et al. 2005), a contribution from a radio jet (see Section 4.2 above), or some form of circumbinary disc (Muno et al. 2006), any of these contributions could lead to a flatter SED than might otherwise be expected.
A spectral type of M1 is consistent with previous spectral type determinations (Casares et al. 1995; Filippenko et al. 1995; Gelino et al. 2003), with the exception of Webb et al. (2000) who measured a spectral type between M4 & M5. To reconcile the latter spectral type with the observed SED would require that the distance estimate used above is significantly in error, or a K-band contamination from the accretion disk of 3 magnitudes (which we also regard as unlikely).
4.3.2 Spectroscopic Measurements
The Br feature at 2.16m, with a equivalent width of 38 Å, dominates the K-band spectrum of GRO J0422+32. No other spectral lines are visible in either the H or K-bands. We also note the absence of the CO bandheads from the companion star in this spectrum, although it is possible that they are simply unresolved.
Previous observations of LMXBs support the conclusion that the presence of strong Br emission is due to contamination by the accretion disc. IR spectroscopy of a sample of persistently bright neutron star LMXB (Bandyopadhyay et al., 1997, 1999, 2003) revealed the presence of Br emission. In the sources with the strongest emission (Sco X-1, Sco X-2, GX 5-1), the presence of a large Br feature (EW 23, 29, 45 Å) was accompanied by the absence of the CO bandheads or any other spectral features due to the secondary star. In contrast, in the sources with lower levels of Br emission (GX 1+4, GX 13+1, EW 10Å, 5Å), the CO bandheads and other lines due to the secondary star were detected.
Previous quiescent IR observation of the XRNe V404 Cyg and A0620-00 (Shahbaz et al., 1996, 1999) also reveal the presence of Br emission. In V404 Cyg the equivalent width of the Br line was measured to be only 2.9 Å. In this case the CO bandheads from the secondary star were also detected. The Br line was detected with an EW 15 Å in A0620-00. In this case the CO bandheads were only marginally detected (the S/N of the spectrum was very low). Using these spectra the authors measured the IR contamination from the accretion disc to be 14% and 27% respectively. Recent IR spectroscopy of A0620-00 by Harrison et al. (2006) support the measurement of excess K-band flux in this system.
In summary, our data, both spectroscopic and photometric, strongly suggest a significant contribution to the K-band flux of GRO J0422+32 from the accretion disc. As previously discussed, these observations are not the first to observe “flickering” in the light curve of a quiescent XRN: Hynes et al. (2003) obtained fast photometry of the XRNe A0620–00, Nova Mus 1991, and MM Vel in the optical and detected rapid variability similar to that reported here. Zurita et al. (2003) obtained fast photometry of 5 XRNe including GRO J0422+32; significant variability was found, superposed on the ellipsoidal variations. We note that of the 5 XRNe observed optically (V404 Cyg, A0620-00, GRO J0422+32, GS 2000+25 & Cen X-4), the largest amplitude variability was observed in the light curve of GRO J0422+32. Zurita et al. (2003) contend that the observed optical flaring originates in the accretion disc and not as chromospheric activity from the secondary. Our observations are the first to show this kind of flickering variability in the K-band, where such contamination had previously been thought to be minimal for quiescent XRNe.

4.4 Mass of the Compact Object
As demonstrated above, there is no clear ellipsoidal modulation present in our K-band data. However, for a given accretion disc contamination level in the K-band, we can still hope to constrain the mass ratio , and orbital inclination, , as follows. Firstly, we assume that the true ellipsoidal modulation has an amplitude less than the 0.03 magnitude variation discussed in Section 3.2.
Assuming that the excess flux from the accretion disc contributes approximately 30% of the flux in the K-band (see section 4.3.1), an intrinsic ellipsoidal modulation of 0.04 magnitudes would be reduced to the 0.03 magnitude variation limit above. In Fig. 6, we display the vs plot for GRO J0422+32: the dotted line indicates the best fit to a 0.04 magnitude modulation. We can represent the ellipsoidal modulation by a single amplitude because, at these relatively low inclinations, the depth of the minima at phases 0.0 and 0.5 are very similar.
As this line represents an upper limit to any ellipsoidal modulation present, allowed values of and are constrained to lie to the right of and below this line. By combining this with the limit from the radial velocity measurements (assuming a secondary mass of 0.45 M☉), as delineated by the solid line, we can constrain and as follows: and . Note that the inclination constraint is an upper limit because we have only an upper limit on the amplitude of the ellipsoidal modulation. The latter yields a lower limit to the compact object mass of 10.4 M☉. This is in contrast to the inclination of 45 2 (Mx = 3.97 0.95 M☉) obtained by Gelino et al. (2003), bearing in mind the uncertainties discussed earlier.

5 Conclusions
The K-band properties of GRO J0422+32 are consistent with a flux contaminated by the emission from the accretion disc, and not solely from the secondary as previously supposed.
Previous authors have assumed negligible contamination of the IR flux of quiescent XRNe by the accretion disc, and hence that the ellipsoidal modulation and black hole mass could be most accurately measured in the IR (in comparison to the optical). This conclusion was generally based on an extrapolation of the contamination from the optical to longer wavelengths (see Haswell 1996). Our data show that this is apparently an invalid assumption in the case of GRO J0422+32.
Our observations are the first to detect flickering from a quiescent XRN accretion disc in the K-band, most likely because of the superior S/N obtainable with the 10-m Keck telescope compared with the smaller telescopes from which similar measurements have been previously obtained. However. it is also possible that the K-band flickering is present because GRO J0422+32 is a relatively low inclination system: in this case, if the source of the flickering is located in the inner disc, then the flickering would be more easily observable in a low inclination system such as GRO J0422+32 in comparison to other (higher inclination) quiescent XRNe.
In light of the observations discussed in this paper, it is clear that higher time resolution photometry or higher S/N spectroscopic observations of other XRNe in the IR are required to better constrain the contribution of the accretion disc at these wavelengths, and to determine the degree to which IR ellipsoidal variability measurements can be used to reliably constrain the mass of black holes in quiescent XRNe. Flickering of the amplitude reported here (0.2 magnitudes) would have a significant effect on even the highest amplitude ellipsoidal variation ( 0.3 magnitudes: see for example the case of GRO J1655-40 discussed by Greene, Orosz & Bailyn 2001). Even when such contamination is significant, however, it may still be possible to extract usefull limits on system parameters, as long as the degree of such contamination can be quantified (e.g. spectroscopically), as we have discussed here.
This research made use of the SIMBAD database, operated at CDS, Strasbourg, France, and NASA’s Astrophysics Data System. The data presented herein were obtained at the W. M. Keck Observatory, which is operated as a scientific partnership among the California Institute of Technology, the University of California, and the National Aeronautics and Space Administration. The Observatory was made possible by the generous financial support of the W. M. Keck Foundation. A.V.F. is grateful for support from NSF grant AST-0307894. M.T.R. & P.J.C. acknowledge financial support from Science Foundation Ireland. We thank an anonymous referee for useful comments which improved the quality of this paper.
References
- Bandyopadhyay et al. (1997) Bandyopadhyay R.M., Shahbaz T., Charles P.A., Naylor T., 1999, MNRAS, 306, 417
- Bandyopadhyay et al. (1999) Bandyopadhyay R.M., Shahbaz T., Charles P.A., van Kerkwijk M.H., Naylor T., 1997, MNRAS, 285, 718
- Bandyopadhyay et al. (2003) Bandyopadhyay R.M., Shahbaz T., Charles P.A., 2003, MNRAS, 340, 13
- Barnes et al. (2001) Barnes J.R., Collier Cameron A., 2001, MNRAS, 326, 950
- Beekman et al. (1997) Beekman G., Shahbaz T., Naylor T., Charles P.A., Wagner R.M., Martini P., 1997, MNRAS, 290, 303
- Callanan et al. (1996) Callanan P.J., Garcia M., McClintock J.E., Zhao P., Remillard R., Haberl F., 1996, ApJ, 461, 351
- Casali & Hawarden (1992) Casali M.M., Hawarden T.G., 1992, JCMT-UKIRT Newsl., 4, 35
- Casares et al. (1995) Casares J., Martin A.C., Charles P.A., Martin E.L., Rebolo R., Harlaftis E.T., Castro-Tirado A.J., 1995, MNRAS, 276, 35
- Casares (2005) Casares J., 2005, in Del Toro Iniesta J.C., Alfaro E.J., Gorgas J.G., Salvador-Sol E., Butcher H., eds, The Many Scales in the Universe: JENAM 2004 Astrophysics Reviews, Springer, in press (astro-ph/0503071)
- Castro-Tirado et al. (1993) Castro-Tirado A.J., Pavlenko E.P., Salyapikov A.A., Brandt S., Lund N., Ortiz J.L., 1993 A&A, 276, L37
- Chevalier & Ilovaisky (1993) Chevalier C., Ilovaisky S.A., 1993, A&A, 269, 301
- Cox (2000) Cox A.N., 2000, Allen’s Astrophysical Quantities, AIP/Springer-Verlag : New York
- Curry et al. (2003) Curry S.M., Bailyn C., Buxton M., 2003, AAS, 203, 8101
- Fender (2001) Fender R.P., 2001, MNRAS, 322, 31
- Fender et al. (2003) Fender R.P., Gallo E. & Jonker J.G., 2003, MNRAS, 343, 99
- Filippenko et al. (1993) Filippenko A.V., Matheson T., Ho L.C., 1993, IAU Circ. 5842
- Filippenko et al. (1995) Filippenko A.V., Matheson T., Ho L.C., 1995, ApJ, 455, 614
- Gallo et al. (2005) Gallo E., Fender R.P., Hynes R.I., 2005, MNRAS, 356, 1017
- Gallo et al. (2006) Gallo E., Fender R.P., Miller-Jones J.C.A., Merloni A., Jonker P.G., Heinz S., Maccarone T.J., van der Klis M., 2006, MNRAS submitted (astro-ph/0605376)
- Garcia et al. (2001) Garcia M.R., McClintock J.E., Narayan R., Callanan P., Barret D. & Murray S.S., ApJ, 553, 47
- Gelino et al. (2001) Gelino D.M., Harrison T.E., Orosz J.A., 2001, AJ, 122, 2668
- Gelino et al. (2003) Gelino D.M., Harrison T.E., 2003, ApJ, 599, 1254
- Greene, Orosz & Bailyn (2001) Greene J., Bailyn C.D., Orosz J.A., 2001, ApJ, 554, 1290
- Harlaftis et al. (1999) Harlaftis E., Collier S., Horne K., Filippenko A.V., 1999, A&A, 341, 491
- Harmon et al. (1992) Harmon B.A., Fishman G.J., Paciesas W.S., 1992, IAU Circ. 5685
- Harrison et al. (2006) Harrison T.E., Howell S., Szkody P., Cordova F., 2006, astro-ph/0609535
- Haswell (1996) Haswell C.A., 1996, IAUS 165, 351
- Hynes et al. (2000) Hynes R.I., Mauche C.W., Haswell C.A., Shrader C.R., Cui W. & Chaty S., 2000, ApJ, 539, 37
- Hynes et al. (2003) Hynes R.I., Charles P.A., Casares J., Haswell C.A., Zurita C., Shahbaz T., 2003, MNRAS, 340, 447
- Hynes et al. (2005) Hynes R.I., Robinson E.L., Bitner M., 2005, ApJ, 630, 405
- Jonker et al. (2004) Jonker P.G., Nelemans G., 2004, MNRAS, 354, 355
- Kato et al. (1992) Kato T., Mineshige S., Hirata R., 1992, IAU Circ. 5676
- Khruzina et al. (1995) Khruzina T.S., Cherepashchuk A.M., 1995, ARep, 39,178
- Lasota (2000) Lasota J.P., 2000, A&A, 360, 575
- Leggett (1992) Leggett S.K., 1992, ApJS, 82, ,351
- Leggett et al. (1996) Leggett S.K., Allard F., Berriman G., Dahn C.C., Hauschildt P.H., 1996, ApJSS, 104, 117
- Marsh et al. (1994) Marsh T.R., Robinson E.L., Wood J.H., 1994, MNRAS, 266, 137
- Matthews et al. (1994) Matthews K., Soifer B. T., 1994, in McLean I., ed, Infrared Astronomy with Arrays:the Next Generation, (Dordrecht: Kluwer), 239
- McClintock et al. (1995) McClintock J.E., Horne K., Remillard R.A., 1995, ApJ, 442, 358
- McClintock et al. (2003) McClintock J.E., Narayan R., Garcia M.R., Orosz J.A., Remillard R.A., Murray S.S., 2003, ApJ, 593, 435
- McClintock & Remillard (2006) McClintock J.E., Remillard R.A., 2006, in Lewin W.H.G., van der Klis M., eds, Compact Stellar X-Ray Sources, Cambridge University Press, Cambridge, in press (astro-ph/0306213)
- Muno et al. (2006) Muno M.P., Mauerhan J., 2006, ApJ, 648, 135
- Narayan et al. (2002) Narayan R., Garcia M.R., McClintock J.E., 2002, in Gurzadyan V., Jantzen R., Ruffini R., eds, Proc. IX Marcel Grossmann Meeting, (Singapore: World Scientific), 405
- Orosz & Hauschildt (2000) Orosz J.A., Hauschildt P.H., 2000, A&A, 364, 265
- Paciesas et al. (1992) Paciesas W.S., Briggs M.S., Harmon B.A., Wilsom R.B., Finger M.H., 1992, IAU Circ. 5580
- Scargle (1982) Scargle J.D., 1982, ApJ, 263, 835
- Shahbaz et al. (1996) Shahbaz T., Bandyopadhyay R., Charles P.A., Naylor T., 1996, MNRAS, 282, 977
- Shahbaz et al. (1999) Shahbaz T., Bandyopadhyay R., Charles P.A., 1999, A&A, 346, 82
- Stetson (1987) Stetson P, 1987, PASP, 99, 101
- Tanaka & Shibazaki (1996) Tanaka Y., Shibazaki N., 1996, ARA&A, 34 ,607
- Webb et al. (2000) Webb N.A., Naylor T., Ioannou Z., Charles P.A., Shahbaz T., 2000, MNRAS, 317, 528
- Young et al. (1990) Young A., Akumanich A., MacGregor K.B., Temple S., 1990, ApJ, 349, 608
- Zhao et al. (1993) Zhao P., Callanan P.J., Garcia M.R., McClintock J.E., 1993, IAU Circ. 5901
- Zhao et al. (1994) Zhao P., Callanan P.J., Garcia M.R., McClintock J.E., 1994, IAU Circ. 6072
- Zurita et al. (2003) Zurita C., Casares J., Shahbaz T., 2003, ApJ, 582, 369