The Extrasolar Planet Eridani b - Orbit and Mass111Based on observations made with the NASA/ESA Hubble Space Telescope, obtained at the Space Telescope Science Institute, which is operated by the Association of Universities for Research in Astronomy, Inc., under NASA contract NAS5-26555
Abstract
Hubble Space Telescope (HST ) observations of the nearby (3.22 pc), K2 V star Eridani have been combined with ground-based astrometric and radial velocity data to determine the mass of its known companion. We model the astrometric and radial velocity measurements simultaneously to obtain the parallax, proper motion, perturbation period, perturbation inclination, and perturbation size. Because of the long period of the companion, Eri b, we extend our astrometric coverage to a total of 14.94 years (including the three year span of the HST data) by including lower-precision ground-based astrometry from the Allegheny Multichannel Astrometric Photometer. Radial velocities now span 1980.8 – 2006.3. We obtain a perturbation period, P = 6.85 0.03 yr, semi-major axis mas, and inclination = 301 38. This inclination is consistent with a previously measured dust disk inclination, suggesting coplanarity. Assuming a primary mass , we obtain a companion mass M = 1.55 0.24 MJup. Given the relatively young age of Eri (800 Myr), this accurate exoplanet mass and orbit can usefully inform future direct imaging attempts. We predict the next periastron at 2007.3 with a total separation, = 03 at position angle, p.a. = -27°. Orbit orientation and geometry dictate that Eri b will appear brightest in reflected light very nearly at periastron. Radial velocities spanning over 25 years indicate an acceleration consistent with a Jupiter-mass object with a period in excess of 50 years, possibly responsible for one feature of the dust morphology, the inner cavity.
Subject headings:
astrometry — interferometry — stars: individual ( Eri) — stars: radial velocities — stars: late-type — stars: distances — extrasolar planets: masses1. Introduction
Eridani ( = HD 22049 = HIP 16537 = HR 1084 = PLX 742), with a spectral type of K2V, is one of the nearest solar-type stars with a distance of about 3.2 pc. It is slightly metal-poor (Fe/H = -0.13 0.04, Santos et al. 2004, Laws et al. 2003). Its proximity makes it a prime target for future extrasolar planet direct imaging efforts. The success of these efforts will depend on knowing exactly where to look, requiring accurate orbital elements for the companion. It will depend on the mass of the planetary companion, and will depend on the age of the system. Younger and more massive gas giant planets are predicted to be brighter (Hubbard et al. 2002). If young enough, the intrinsic luminosity of Eri b might be greater than its brightness in reflected light. However, planetary mass objects with the age of Eri change intrinsic luminosity by a factor of nearly 100 between 1 and 7 . Hence the need for a more precise companion mass.
Eri has been the subject of multiple radial velocity (RV) planet searches. Walker et al. (1995), using measurements spanning 11 years, found evidence for 10 yr variation with an amplitude of 15 m s-1 . These results were substantiated by Nelson & Angel (1998) using an analysis of the same data set. Cumming et al. (1999) analyzed 11 years of RV data on this star taken at Lick Observatory and found significant variations with comparable amplitude but with a shorter period of 6.9 years. Because of the high level of magnetic activity for Eri (inferred from chromospheric activity), these RV variations were largely interpreted as arising from a stellar activity cycle. The McDonald Observatory Planet Search Program (Cochran & Hatzes 1999) has monitored Eri since late 1988. The McDonald results in combination with these other surveys, along with data from ESO (Endl et al. 2002), confirmed the presence of long period RV variations and demonstrated that the most likely explanation for the observed RV variations was the presence of a planetary companion with a period, P = 6.9 y. Details of this analysis are given in Hatzes et al. (2000).
We obtained three years of astrometry with HST with millisecond of arc precision which we combined with radial velocity data as we have in previous planetary mass studies Benedict et al. [2002], McArthur et al. [2004]. Just as in the case of the Hatzes et al. (2000) radial velocity analysis, where less-precise data extended the observation span and allowed a companion detection, we anticipated that less-precise astrometry with a 14 year baseline from the Allegheny Multichannel Astrometric Photometer (MAP) astrometry project would improve the astrometric result. Gatewood (2000) reported in a meeting abstract an inclination, i = 46° 17° and a companion mass obtained with the MAP data alone. In this study we combine the MAP data with the HST data, only to improve the determination of the proper motion of Eri. The parallax and proper motion must be removed as accurately as possible to determine the perturbation orbit of Eri, which, when combined with an estimate of the mass of Eri, will provide the mass of the companion, Eri b.
This paper presents a mass of the planet orbiting Eri discussed in Hatzes et al. (2000), not the far longer period object inferred from dust-disk morphology [Quillen & Thorndike, 2002]. Our mass is derived from combined astrometric and radial velocity data, continuing a series presenting accurate masses of planetary companions to nearby stars. Previous results include the mass of Gl 876b [Benedict et al. , 2002] and of Cancri d [McArthur et al. , 2004].
In Section 2 we briefly review the astrometers and discuss the data sets coming from each, and identify our many sources for radial velocities. In Section 3 we present the results of extensive spectrophotometry of the astrometric reference stars, information required to correct relative parallax to absolute. In Section 4 we briefly discuss our astrometric modeling and the quality of our results as determined by residuals. In Section 5 we review our radial velocity data. In Section 6 we derive an absolute parallax and relative proper motion for Eri, those nuisance parameters that must be removed to determine the perturbation orbital parameters. We finally establish the perturbation orbital parameters and, combined with an estimate of the mass of Eri, estimate a mass for Eri b. We discuss system age, dust, and companion detectability in Section 7, and summarize our conclusions in Section 8.
2. The Astrometers and Observational Data
2.1. HST FGS1r
We used HST Fine Guidance Sensor 1r (FGS1r) to carry out our space-based astrometric observations. Nelan et al. (2003) provides a detailed overview of FGS1r as a science instrument. Benedict et al. (2002b) describe the FGS3 instrument’s astrometric capabilities along with the data acquisition and reduction strategies used in the present study. We use FGS1r for the present study because it provides superior fringes from which to obtain target and reference star positions [McArthur et al. , 2002].
Table 1 presents a log of HST FGS observations. Epochs 2–4 contain multiple data sets acquired contiguously, the time span less than a day. Each time is that of the first observation within each epoch. Each distinct observation set typically contains five measurements of Eri. The field was observed at multiple spacecraft roll values, and Eri had to be placed in different, non-central locations within the FGS1r FOV to accommodate the less than optimal distribution of reference stars. FGS photometric sensitivity depends on location within the FOV (e.g. Benedict et al. 1998) and depends on time, as the FGS PMT age. Given the faintness of our reference stars, we could not use them to provide a high-precision flat field. Hence, we could not extract millimagnitude photometry (c.f. Benedict et al. 2000a) to monitor Eri stellar activity.
2.2. The Allegheny MAP
The Multichannel Astrometric Photometer (MAP) and associated observation and reduction procedures are described by Gatewood (1987). The observational program utilizing the MAP began in 1986, but reluctance to observe at the low Eri declination over the city of Pittsburgh delayed initiation of its observation until January of 1989. Despite the reduced precision and rate of successful observation, the field remained on the MAP program until the installation of new instrumentation early in 2004 (Gatewood 2004).
MAP observations of the brightest stars utilize either a specially filtered 12th channel (e.g. Gatewood & Han 2006) or a divide by 16 feature on channel 2, which reduces the count sufficiently for the 16 bit counters. With an R magnitude of 3.0 Eri could be placed on channel 2 without counter flooding. The other 10 channels were assigned to the MAP reference stars noted below. An observation consists of 4 x 11 minute sweeps of the ruling across the field with probe rotations and ruling rotations to reduce systematic error (Gatewood 1987). Thus each observation consists of approximately 22 minutes of integration on each axis. Table 2 presents a log of MAP observations.
2.3. Radial Velocities
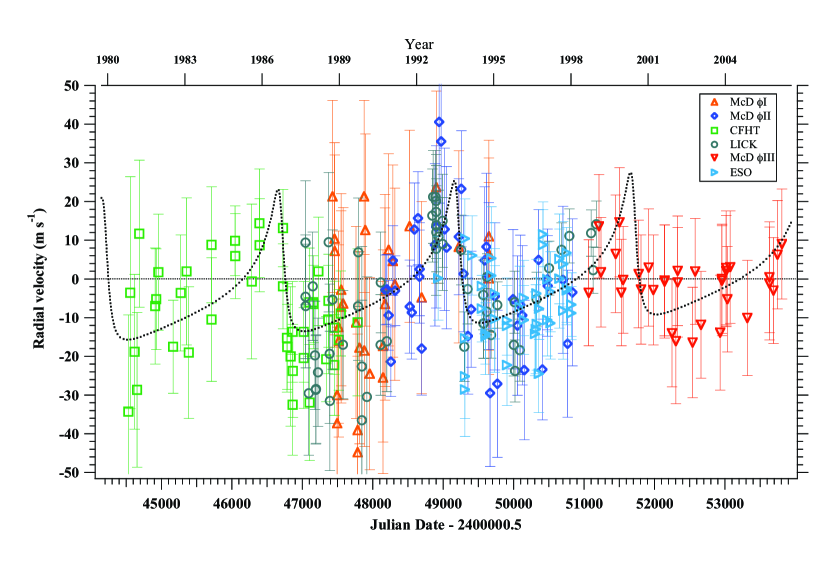
The radial velocity data used include all data described in Hatzes et al. (2000), in addition to more recent data from McDonald Observatory and ESO. These data now span over 25 years. All sources are listed in Table 3. Briefly, McDonald Phases I, II, and III are all data obtained with the 2.7m Smith telescope. The phases correspond (I) to early velocities referenced to atmospheric O2, (II) velocities obtained with an I2 cell, and (III) velocities obtained with the McDonald 2d-Coude spectrograph (Tull et al. 1995) and an I2 cell. The only new radial velocity data included in this new study are from the McDonald Observatory Phase III 2.7m program. They are listed in Table 4. Note that the errors associated with these data are larger than typically produced by this telescope/spectrograph combination [Endl et al. , 2006] due to high levels of Eri stellar activity.
3. Eri Astrometric Reference Frames
Any prior knowledge concerning the fifteen stars included in our reference frame eventually enters our modeling as observations with error, and yields the most accurate parallax and proper motion for the prime target, Eri. These periodic and non- periodic motions must be removed as accurately and precisely as possible to obtain the perturbation inclination and size caused by Eri b.
3.1. The MAP Reference Frame
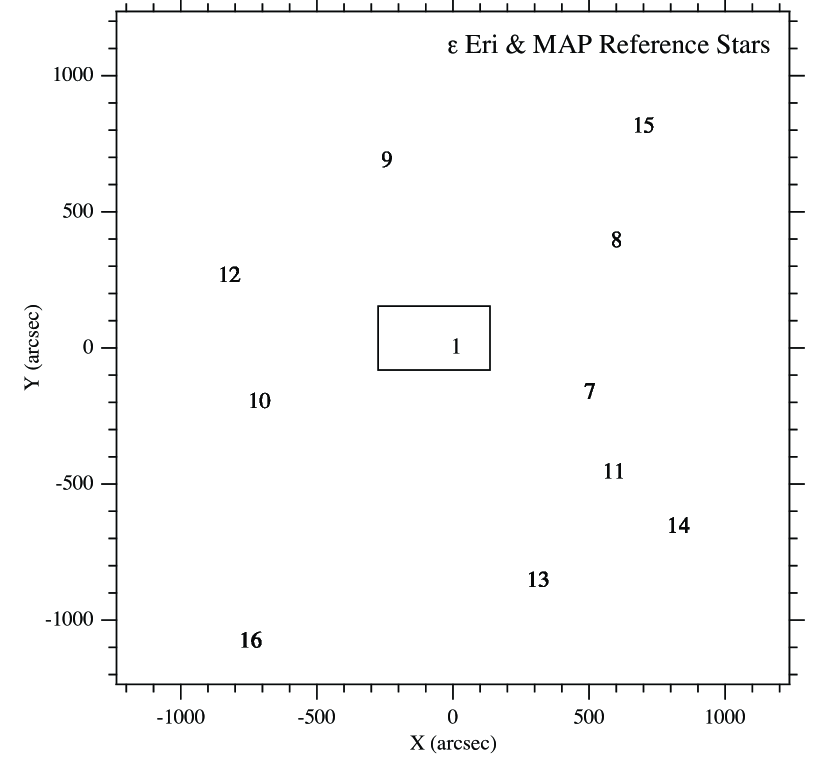
Figure 1 shows the distribution of the ten reference stars in the 130 MAP Eri observation sets (Table 2). Note that the areal coverage is approximately 0606, allowing for the use of relatively bright reference stars, well-distributed around the prime target Eri, in contrast to the case for the HST FGS (below).
3.2. The FGS Reference Frame
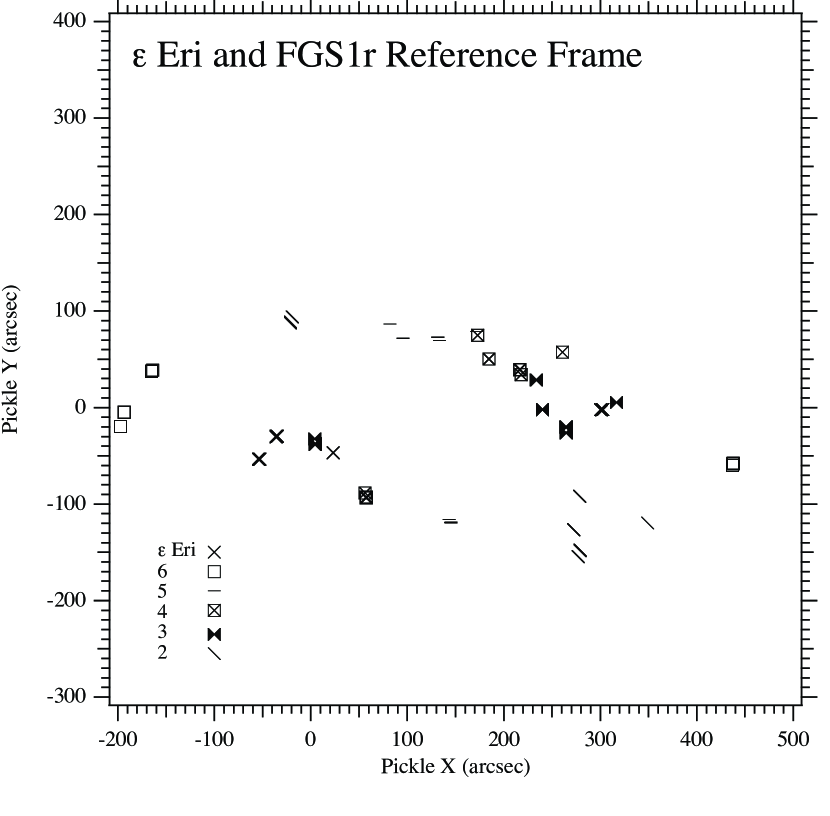
Figure 2 shows the distribution in FGS1r pickle coordinates of the 52 sets of five reference star measurements for the Eri field. The arcing pattern is enforced by the requirement that HST must roll to keep its solar panels fully illuminated throughout the year. To ensure access to all reference stars for every observation set, it was not possible to keep Eri (symbol, ) located in the center of the FGS1r FOV. At each epoch we measured each reference stars 2 – 4 times, and Eri 4–5 times.
3.3. Absolute Parallaxes for the Reference Stars
Because the parallax determined for Eri is measured with respect to reference frame stars which have their own parallaxes, we must either apply a statistically- derived correction from relative to absolute parallax [van Altena Lee & Hoffleit, 1995, Yale Parallax Catalog, YPC95], or estimate the absolute parallaxes of the reference frame stars. In principle, the colors, spectral type, and luminosity class of a star can be used to estimate the absolute magnitude, , and -band absorption, . The absolute parallax is then simply,
| (1) |
3.3.1 Reference Star Photometry
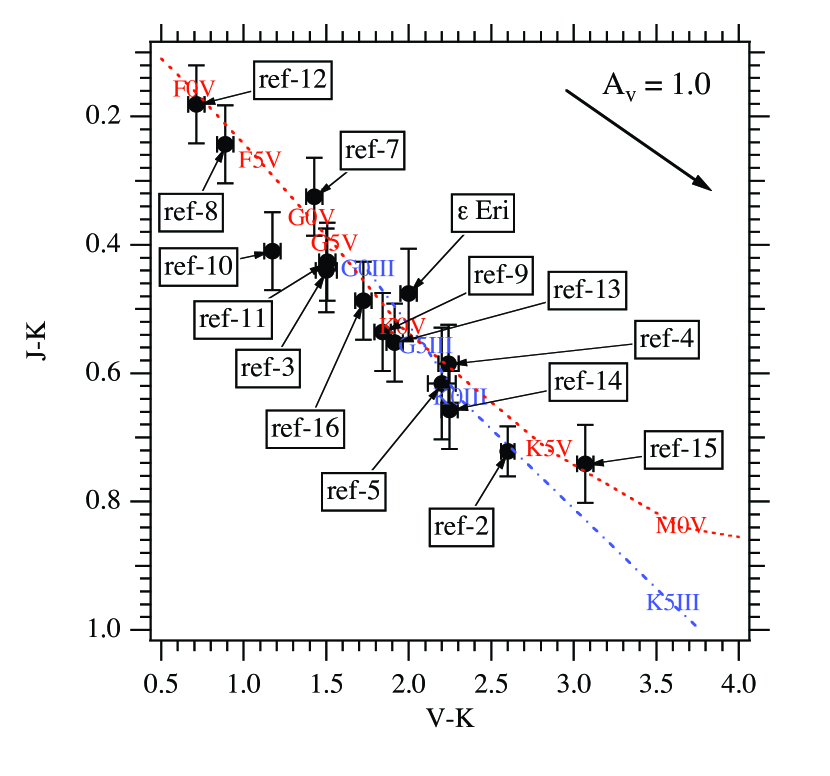
Our bandpasses for reference star photometry include: (from FGS1r), and from 2MASS222The Two Micron All Sky Survey is a joint project of the University of Massachusetts and the Infrared Processing and Analysis Center/California Institute of Technology . The values have been transformed to the Bessell & Brett (1988) system using the transformations provided in Carpenter (2001). Table 6 lists photometry for the target and reference stars indicated in Figures 1 and 2. Figure 3 contains a vs. color-color diagram with reference stars and Eri labeled. Schlegel et al. (1998) find an upper limit 0.1 towards Eri. In the following we adopt = 0.0, but increase the error on reference star distance moduli by 0.1 magnitudes to account for absorption uncertainty.
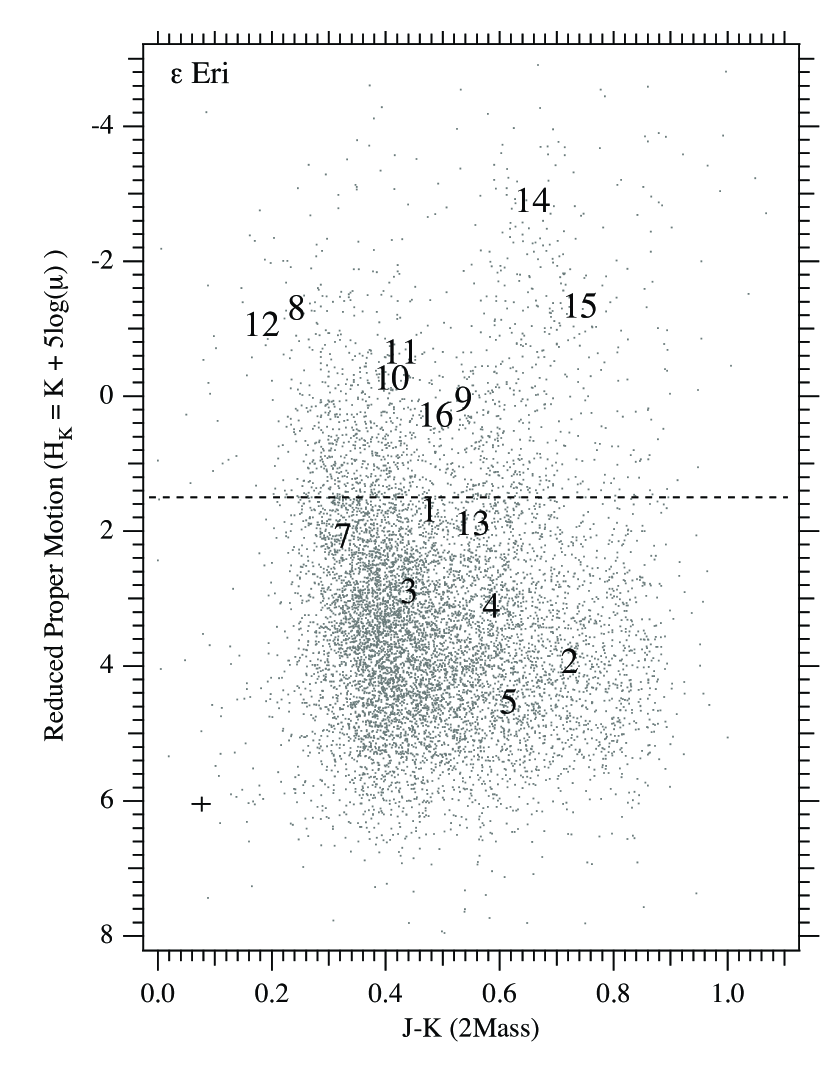
The derived absolute magnitudes are critically dependent on the assumed stellar luminosity, a parameter impossible to obtain for all but the latest type stars using only Figure 3. To confirm the luminosity classes we obtain UCAC2 proper motions [Zacharias et al. , 2004] for a one-degree-square field centered on Eri, and then iteratively employ the technique of reduced proper motion [Yong & Lambert, 2003, Gould & Morgan, 2003] to discriminate between giants and dwarfs. The end result of this process is contained in Figure 4.
3.3.2 Adopted Reference Frame Absolute Parallaxes
We derive absolute parallaxes using our estimated spectral types and luminosity class and values from Cox (2000). Our adopted input errors for distance moduli, , are 0.4 mag for all reference stars (except ref-2 and -6, as discussed below). Contributions to the error are a small but undetermined and errors in due to uncertainties in color to spectral type mapping. We estimate a spectral type for reference star ref-6 only through its apparent magnitude, hence, the larger error in its distance modulus. Ref-2, which in Figure 3 straddles the gap between giants and dwarfs, was finally typed K4V, because the (from modeling of the reference frame) significantly decreased, using that typing. Its input parallax error was also increased. All reference star absolute parallax estimates are listed in Table 7. Individually, no reference star absolute parallax is better determined than = 18%. The average input absolute parallax for the reference frame is mas, a quantity known to % (standard deviation of the mean of fifteen reference stars). We compare this to the correction to absolute parallax discussed and presented in YPC95 (Sec. 3.2, Fig. 2). Entering YPC95, Fig. 2, with the Galactic latitude of Eri, , and average magnitude for the reference frame, , we obtain a correction to absolute of 2.3 mas, considerably different. Rather than apply a model-dependent correction to absolute parallax, we introduce our spectrophotometrically-estimated reference star parallaxes into our reduction model as observations with error.
4. The Astrometric Model
The Eri reference frame contains fifteen stars and has been measured by two different astrometers, FGS1r and MAP. The only object in common is Eri. From these positional measurements we determine the scale, rotation, and offset “plate constants” relative to an arbitrarily adopted constraint epoch for each observation set. As for all our previous astrometric analyses, we employ GaussFit (Jefferys et al. 1988) to minimize . The solved equations of condition for the Eri field are:
| (2) |
| (3) |
| (4) |
| (5) |
for FGS1r data and
| (6) |
| (7) |
for the MAP data. Identifying terms, and are the measured coordinates from HST and the MAP; represents the color of each star, estimated from its spectral type, , and color listed in Table 6; and and are the lateral color corrections, applied only to FGS1r data. Here XFx and XFy are the cross filter corrections in and , applied to the observations of Eri in FGS1r. , , and are scale- and rotation plate constants, and are offsets; and are proper motions; is the epoch difference from the mean epoch; and are parallax factors; and is the parallax. We obtain the parallax factors from a JPL Earth orbit predictor (Standish 1990), upgraded to version DE405. Orientation to the sky for the FGS1r data is obtained from ground-based astrometry (2MASS Catalog) with uncertainties of .
4.1. Assessing Reference Frame Residuals
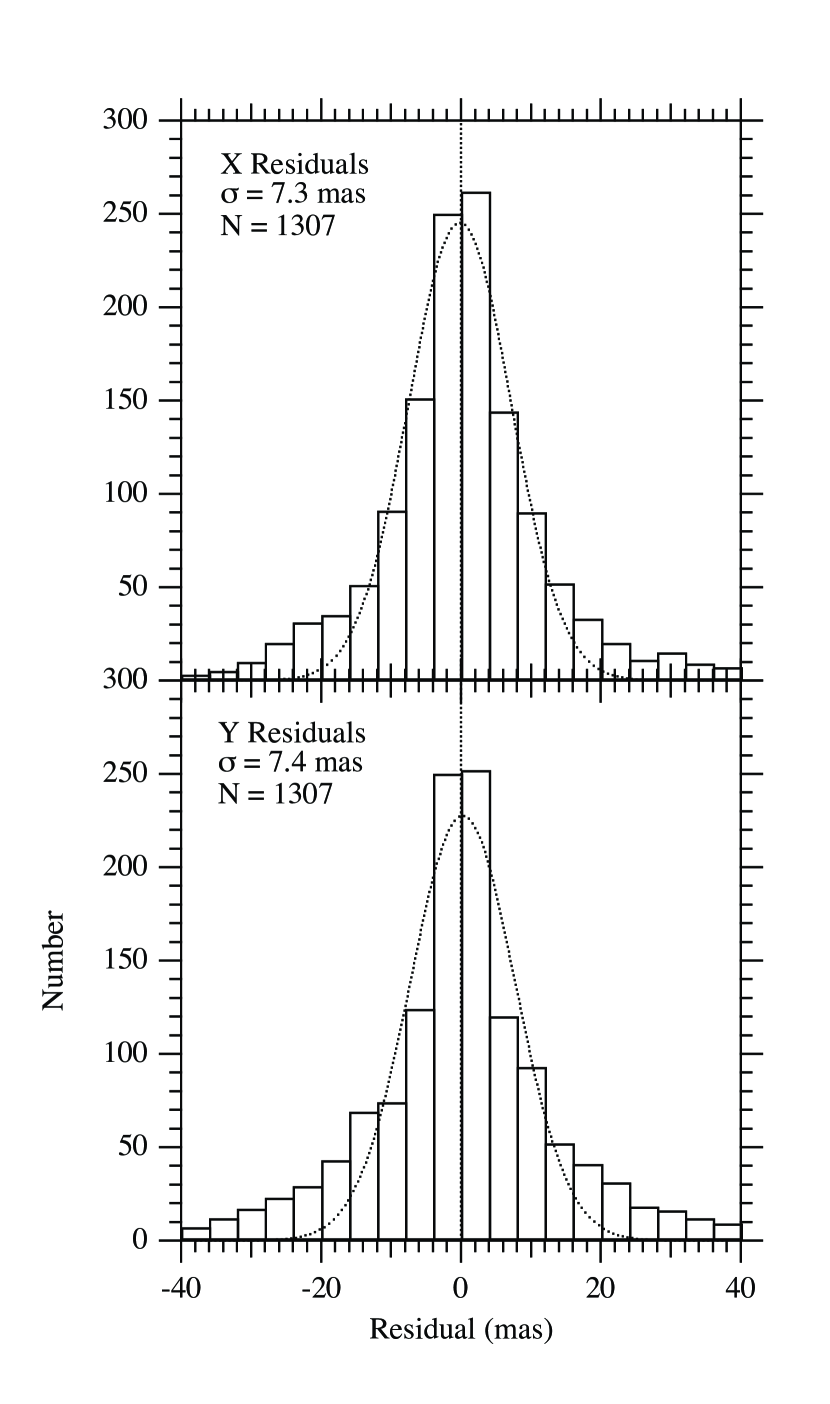
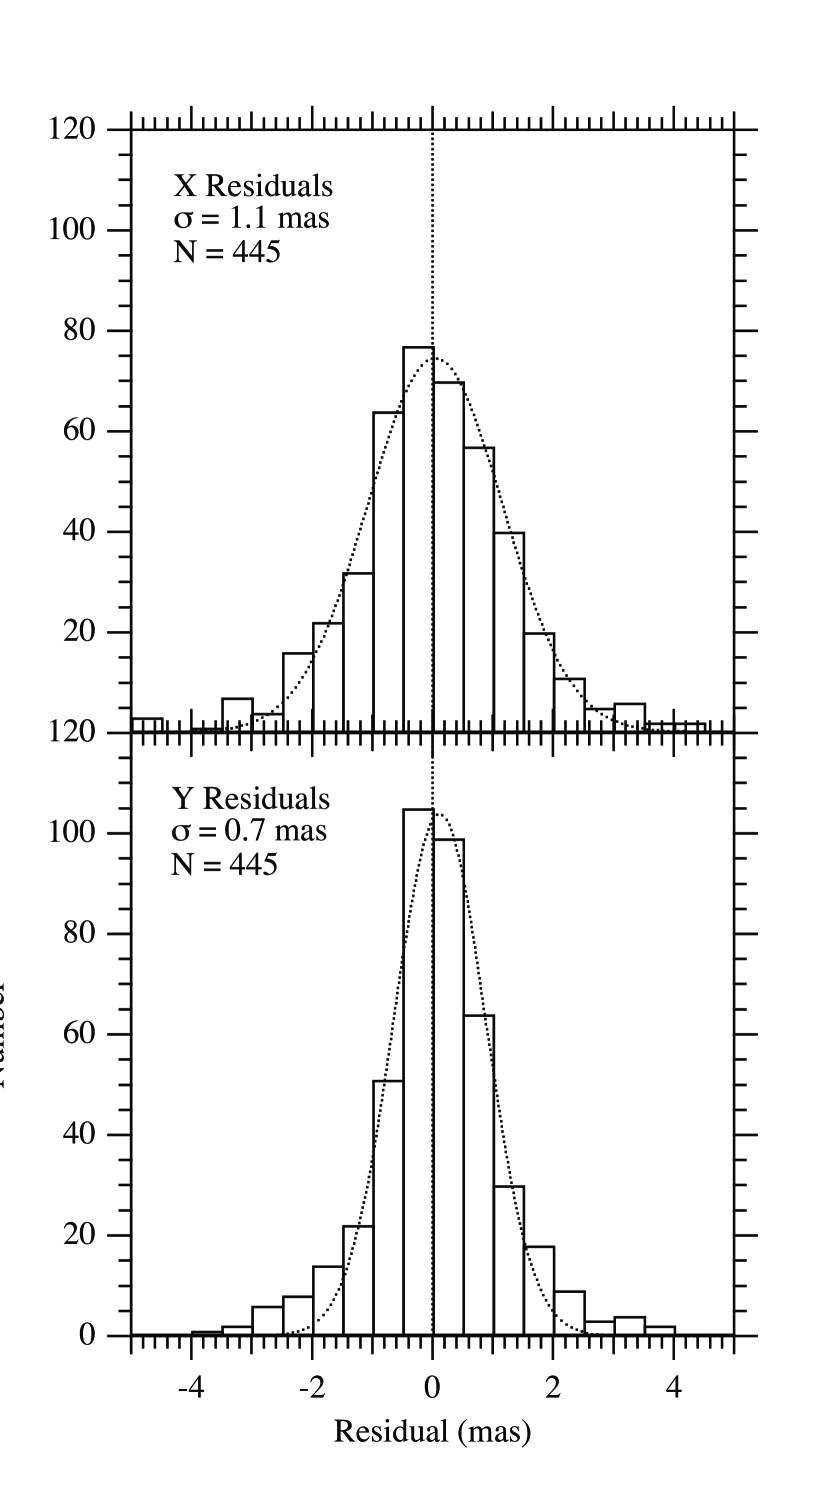
Histograms of the MAP residuals (Figure 5) indicate per-observation precision of 7 mas. Because we are seeking the signature of a perturbation over three times smaller than that per-observation precision, the MAP data were only used to lower the errors on parallax and proper motion, not to establish any perturbation parameters. As for the FGS data, the Optical Field Angle Distortion calibration McArthur et al. [2002] reduces as-built HST telescope and FGS1r distortions with magnitude to below 2 mas over much of the FGS1r field of regard. From histograms of the FGS astrometric residuals (Figure 6) we conclude that we have obtained correction at the mas level. The reference frame ’catalogs’ for MAP and FGS1r in and standard coordinates (Table 8) were determined with and mas (MAP), and and mas (FGS).
5. Radial Velocities
Measurements from four planet search groups were included in our modeling. Table 3 lists the source, coverage, technique, number of observations and the rms deviation from the final orbit of these observations. The weighting of the RV data was carefully evaluated with independent modeling and significant outliers were filtered. For example - if five data points were taken in succession, all assigned with the same weight and one point was 50 m s-1 offset from the others, that point was discarded for this solution. Initially these points were merely re-weighted, but later discarded as spurious data. The total number of observations so discarded was less than 1% of the aggregate data. This improved our goodness of fit ( /degrees of freedom) measurement of the modelling for the RV data set from 0.94 in the announcement paper to 0.30 in the current analysis.
6. Eri Parallax, Proper Motion, and Perturbation Orbit from Astrometry and Radial Velocities
Solving for relative parallax, proper motion, and orbital motion, using astrometry and radial velocities simultaneously, the model now becomes,
| (8) |
| (9) |
where ORBIT is a function (through Thiele-Innes constants) of the traditional astrometric and radial velocity orbital elements listed in Table 11.
The period (P), the epoch of passage through periastron in years (T), the eccentricity (e) and the angle in the plane of the true orbit between the line of nodes and the major axis (), are constrained to be equal for the radial velocity and astrometry portions of the model. Only radial velocity provides information with which to determine the half-amplitudes () and , the systemic velocity. Combining radial velocity observations from different sources is possible with GaussFit, which has the ability to simultaneously solve for many separate velocity offsets (because velocities from different sources are relative, having differing zero points), along with the other orbital parameters.
We force a relationship between the astrometry and the radial velocity by a constraint from Pourbaix & Jorissen [2000]
| (10) |
where quantities derived only from astrometry (parallax, , primary perturbation orbit size, , and inclination, ) are on the left, and quantities derivable from both (the period, and eccentricity, ), or radial velocities only (the radial velocity amplitude for the primary, ), are on the right.
Combining RV measurements complete through 2006.3 (Table 3), all the astrometric measurements, and the Equation 10 constraint, we solve for parallax, proper motion, and the semi-major axis, orbit orientation, and orbit inclination for the perturbation caused by the companion. For the parameters critical in determining the mass of Eri we find a parallax, mas and a proper motion mas y-1 in position angle 2690 06. Table 10 compares values for the parallax and proper motion of Eri from HST and HIPPARCOS. We note satisfactory agreement. Our precision and extended study duration have significantly improved the accuracy and precision of the parallax and proper motion of Eri.
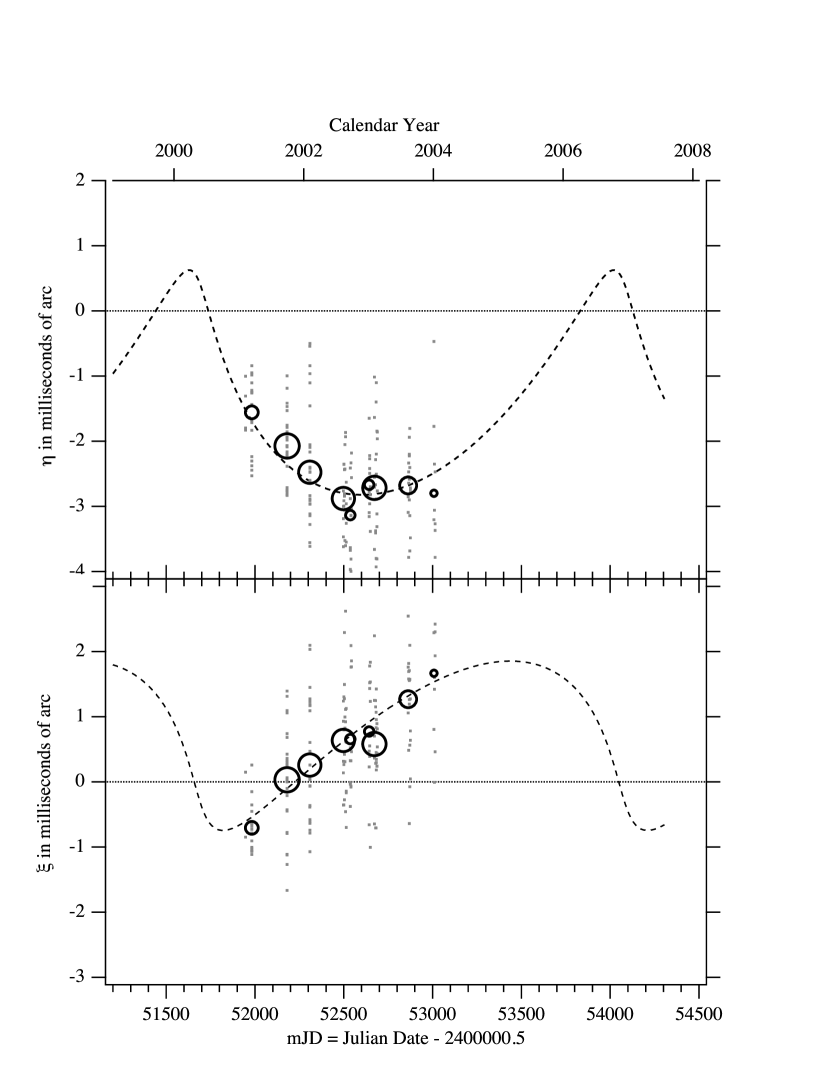
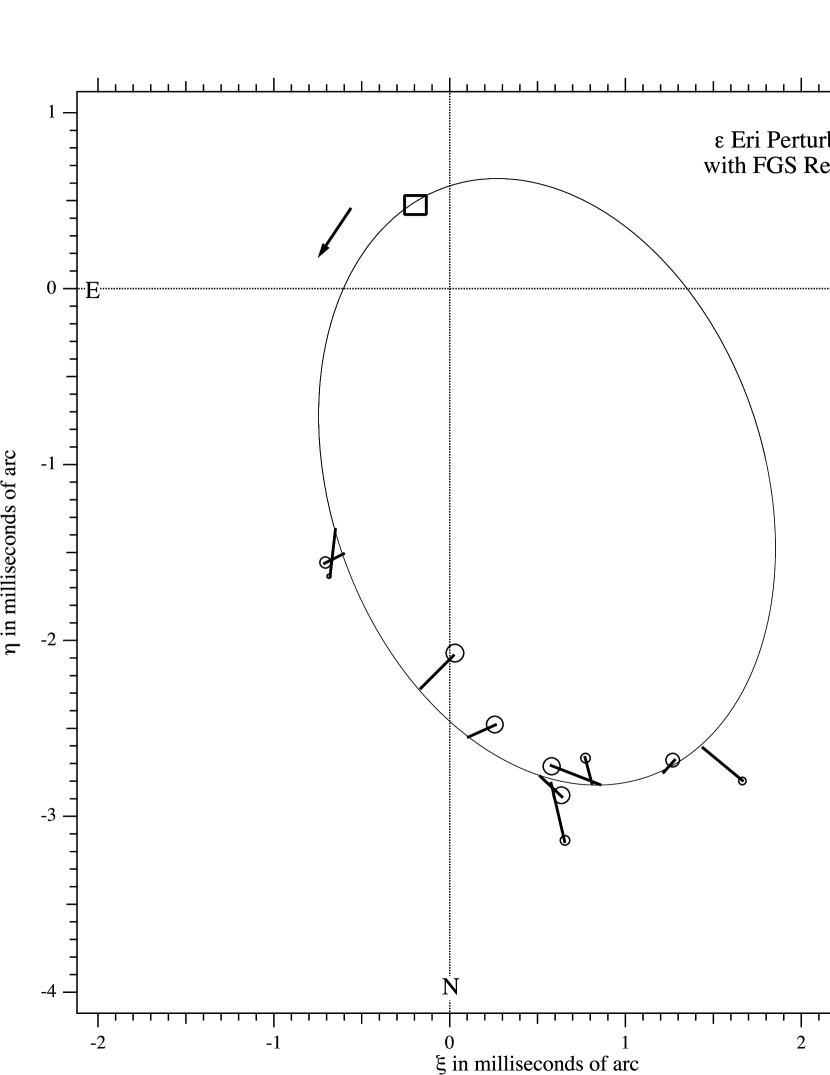
At this stage we can assess the reality of any Eri perturbation by plotting residuals to a model that does not include an orbit. Figure 7 shows the X and Y components of only the higher-precision astrometry FGS residuals plotted as grey dots. The lower precision MAP data were not considered in the determination of the orbital parameters. We also plot normal points formed from those dots at nine epochs. Finally, each plot contains as a dashed line the X and Y components of the perturbation we find by including an orbit in our modeling.
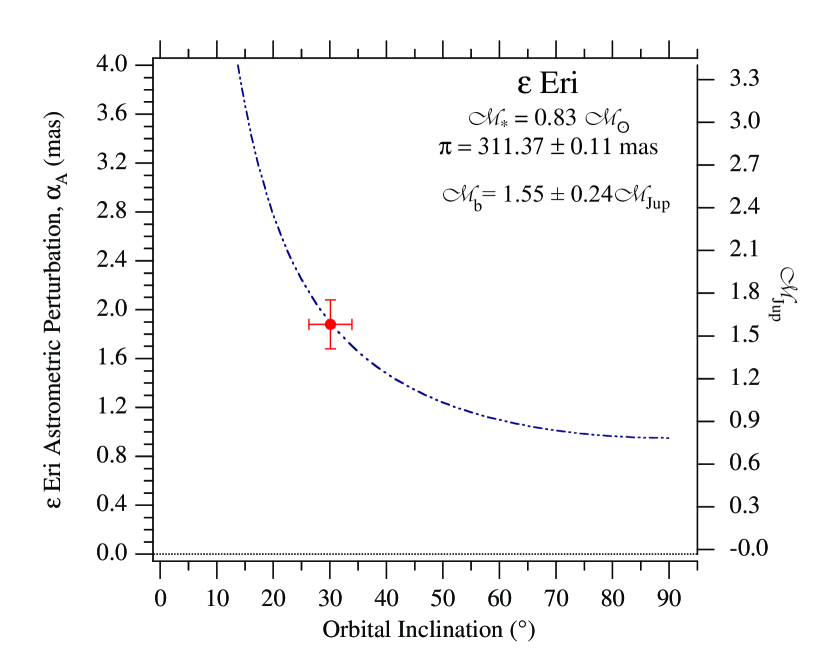
We find a perturbation size, mas, and an inclination, = 301 38. These, and the other orbital elements for the perturbation, are listed in Table 11 with 1- errors. Errors generated by GaussFit (Jefferys et al. 1988) come from a maximum likelihood estimation that is an approximation to a Bayesian maximum a posteriori estimator with a flat prior (Jefferys 1990). Figure 8 illustrates the Pourbaix and Jorrisen relation (Equation 10) between parameters obtained from astrometry (left-side) and radial velocities (right side) and our final estimates for and . As seen in Tables 10 and 11, most of the errors of the terms in Equation 10 are quite small. In essence, our simultaneous solution uses the Figure 8 curve as a quasi-Bayesian prior, sliding along it until the astrometric and radial velocity residuals are minimized. Gross deviations from the curve are minimized by the high precision of many of the terms in Equation 10. Figure 9 contains all radial velocity measures and the predicted velocity curve from the simultaneous solution. Compared to the typical perturbation radial velocity curve (e.g. Hatzes et al. 2005, McArthur et al. 2004, Cochran et al. 2004), Figure 9 exhibits far more scatter about the derived orbit. There are two reasons for this. The perturbation amplitude is small (K1=18.5 m s-1 ), and Eri is an active star, as discussed in Hatzes et al. (2000). Reiterating their conclusions, none of the activity cycles have periods commensurate with the planetary perturbation period. Figure 10 presents the astrometric residuals and the derived perturbation orbit for the primary star, Eri. Stellar activity has even less of an effect on astrometry at our level of precision. A star spot covering 30% of the surface would induce a photocenter shift of less than 0.2 mas (Sozzetti 2005). The astrometry confirms the existence of the companion.
Our analysis of the radial velocities (now spanning over 25 years, all shown in Figure 9) included a linear drift term, a change in velocity as a function of time. This drift is clearly seen in the overplotted final radial velocity curve, and amounts to 0.32 0.05 m s-1 yr-1. Such a change can be caused by longer-period companions and/or secular acceleration [Kürster & Endl, 2004]. The secular acceleration expected for Eri is (van de Kamp, 1967) quite small, 0.07 m s-1 yr-1. The trend we find is over four times larger than the predicted secular acceleration, and is approximately the acceleration one might find for a planet similar in mass to Eri b, but with a 50–100 year period. Figure 9 shows sufficient enough overlap among the many velocity data sets that the trend is unlikely an artifact due to a mismatch in the center of mass velocity offsets (discussed above) obtained for each set. Typical offset random error is m s-1 . While this acceleration is not a detection of the longer-period companion ( AU) invoked by Quillan & Thorndike (2002) and Ozernoy et al. (2000) to modify the dust distribution as discussed below in Section 7, it may (with a semimajor axis 10–20 AU) be at least partially responsible for the inner cavity in the dust disk distribution imaged by Greaves et al. (2005). The astrometric motion over 15 years due to this possible tertiary would be of order 3 mas and difficult to separate from proper motion, e.g., Black & Scargle [1982].
The planetary mass depends on the mass of the primary star, for which we have adopted [Di Folco et al. , 2004]. For this we find . The companion is clearly an extrasolar giant planet. In Table 12 the mass value, , incorporates the present uncertainty in . Until Eri b is directly detected, its radius is unknown. From a review of exoplanet masses and radii [Guillot, 2005], a radius of seems reasonable.
Our eccentricity value, = 0.70, allows for a significant difference in separation between star and exoplanet at apastron compared to periastron. At time of periastron passage, T0 = 2007.29, we predict a separation 03 01 at a position angle of -27°. At the next apastron, to occur 2010.71, the separation should be 18 04 at position angle of 153°. The dominant sources of error for the separations are the eccentricity (6%) and the Eri b planet mass (15%).
7. Discussion
Our accurate mass and orbital parameters for this planetary companion have value for future direct imaging projects. We now know where near Eri to look for Eri b. We would now like to know when to look, what bandpass is best, and what we can expect to see. As stated previously system age, companion mass, and orbital geometry are critical parameters when estimating visibility.
A high level of chromospheric activity is seen for Eri (e.g. Gray & Baliunas 1995), and is consistent with a relatively young age; 1 Gyr (Soderblom & Däppen 1989). Saffe et al. (2005) used the calibrations of Donahue (1993) and Rocha-Pinto & Maciel (1998) (which corrected the age with an effect from stellar metallicity) to estimate ages of 0.66 and 0.82 Gyr, respectively. Henry (1986) derived from CaII lines a value of 0.8 Gyr. Song et al. (2000) used Li abundances with its position in the H-R diagram and kinematics to derive a value of 0.73 0.2 Gyr. Di Folco et al. (2004) estimated the age at 0.85 Gyr, a value obtained through the measurement of the radius of Eri by long-baseline interferometry. Their modeling is consistent with a primary mass of , an estimate that weakly depends on measured metallicity, which ranges -0.13 [Fe/H] -0.06 in the literature.
Hubbard et al. (2002) predict the intrinsic luminosity of extrasolar giant planets as a function of mass and age. From their Figure 11, an age of 800 My Di Folco et al. [2004], and our planetary mass, , we find for Eri b, .Using the Di Folco et al. (2004) Teff=5135 K, their radius, , our parallax, mas, and a bolometric correction, B.C. = -0.27, from Flower (1996), we find a difference in bolometric magnitude of Eri compared to the Sun of . Hence, neglecting reflected light and orbital phase, Eri b is 4.67 fainter in bolometric luminosity than Eri.
Sudarsky et al. (2005), Dyudina et al. (2005), and Burrows et al. (2004) discuss exoplanet apparent brightness in reflected host star light as functions of orbit geometry, orbital phase, and cloud cover. Burrows et al. (2004) predict the full spectrum of Eri b from 0.5 to 6, asserting that the planet is too young for its atmosphere to contain condensed ammonia clouds. However, Eri b should exhibit H2O clouds. They predict a maximum planet/host star flux ratio, log, at with a secondary peak, log, at . Dyudina et al. (2005) predict that for , inclination, , = 0.5, and a Jupiter-like atmosphere, the planet/host star flux ratio is largest very shortly after periastron, late 2007. However, the separation remains small (03). The inclination of the Eri system, , is likely to decrease the flux ratio by approximately a factor of two (Sudarsky et al. 2005), compared to a edge-on orientation. Given the orientation of the orbit of Eri b (its ascending node, ’ = 254°), the disk of Eri b is most fully illuminated at apastron, but is three times further away from its primary.
The dusty rings or debris disks surrounding Eri also suggest relative youth for the system. Photometric measurements from the IRAS satellite (Aumann, 1988) provided the first hint of dust around Eri. Subsequently, Submillimeter Common-User Bolometric Array (SCUBA) measurements were made between 1997 and 2002. These measurements determined that the dust, distributed in a ring, is located 65 AU from the star [Greaves et al. , 1998, 2005]. The sub-mm bolometer, SIMBA, provided observational confirmation of this extended dust disk (Schutz et al. 2004). The STIS CCD camera on HST took deep optical images around Eri in an effort to find an optical counterpart for the sub-millimeter observations. These measurements did not provide clear evidence for the detection of that optical counterpart, but did place a limit on the optical surface brightness of the dust, that it could not be brighter than approximately 25 STMAG arcsec-2, which places constraints on the nature and amount of the smallest dust grains (Proffit et al. 2004).
Observational and theoretical searches for the signature of planetary/brown dwarf objects in the structure of the dust disk around Eri are underway. Clumps seen in the ring are thought to come from the interaction between the disk and a massive planetary body (Holland et al. 2003). Adaptive optics on the Keck Telescope were used to search for extrasolar planets. These studies found no evidence of brown dwarf or planetary companions down to 5 Jupiter masses at the angular separations comparable to that of the dust rings (Macintosh et al. 2003). Spitzer Space Telescope (SST) observations made with the Multi-band Imaging Photometer (MIPS) and the InfrRed Spectograph (IRS) have confirmed the disk and provided evidence for asymmetries in the structure of the disk that may have been caused by the gravitational perturbation of sub-stellar companions (Marengo et al. 2004).
Two recent studies suggested that debris disks and long-period planets co-exist, with planetary bodies ’sculpting’ the disk. Eri is the prototypical system. First, high-resolution modeling of the structure of the disk around Eri predict an angular motion of the asymmetry of the disk of about 06-08 yr-1 (Ozervnoy et al. 2000). Secondly, Quillen & Thorndike (2002) carried out numerical simulations of dust particles captured in mean motions resonances with a hypothetical planet (e = 0.3 , M = M, a = 40 AU) at periastron. These produced a dust distribution that agreed with the morphology of the dust ring around Eri presented by Greaves et al. (1998, 2005). An investigation into the dynamics of the dust ring around Eri (Moran, Kuchner & Holman, 2004) concluded that the eccentricity of the dust released in the inner ring (20 AU) could reveal patterns in the dust which could confirm the existence of the planet reported by Hatzes et al. (2000).
We determined an inclination of =301 32 for Eri b. Our measured inclination is consistent with the previously measured dust disk inclination from 450 and 850 m maps of Greaves et al. [1998, 2005], °. This suggests that the dust disk and plane of the orbit of Eri b are coincident and that the dust distribution is nearly circular. This provides support for hiearchical accretion models for planet formation Pollack et al. [1996], where coplanar dust and a debris disk are expected remnants of planet formation (Tsiganis et al. 2005). Lastly, Eri b and the possible tertiary deduced from the linear trend in the radial velocities (Section 6) would most likely eject particles that would spiral inward, and recent SCUBA submillimeter observations have shown that the center of the disk is relatively excavated of dust, with half or less of the signals seen in the ring (Greaves et al. 2005).
8. Conclusions
Analyzing three years of HST FGS and over 14 years of Allegheny Observatory MAP astrometry, we find an independently determined parallax and proper motion for Eri that agree within the errors with HIPPARCOS.
Astrometric observations with HST FGS, combined with long-duration Allegheny MAP astrometry and ground based radial velocities, have confirmed the existence of the planet orbiting Eri, first suggested by Walker et al. (1995), noted by Cummings et al. (1999), and finally announced by Hatzes et al. (2000).
Combining the astrometry with radial velocities from six different sources, spanning 25 years, and applying the Pourbaix & Jorrisen constraint between astrometry and radial velocities, we obtain for the perturbing object Eri b a period, P=6.85 0.02 y, inclination, =301 32, and perturbation semimajor axis, mas. Assuming for Eri a stellar mass = 0.830.05, we obtain a mass for Eri b, = 1.550.24. This companion inclination matches the disk inclination determined by Greaves et al. (2005).
Our astrometry predicts for Eri b periastron passage at T0 = 2007.29, with a separation 03 in position angle -27°(a = 3.39 AU). At the next apastron, to occur 2010.71, the separation should be 17 in position angle 153°. The orbital geometry suggests that 2007.97 (late December 2007) is the most favorable time for direct detection in reflected light. For an Eri age 850 My and our determined mass, Eri b will have an intrinsic luminosity , 4.67 times fainter in bolometric luminosity than Eri.
Radial velocities spanning 25 years indicate a long-term linear trend, an acceleration consistent with a Jupiter-mass object with a period of 50–100 years. This is a possible detection of a tertiary companion responsible for a major feature of the dust morphology, the central cavity.
References
- Aumann [1998] Aumann, H. H., 1998, AJ, 96, 1415
- Benedict et al. [2002] Benedict, G. F., et al. 2002, ApJ, 581, L115
- Benedict et al. [2000a] Benedict, G. F., et al. 2000a, AJ, 119, 2382
- Benedict et al. [2000b] Benedict, G. F., McArthur, B. E., Franz, O. G., Wasserman, L. H., & Henry, T. J. 2000b, AJ, 120, 1106
- Benedict et al. [1998] Benedict, G. F., et al. . 1998, AJ, 116, 429
- Bessell & Brett [1988] Bessell, M. S. & Brett, J. M. 1988, PASP, 100, 1134
- Black & Scargle [1982] Black, D. C. & Scargle, J. D. 1982, ApJ, 263, 854
- Burrows et al. [2004] Burrows, A., Sudarsky, D., & Hubeny, I. 2004, ApJ, 609, 407
- Carpenter [2001] Carpenter, J. M. 2001, AJ, 121, 2851
- Ciardi [2004] Ciardi, D., 2004, private communication
- Cochran & Hatzes [1999] Cochran, W. D., & Hatzes, A. P. 1999, ASP Conf. Ser. 185: IAU Colloq. 170: Precise Stellar Radial Velocities, 185, 113
- Cochran et al. [2004] Cochran, W. D., et al. 2004, ApJ, 611, L133
- Cox [2000] Cox, A. N. 2000, Allen’s Astrophysical Quantities, 4th ed. Publisher: New York: AIP Press, Springer, 2000. Edited by Arthur N. Cox.
- Cumming et al. [1999] Cumming, A., Marcy, G. W., & Butler, R. P. 1999, ApJ, 526, 890
- Di Folco et al. [2004] Di Folco, E., Thévenin, F., Kervella, P., Domiciano de Souza, A., Coudé du Foresto, V., Ségransan, D., & Morel, P. 2004, A&A, 426, 601
- Donahue [1993] Donahue, R. A., 1993, Ph D Thesis, New Mexico State University
- Dyudina et al. [2005] Dyudina, U. A., Sackett, P. D., Bayliss, D. D. R., Seager, S., Porco, C. C., Throop, H. B., & Dones, L. 2005, ApJ, 618, 973
- Endl et al. [2006] Endl, M., Cochran, W. D., Wittenmyer, R. A., & Hatzes, A. P. 2006, AJ, 131, 3131
- Endl et al. [2002] Endl, M., Kürster, M., Els, S. H. A. P., Cochran, W. D., Dennerl, K., Döbereiner, S. 2002, A&A, 392, 671
- Flower [1996] Flower, P. J. 1996, ApJ, 469, 355
- Gray & Baliunas [1995] Gray, D.F. & Baliunas, S.L. 1995, ApJ, 441, 442
- Gatewood [2006] Gatewood, G. and Han, I., 2006, AJ 131, 1015
- Gatewood [2004] Gatewood, G., 2004, BAAS, 36, 4.10
- Gatewood [2000] Gatewood, G. 2000, BAAS, 32, 1051
- Gatewood [1987] Gatewood, G. D. 1987, AJ, 94, 213
- Greaves et al. [2005] Greaves, J. S., et al. 2005, ApJ, 619, L187
- Greaves et al. [1998] Greaves, J. S., et al. 1998, ApJ, 506, L133
- Gould & Morgan [2003] Gould, A. & Morgan, C. W. 2003, ApJ, 585, 1056
- Guillot [2005] Guillot, T. 2005, Annual Review of Earth and Planetary Sciences, 33, 493
- Hatzes et al. [2000] Hatzes, A. P. et al. 2000, ApJ, 544, L145
- Hatzes et al. [2005] Hatzes, A. P., Guenther, E. W., Endl, M., Cochran, W. D., Döllinger, M. P., & Bedalov, A. 2005, A&A, 437, 743
- Henry et al. [1996] Henry, T.J., et al. 1996, AJ, 111, 439
- Holland et al. [2003] Holland, W. S., et al. 2003, ApJ, 582, 1141
- Hubbard et al. [2002] Hubbard, W. B., Burrows, A., & Lunine, J. I. 2002, ARA&Ap, 40, 103
- Jefferys [1990] Jefferys, W. H. 1990, Biometrika, 77, 597
- Jefferys et al. [1988] Jefferys, W., Fitzpatrick, J., & McArthur, B. 1988, Celest. Mech. 41, 39.
- Kürster & Endl [2004] Kürster, M., & Endl, M. 2004, ASP Conf. Ser. 321: Extrasolar Planets: Today and Tomorrow, 321, 84
- Laws et al. [2003] Laws, C., et al. 2003, AJ, 125, 2664
- Macintosh et al. [2003] Macintosh, B., et al. 2003, ApJ, 594, 538.
- Marengo et al. [2004] Marengo, M., et al. 2004, BAAS, 205, 1125.
- McArthur et al. [2002] McArthur, B., Benedict, G. F., Jefferys, W. H., & Nelan, E. 2002, The 2002 HST Calibration Workshop. Edited by Santiago Arribas, Anton Koekemoer, and Brad Whitmore. Baltimore, MD: Space Telescope Science Institute, p 373
- McArthur et al. [2004] McArthur, B. E., et al. 2004, ApJ, 614, L81
- Moran et al. [2004] Moran, S. M., Kuchner, M. J., & Holman, M. J. 2004, ApJ, 612, 1163
- Nelan et al. [2003] Nelan, E., et al., “Fine Guidance Sensor Instrument Handbook,” version 12.0, Baltimore, STScI
- Nelson & Angel [1998] Nelson, A. F., & Angel, J. R. P. 1998, ApJ, 500, 940
- Ozernoy et al. [2000] Ozernoy, L. M., et al. , 2000, ApJ, 537, L147
- Pollack et al. [1996] Pollack, J. B., Hubickyj, O., Bodenheimer, P., Lissauer, J. J., & Greenzweig, Y. 1996, Icarus, 124, 62
- Pourbaix & Jorissen [2000] Pourbaix, D. & Jorissen, A., 2000, A&AS, 145, 161
- Proffitt et al. [2004] Proffitt, C. R., et al. , 2004 AJ612, 481
- Quillen & Thorndike [2002] Quillen, A. C., & Thorndike, S., 2002, ApJ578, L149
- Rocha-Pinto & Macile [1998] Rocha-Pinto, H., & Macile, W. 1998, MNRAS, 298, 161
- Saffe et al. [2005] Saffee, C., Gomez, M., & Chavero, C.,2005, astro-ph archive 0510092, submitted to A&A
- Santos et al. [2004] Santos, N. C., Israelian, G., & Mayor, M. 2004, A&A, 415, 1153
- Schlegel et al. [1998] Schlegel, D. J., Finkbeiner, D. P., & Davis, M. 1998, ApJ, 500, 525
- Schutz et al. [2004] Schutz, O., et al. 2004, A&A, 414, L9
- Soderblom & Däppen [2004] Soderblom, D.R., & Däppen, W. 1989, ApJ, 375, 722.
- Sozzetti [2005] Sozzetti, A. 2005, PASP, 117, 1021
- Song [2000] Song, I., et al. 2000 ApJ, 533, L41. 1989, ApJ, 375, 722.
- Standish [1990] Standish, E. M. J. 1990, A&A, 233, 252
- Sudarsky et al. [2005] Sudarsky, D., Burrows, A., Hubeny, I., & Li, A. 2005, ApJ, 627, 520
- Tsiganas et al. [2005] Tsignas, K., et al. , 2005, Nature, 435, 459
- Tull et al. [1995] Tull, R. G., MacQueen, P. J., Sneden, C., & Lambert, D. L. 1995, PASP, 107, 251
- van Altena Lee & Hoffleit [1995] van Altena, W. F., Lee, J. T., & Hoffleit, E. D. 1995, Yale Parallax Catalog (4th ed. ; New Haven, CT: Yale Univ. Obs.) (YPC95)
- van de Kamp [1967] van de Kamp, P. 1967, Principles of Astrometry, San Francisco, CA: W. H. Freeman and Company
- Walker et al. [1995] Walker, G. A. H., Walker, A. R., Irwin, A. W., Larson, A. M., Yang, S. L. S., & Richardson, D. C. 1995, Icarus, 116, 359
- Yong & Lambert [2003] Yong, D. & Lambert, D. L. 2003, PASP, 115, 796
- Zacharias et al. [2004] Zacharias, N. et al. 2004, AJ, 127, 3043
| Epoch | MJDaaMJD = JD - 2400000.5 | Year | Roll (°)bbSpacecraft roll as defined in Chapter 2, FGS Instrument Handbook Nelan et al. [2003] | Epoch | MJD | Year | Roll (°) |
|---|---|---|---|---|---|---|---|
| 1 | 51946.528 | 2001.101 | 96.9 | 24 | 52862.76878 | 2003.609 | 281.0 |
| 2 | 51982.209 | 2001.198 | 91.0 | 25 | 52865.68038 | 2003.617 | 280.0 |
| 3 | 52180.393 | 2001.741 | 280.0 | 26 | 52868.70565 | 2003.625 | 280.0 |
| 4 | 52309.062 | 2002.093 | 97.0 | 27 | 52871.75072 | 2003.634 | 280.0 |
| 5 | 52497.787 | 2002.610 | 280.0 | 28 | 52874.84206 | 2003.642 | 280.0 |
| 6 | 52500.124 | 2002.616 | 280.0 | 29 | 53007.24013 | 2004.005 | 106.0 |
| 7 | 52503.062 | 2002.624 | 280.0 | 30 | 53010.26367 | 2004.013 | 105.0 |
| 8 | 52506.667 | 2002.634 | 280.0 | 31 | 53014.10664 | 2004.024 | 105.0 |
| 9 | 52509.629 | 2002.642 | 280.0 | 32 | 52672.409 | 2003.088 | 105.0 |
| 10 | 52513.545 | 2002.653 | 280.0 | 33 | 52679.324 | 2003.107 | 105.0 |
| 11 | 52537.069 | 2002.718 | 280.0 | 34 | 52681.993 | 2003.114 | 105.0 |
| 12 | 52540.651 | 2002.727 | 280.0 | 35 | 52682.004 | 2003.114 | 105.0 |
| 13 | 52543.679 | 2002.736 | 280.0 | 36 | 52683.127 | 2003.117 | 105.0 |
| 14 | 52642.962 | 2003.007 | 105.0 | 37 | 52686.352 | 2003.126 | 105.0 |
| 15 | 52645.364 | 2003.014 | 105.0 | 38 | 52688.330 | 2003.132 | 105.0 |
| 16 | 52649.703 | 2003.026 | 105.0 | 39 | 52862.769 | 2003.609 | 281.0 |
| 17 | 52672.40928 | 2003.088 | 105.0 | 40 | 52865.680 | 2003.617 | 280.0 |
| 18 | 52679.32437 | 2003.107 | 105.0 | 41 | 52868.706 | 2003.625 | 280.0 |
| 19 | 52681.9927 | 2003.114 | 105.0 | 42 | 52871.751 | 2003.634 | 280.0 |
| 20 | 52682.00362 | 2003.114 | 105.0 | 43 | 52874.842 | 2003.642 | 280.0 |
| 21 | 52683.12669 | 2003.117 | 105.0 | 44 | 53007.240 | 2004.005 | 106.0 |
| 22 | 52686.35236 | 2003.126 | 105.0 | 45 | 53010.264 | 2004.013 | 105.0 |
| 23 | 52688.32956 | 2003.132 | 105.0 | 46 | 53014.107 | 2004.024 | 105.0 |
| Epoch | MJDaaMJD = JD - 2400000.5 | Year | Epoch | MJD | Year |
|---|---|---|---|---|---|
| 1 | 47544.0781 | 1989.0474 | 66 | 53001.0760 | 2003.988 |
| 2 | 47772.4045 | 1989.6726 | 67 | 50362.2622 | 1996.763 |
| 3 | 47790.3559 | 1989.7217 | 68 | 50362.2948 | 1996.763 |
| 4 | 47822.2920 | 1989.8091 | 69 | 50362.3281 | 1996.763 |
| 5 | 47826.2622 | 1989.8200 | 70 | 50371.2538 | 1996.788 |
| 6 | 47829.2503 | 1989.8282 | 71 | 50371.2872 | 1996.788 |
| 7 | 47905.0385 | 1990.0357 | 72 | 50371.3184 | 1996.788 |
| 8 | 47923.0024 | 1990.0849 | 73 | 50719.3260 | 1997.741 |
| 9 | 47933.0142 | 1990.1123 | 74 | 50719.3594 | 1997.741 |
| 10 | 48209.2163 | 1990.8685 | 75 | 50736.3129 | 1997.787 |
| 11 | 48213.2052 | 1990.8794 | 76 | 50736.3448 | 1997.787 |
| 12 | 48234.1406 | 1990.9367 | 77 | 50741.3281 | 1997.801 |
| 13 | 48281.0559 | 1991.0652 | 78 | 50798.1108 | 1997.956 |
| 14 | 48290.0135 | 1991.0897 | 79 | 50799.1316 | 1997.959 |
| 15 | 48528.3413 | 1991.7422 | 80 | 50799.1649 | 1997.959 |
| 16 | 48547.2948 | 1991.7941 | 81 | 51079.3615 | 1998.727 |
| 17 | 48901.3066 | 1992.7633 | 82 | 51079.3934 | 1998.727 |
| 18 | 48915.2816 | 1992.8016 | 83 | 51079.4253 | 1998.727 |
| 19 | 49007.9990 | 1993.0554 | 84 | 51100.3219 | 1998.784 |
| 20 | 49022.0066 | 1993.0938 | 85 | 51100.3538 | 1998.784 |
| 21 | 49027.0066 | 1993.1075 | 86 | 51145.1372 | 1998.907 |
| 22 | 49268.2733 | 1993.7680 | 87 | 51145.1698 | 1998.907 |
| 23 | 49274.2691 | 1993.7844 | 88 | 51145.2024 | 1998.907 |
| 24 | 49285.2309 | 1993.8145 | 89 | 51209.0010 | 1999.081 |
| 25 | 49302.2240 | 1993.8610 | 90 | 51829.2788 | 2000.780 |
| 26 | 49312.1545 | 1993.8882 | 91 | 51829.3115 | 2000.780 |
| 27 | 49334.1448 | 1993.9484 | 92 | 51829.3434 | 2000.780 |
| 28 | 49372.9997 | 1994.0548 | 93 | 52183.3115 | 2001.749 |
| 29 | 49597.4087 | 1994.6692 | 94 | 52183.3448 | 2001.749 |
| 30 | 49600.4003 | 1994.6773 | 95 | 52185.2774 | 2001.754 |
| 31 | 49640.3052 | 1994.7866 | 96 | 52219.1969 | 2001.847 |
| 32 | 49653.2205 | 1994.8220 | 97 | 52219.2316 | 2001.847 |
| 33 | 49668.1733 | 1994.8629 | 98 | 52219.2628 | 2001.847 |
| 34 | 49708.0587 | 1994.9721 | 99 | 52219.3080 | 2001.848 |
| 35 | 49747.0052 | 1995.0787 | 100 | 52219.3413 | 2001.8476 |
| 36 | 49748.0476 | 1995.0816 | 101 | 52220.2115 | 2001.8500 |
| 37 | 50362.2622 | 1996.7632 | 102 | 52220.2455 | 2001.8501 |
| 38 | 50371.2538 | 1996.7878 | 103 | 52225.1816 | 2001.8636 |
| 39 | 50719.3260 | 1997.7408 | 104 | 52225.2149 | 2001.8637 |
| 40 | 50736.3129 | 1997.7873 | 105 | 52225.2483 | 2001.8638 |
| 41 | 50741.3281 | 1997.8010 | 106 | 52226.1899 | 2001.8664 |
| 42 | 50798.1108 | 1997.9565 | 107 | 52226.2233 | 2001.8665 |
| 43 | 50799.1316 | 1997.9593 | 108 | 52226.2573 | 2001.8665 |
| 44 | 51079.3615 | 1998.7265 | 109 | 52227.2226 | 2001.8692 |
| 45 | 51100.3219 | 1998.7839 | 110 | 52227.2552 | 2001.8693 |
| 46 | 51145.1372 | 1998.9066 | 111 | 52265.0691 | 2001.9728 |
| 47 | 51209.0010 | 1999.0815 | 112 | 52265.1024 | 2001.9729 |
| 48 | 51829.2788 | 2000.7797 | 113 | 52265.1351 | 2001.9730 |
| 49 | 52183.3115 | 2001.7490 | 114 | 52893.3497 | 2003.6929 |
| 50 | 52185.2774 | 2001.7544 | 115 | 52893.383 | 2003.6930 |
| 51 | 52219.1969 | 2001.8472 | 116 | 52924.2726 | 2003.7776 |
| 52 | 52219.3080 | 2001.8475 | 117 | 52924.3059 | 2003.7777 |
| 53 | 52220.2115 | 2001.8500 | 118 | 52925.2747 | 2003.7804 |
| 54 | 52225.1816 | 2001.8636 | 119 | 52925.3094 | 2003.7805 |
| 55 | 52226.1899 | 2001.8664 | 120 | 52925.342 | 2003.7805 |
| 56 | 52226.2573 | 2001.8665 | 121 | 52925.3774 | 2003.7806 |
| 57 | 52227.2226 | 2001.8692 | 122 | 52937.2087 | 2003.8130 |
| 58 | 52265.0691 | 2001.9728 | 123 | 52937.2413 | 2003.8131 |
| 59 | 52893.3497 | 2003.6929 | 124 | 52946.224 | 2003.8377 |
| 60 | 52924.2726 | 2003.7776 | 125 | 52946.2566 | 2003.8378 |
| 61 | 52925.2747 | 2003.7804 | 126 | 52946.2899 | 2003.8379 |
| 62 | 52925.3420 | 2003.7805 | 127 | 53000.058 | 2003.9851 |
| 63 | 52937.2087 | 2003.8130 | 128 | 53001.076 | 2003.9879 |
| 64 | 52946.2240 | 2003.8377 | 129 | 53001.1177 | 2003.9880 |
| 65 | 53000.0580 | 2003.9851 | 130 | 53001.1448 | 2003.9881 |
| Data Set | Coverage | Technique | N | RMS |
|---|---|---|---|---|
| (yr) | (m s-1 ) | |||
| CFHT | 1980.81-1991.88 | HF cell | 48 | 10.5 |
| Lick | 1987.69-1998.99 | Iodine cell | 54 | 11.5 |
| McD I | 1988.74-1994.81 | Telluric | 27 | 15.2 |
| McD II | 1990.78-1998.07 | Iodine cell | 42 | 11.7 |
| ESO | 1992.84-1998.02 | Iodine cell | 36 | 9.6 |
| McD III | 1998.69-2004.86 | Iodine cell | 28 | 7.4 |
| total | 235 |
| mJD | RVϕIII | mJD | RVϕIII |
|---|---|---|---|
| (m s-1 ) | (m s-1 ) | ||
| 51066.4339 | -3.66.4 | 52539.4226 | -16.46.4 |
| 51212.1671 | 13.6 5.0 | 52576.4378 | 2.0 5.5 |
| 51239.1133 | 1.7 8.6 | 52661.1445 | -11.8 5.2 |
| 51449.4333 | 6.5 5.0 | 52931.3912 | -13.9 6.4 |
| 51503.3574 | 14.7 5.1 | 52958.2449 | -0.4 5.4 |
| 51529.1986 | -3.5 7.4 | 52958.2481 | 0.0 6.0 |
| 51555.1645 | -0.2 5.2 | 53016.2424 | 2.9 6.0 |
| 51775.4643 | 1.3 5.9 | 53016.2456 | 2.1 6.0 |
| 51809.4033 | -2.7 4.8 | 53035.1757 | -5.2 5.6 |
| 51917.2260 | 2.9 5.5 | 53075.0940 | 3.0 5.7 |
| 51984.0740 | -2.8 5.0 | 53318.3124 | -10.1 6.6 |
| 52142.4227 | -0.7 6.2 | 53632.4520 | -1.2 5.3 |
| 52142.4264 | -0.4 6.1 | 53632.4550 | 0.4 5.5 |
| 52248.2921 | -14.0 5.9 | 53689.3900 | -3.0 5.2 |
| 52303.1266 | -16.1 7.7 | 53745.2110 | 6.3 5.1 |
| 52328.1208 | 2.1 5.6 | 53809.0850 | 9.0 5.5 |
| 52330.1064 | -0.9 5.7 |
| ID | Catalog | RAaaPositions from 2MASS, except ID 6 from applying STScI Visual Target Tuner to the Digital Sky Survey. (2000.0) | DecaaPositions from 2MASS, except ID 6 from applying STScI Visual Target Tuner to the Digital Sky Survey. | VbbMagnitudes from FGS1r (ID 2-6), SIMBAD (ID 1), or MAP (ID 7- 16). | 2MASS |
|---|---|---|---|---|---|
| 1 | Eri | 53.232961 | -9.458295 | 3.82 | 03325591-0927298 |
| 2 | 53.325845 | -9.467569 | 15.61 | 03331820-0928032 | |
| 3 | 53.312638 | -9.434314 | 15.58 | 03331503-0926035 | |
| 4 | 53.295306 | -9.421752 | 16.12 | 03331087-0925183 | |
| 5 | 53.269681 | -9.418811 | 16.41 | 03330472-0925077 | |
| 6 | 53.207917 | -9.449667 | 16.48 | ||
| 7 | GEN# +6.10280864 | 53.374062 | -9.504524 | 11.36 | 03332977-0930162 |
| 8 | HD 22130 | 53.401866 | -9.349848 | 9.52 | 03333644-0920594 |
| 9 | BD-09 696 | 53.164328 | -9.267778 | 10.69 | 03323943-0916040 |
| 10 | GEN# +6.10280861 | 53.032108 | -9.514245 | 11.60 | 03320770-0930512 |
| 11 | BD-10 699 | 53.399013 | -9.586081 | 10.24 | 03333576-0935098 |
| 12 | HD 21951 | 53.001248 | -9.385150 | 9.69 | 03320029-0923065 |
| 13 | BD-10 695 | 53.320908 | -9.696887 | 9.78 | 03331701-0941487 |
| 14 | BD-10 700 | 53.466004 | -9.641330 | 9.94 | 03335184-0938287 |
| 15 | BD-09 699 | 53.429559 | -9.232722 | 11.20 | 03334309-0913577 |
| 16 | 2MASS 03320556-0945292 | 53.023188 | -9.758118 | 11.15 | 03320556-0945292 |
| ID | |||||
|---|---|---|---|---|---|
| 1 | 3.820.01 | 1.820.05 | 0.400.28 | 0.480.07 | 2.000.05 |
| 2 | 15.610.03 | 13.010.03 | 0.580.04 | 0.720.04 | 2.600.04 |
| 3 | 15.580.03 | 14.090.06 | 0.410.05 | 0.440.07 | 1.500.06 |
| 4 | 16.120.03 | 13.880.05 | 0.510.04 | 0.590.06 | 2.240.06 |
| 5 | 16.410.03 | 14.210.08 | 0.460.07 | 0.620.09 | 2.200.08 |
| 6 | 16.48 | ||||
| 7 | 11.360.03 | 9.930.02 | 0.290.03 | 0.330.03 | 1.430.04 |
| 8 | 9.520.01 | 8.630.02 | 0.210.06 | 0.240.03 | 0.890.02 |
| 9 | 10.690.03 | 8.850.02 | 0.480.04 | 0.540.03 | 1.840.04 |
| 10 | 11.600.03 | 10.430.02 | 0.330.03 | 0.410.03 | 1.170.0 4 |
| 11 | 10.240.03 | 8.730.02 | 0.400.06 | 0.430.04 | 1.510.04 |
| 12 | 9.690.03 | 8.980.02 | 0.130.03 | 0.180.03 | 0.710.04 |
| 13 | 9.780.01 | 7.870.02 | 0.470.03 | 0.550.02 | 1.910.02 |
| 14 | 9.940.03 | 7.690.03 | 0.570.06 | 0.660.04 | 2.250.04 |
| 15 | 11.200.03 | 8.130.03 | 0.620.05 | 0.740.03 | 3.070.04 |
| 16 | 11.150.03 | 9.430.02 | 0.450.03 | 0.490.03 | 1.720.04 |
| ID | Sp. T.aaSpectral types and luminosity class estimated from colors and reduced proper motion diagram. | V | MV | m-M | (mas) |
|---|---|---|---|---|---|
| 2 | K4V | 15.6 | 7.1 | 8.51 | 1.91.0 |
| 3 | G8V | 15.6 | 5.6 | 10.00.4 | 1.00.2 |
| 4 | K2V | 16.1 | 6.5 | 9.60.4 | 1.20.2 |
| 5 | K2V | 16.4 | 6.5 | 9.90.4 | 1.00.2 |
| 6 | K2V | 16.4 | 6.5 | 9.92 | 1.00.9 |
| 7 | G0V | 11.4 | 4.4 | 7.00.4 | 4.10.7 |
| 8 | F5V | 9.5 | 3.5 | 6.00.4 | 6.31.2 |
| 9 | K0V | 10.7 | 5.9 | 4.80.4 | 11.02.0 |
| 10 | G5V | 11.6 | 5.1 | 6.50.4 | 5.00.9 |
| 11 | G8V | 10.2 | 5.6 | 4.60.4 | 11.82.2 |
| 12 | F0V | 9.7 | 2.7 | 7.00.4 | 4.00.7 |
| 13 | K0V | 9.8 | 5.9 | 3.90.4 | 16.73.1 |
| 14 | K0III | 9.9 | 0.7 | 9.20.4 | 1.40.3 |
| 15 | K2III | 11.2 | 2.7 | 8.50.4 | 2.00.4 |
| 16 | G8V | 11.2 | 5.6 | 5.60.4 | 7.81.4 |
| ID | aa and are relative positions in arcseconds | aa and are relative positions in arcseconds | |
|---|---|---|---|
| 1bbepoch 2002.614, J2000 | 3.73 | 297.03830.0001 | 35.68930.0001 |
| 2 | 15.57 | -25.64790.0002 | 126.12900.0001 |
| 3ccRA = 53.312638, Dec = -9.434314, J2000 | 15.57 | 0.00000.0002 | 0.00000.0002 |
| 4 | 16.09 | 52.87100.0003 | -55.18220.0002 |
| 5 | 16.40 | 433.12670.0003 | -20.02600.0003 |
| 6 | 16.37 | 140.68760.0004 | -81.28000.0002 |
| 1ddepoch 1996.761, J2000 | 3.73 | 715.27290.0002 | 201.75430.0002 |
| 7 | 11.36 | 1214.09190.0013 | 35.04910.0014 |
| 8 | 9.52 | 1313.11410.0005 | 591.89860.0007 |
| 9 | 10.69 | 469.25080.0011 | 887.56500.0014 |
| 10eeRA = 53.032108, Dec = -9.514245, J2000 | 11.60 | 0.00000.0021 | 0.00000.0025 |
| 11 | 10.24 | 1302.52050.0007 | -258.46400.0011 |
| 12 | 9.69 | -109.90290.0008 | 464.72820.0008 |
| 13 | 9.78 | 1025.11610.0005 | -657.08940.0007 |
| 14 | 9.94 | 1540.24240.0005 | -457.47320.0006 |
| 15 | 11.2 | 1411.69670.0011 | 1013.54800.0018 |
| 16 | 11.15 | -31.19880.0015 | -877.88860.0023 |
| Input (UCAC2) | Final (HST) | ||||
|---|---|---|---|---|---|
| ID | V | aa and are relative motions in arcsec yr-1 | aa and are relative motions in arcsec yr-1 | aa and are relative motions in arcsec yr-1 | aa and are relative motions in arcsec yr-1 |
| 2 | 15.57 | 0.00530.0078 | -0.01120.008 | 0.01100.0002 | - 0.00760.0002 |
| 3 | 15.57 | 0.01660.0076 | -0.00140.0076 | 0.00720.0003 | - 0.00260.0002 |
| 4 | 16.09 | 0.00440.009 | -0.00280.0079 | 0.00800.0004 | - 0.00220.0002 |
| 5 | 16.4 | -0.00040.004 | -0.00440.004 | 0.00700.0004 | 0.00820.0002 |
| 6 | 16.37 | 0.00640.003 | 0.00830.003 | 0.00140.0004 | -0.00300. 0003 |
| 7 | 11.36 | 0.02530.005 | 0.01170.005 | 0.02210.0002 | 0.00830. 0003 |
| 8 | 9.52 | 0.01040.005 | -0.00250.005 | 0.00880.0001 | - 0.00520.0001 |
| 9 | 10.69 | 0.0030.005 | -0.01780.005 | 0.00350.0002 | - 0.01840.0003 |
| 10 | 11.6 | -0.00150.005 | -0.00740.005 | -0.00200.0004 | - 0.00290.0004 |
| 11 | 10.24 | 0.01010.005 | -0.00940.005 | 0.01260.0001 | - 0.00890.0002 |
| 12 | 9.69 | 0.00950.005 | -0.00380.005 | 0.01090.0001 | - 0.00740.0002 |
| 13 | 9.78 | 0.05490.005 | -0.0370.005 | 0.05790.0001 | - 0.03260.0001 |
| 14 | 9.94 | -0.00030.005 | -0.00790.005 | -0.00170.0001 | - 0.01020.0001 |
| 15 | 11.2 | 0.01170.005 | -0.00630.005 | 0.01080.0002 | - 0.00420.0003 |
| 16 | 11.15 | 0.00730.005 | -0.01360.005 | 0.00520.0003 | - 0.01580.0004 |
| Parameter | HST | MAP | Combined |
|---|---|---|---|
| Study duration | 2.92 y | 14.94 y | |
| number of observation sets | 46 | 130 | |
| reference star | 16.0 | 10.2 | 12.2 |
| reference star | |||
| Absolute ParallaxbbValue from modeling RV and HST and MAP astrometry simultaneously | 311.37 0.11 mas | ||
| Relative Proper Motion | mas y-1 | ||
| in pos. angle | 2690 06 | ||
| HIPPARCOS Absolute Parallax | 310.74 0.85 mas | ||
| HIPPARCOS Proper Motion | 976.52 1.9 mas y-1 | ||
| in pos. angle | 2711 38 |
| Parameter | Value |
|---|---|
| 1.88 0.20 mas | |
| 3.02e-3 0.32e-3 AU | |
| P | 2502 10 d |
| P | 6.85 0.03 yr |
| T0 | 54207 7 mJD |
| T0 | 2007.29 0.02 y |
| e | 0.702 0.039 |
| i | 301 38 |
| 74° 7° | |
| 47° 3° | |
| 18.5 0.2 m s-1 | |
| 0.830.05 |
| Parameter | Value |
|---|---|
| a (AU) | 3.39 0.36 |
| ’ | 254° |
| ’ | 47° |
| Mass Function () | 5.9e-10 1.0e-10 |
| (M)aaderived from radial velocity alone | 0.78 0.08 |
| M (M)bbderived from radial velocity and astrometry, using Msini/sini | 1.55 0.22 |
| M (M)ccderived from radial velocity and astrometry, using ; includes host star mass uncertainty. | 1.55 0.24 |