The iron K feature in Narrow Line Seyfert 1’s: evidence for a P Cygni profile?
Abstract
Narrow Line Seyfert 1 galaxies are generally accreting at high fractions of the Eddington limit. They can show complex X-ray spectra, with a strong ‘soft excess’ below 2 keV and a sharp drop at 7 keV. There is strong evidence linking the soft excess to either reflection or absorption from relativistic, partially ionized material close to the black hole. The reflection models can also simultaneously produce the 7 keV feature from fluorescent iron K line emission from the disc. Here we show that absorption can also produce a sharp feature at 7 keV from the P Cygni profile which results from absorption/scattering/emission of He- and H-like iron K resonance lines in the wind. We demonstrate this explicitly by fitting the iron feature seen in XMM-Newton data from 1H 0707-495 to a P Cygni profile. The resulting column and ionization required to produce this feature are probably larger than those needed to produce the soft excess. Nonetheless, the absorbing material could still be a single structure with stratified ionization such as that produced by the ionization instability.
keywords:
accretion, accretion discs – atomic processes – line: profiles – galaxies: active – X-rays: galaxies1 Introduction
Eddington luminosity flows onto black holes represent extreme accretion rates in extreme gravity. They are characteristic of the majority of quasars at the peak of their activity at redshift 2 (McLure & Dunlop 2004), and of the first black holes which grow to power the highest redshift quasars now known at (Fan et al. 2003; Volonteri & Rees 2005). Thus understanding such flows is important cosmologically as well as astrophysically, yet local examples of these which can be well studied, the Narrow Line Seyfert 1 galaxies (NLS1’s: Boroson 2002), show complex features which are not easy to interpret. Their spectra are generally dominated by strong UV/soft X-ray emission, consistent to zeroth order with expectations of an accretion disc at around Eddington luminosity, , onto a 106-108 M⊙ black hole (e.g. Turner & Pounds 1989). However, the shape of the emission, especially at soft X-ray energies and above is not well matched to disc models. The soft X-ray emission rises rather smoothly to connect onto the peak disc UV emission (Zheng et al. 1997; Czerny et al. 2003), not at all like the abrupt soft X-ray rise expected from the Wien tail of accretion disc. Instead it can be modelled by a separate thermal component, but the ‘temperature’ of this feature is remarkably constant over a large range in black hole mass (Czerny et al. 2003; Gierliński & Done 2004, hereafter GD04, Crummy et al. 2006), making it unlikely to be truly related to the disc.
Instead, the fixed energy is more easily explained with atomic processes. In particular, there is an abrupt increase in opacity in partially ionized material between 0.7-1 keV due to OVII/OVIII and Fe transitions. This produces a large increase in reflected or transmitted flux below 0.7 keV, and both reflection and absorption models using partially ionized material can fit the properties of the soft X-ray excess (Fabian et al. 2002, 2004; GD04; Crummy et al. 2006; Chevallier et al. 2006; Schurch & Done 2006). Both geometries also require large velocity smearing, to hide the characteristic sharp atomic features, where at least some of the material is moving at high velocity 0.3c. Such speeds are naturally produced only close to the black hole, so both these models predict that the soft excess arises in regions of strong gravity. However, the different models give very different pictures of the geometry. For the reflection model, the strongest soft excesses require that the spectrum is dominated by reflection (e.g. Fabian et al. 2002), whereas the absorption model produces the observed range in strength of the soft excess by simply changing the column of material in the line of sight (Chevallier et al. 2006; Schurch & Done 2006). Extreme spin and perhaps even direct tapping of the spin energy of the black hole are implied by the large velocities in the reflection model, as these are associated with a Keplerian disc (Fabian et al. 2004, 2005; Miniutti & Fabian 2004). By contrast, the absorption model has the material in a wind, and its velocity shear corresponds to the accelerating wind rather than the disc, giving no direct constraints on the properties of the space-time.
Both reflection and absorption models give comparably good fits to the spectra of the soft excess, and its spectral variability (Ponti et al. 2006; Gierliński & Done 2006). There is a further clue to its origin, which is that the strongest soft excesses are often seen together with another puzzling spectral feature, namely a strong sharp drop at 7 keV (e.g. Tanaka, Boller & Gallo 2005). While this energy obviously points to an association with iron, its properties are not easy to explain (e.g Boller et al. 2002; Gallo 2006). Atomic features of iron are expected to accompany atomic models of the soft excess, yet the drop is surprisingly sharp for partially ionized material in a strong gravitational field. The reflection models can produce this feature from Doppler boosting of the blue wing of an iron line emitted from a Keplerian disc (Fabian et al. 1989), and a key point favouring this interpretation is that continuum reflection from the same material can match the shape of the soft excess (e.g. Crummy et al. 2006). However, objects with the best signal-to-noise spectra require a more complex mix of reflection ionizations and smearing. The soft excess shape and smooth curvature redward of the sharp drop implies such extreme smearing that the predicted blue wing of the line is not that sharp, so there needs to be additional reflection from less relativistic material to match the detailed shape of the spectrum at 7 keV (e.g. Fabian et al. 2002).
By contrast, the absorption model as currently implemented produces only broad absorption features due to the assumption of Gaussian (random turbulence) velocity smearing (GD04; Sobolewska & Done 2006; Schurch & Done 2006). Here instead we use a structured velocity field for the outflow, and model the resulting emission/absorption/scattering of a strong resonance line in the wind. The sharp feature at 7 keV is well fit by a P Cygni profile from He- or H-like iron line from an accelerating, outflowing wind.
2 P Cygni profile modelling
We use the Lamers, Cerruti-Sola & Perinotto (1987) method of calculating the P Cygni line profile from a spherically symmetric wind. The resulting profile (scaled to the terminal velocity ) is not very sensitive to the assumed velocity field (Castor & Lamers 1979; Lamers et al. 1987) so we pick , where is radial distance in terms of the photospheric radius , and =0.01 is the scaled velocity at the photosphere. The profile is also not very dependent on the distribution of material when the line is very optically thick (saturated), giving maximum absorption (i.e. minimum flux) at maximum outflow velocity (a classic P Cygni profile). This is not what is seen in the NLS1’s. The observed feature has minimum flux around 7 keV, which is the rest energy of the most probable resonance line transitions (He- and H-like iron K) in a P Cygni interpretation. Thus to fit the observed profile requires that the line is unsaturated (not optically thick everywhere) and has maximum absorption at more or less the rest wavelength, with decreasing absorption with increasing blueshift i.e. velocity along the line of sight. Thus we choose to parameterize the optical depth in terms of velocity rather than with radius as this gives the more direct link to the observed profile shape (Lamers et al. 1987). The atlas of P Cygni profiles of Castor & Lamers (1979) gives examples of many different optical depth-velocity distributions. We pick (so a total optical depth =0.2) as an example of a profile which can give a sharp transition between emission and absorption at around the rest wavelength for moderate optical depths (Castor & Lamers 1979). This is by no means a unique solution, we are merely using it to illustrate the possibility of P Cygni models to produce the observed feature at 7 keV.
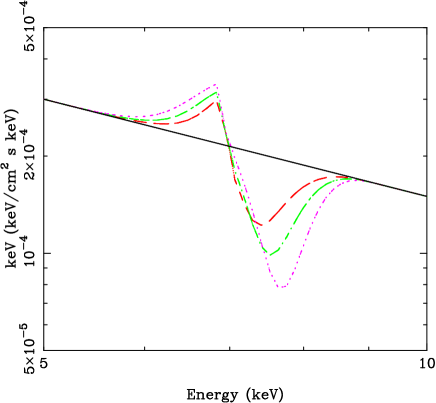
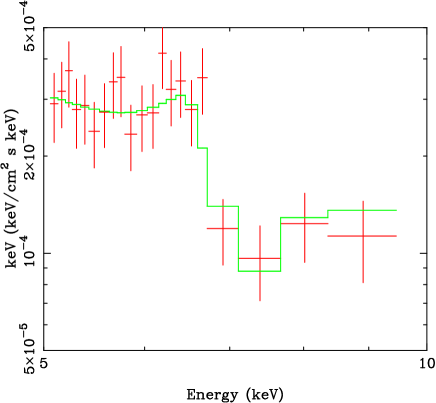
Fig. 1 (Upper panel) shows the P Cygni profiles predicted with this model for H-like iron K at rest energy =6.95 keV for total optical depths of 0.5, 1 and 2 and =0.3c. The transition between emission and absorption is typically rather sharp (by design), within of 0.5 keV of the rest energy of the line. The absorption ends at keV, so the model predicts a recovery to the intrinsic steep spectrum at this point. We note that ’classic’ P Cygni lines are seen from unsaturated iron K He– and H–like ions in the Galactic Binary Cir X–1 (Schulz & Brandt 2002), confirming that these are possible, though the wind velocity inferred here is much larger.
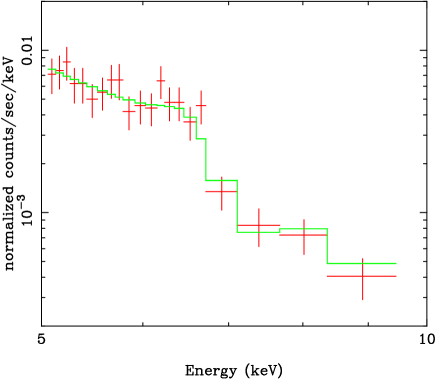
We demonstrate the model using XMM-Newton data from 1H0707-495 (z=0.041) taken in October 2000 (see Sobolewska & Done 2006 for details of the data extraction). This spectrum shows one of the strongest soft excesses seen, together with a dramatic drop in flux at 7 keV (Boller et al. 2002). We first concentrate on the iron K feature, fitting a P Cygni profile only the 5-10 keV range so that the modelling is insensitive to details of the spectral complexity at lower energies. The best-fit model has 1.7, a rest frame line energy of =6.76-7.07, consistent with either He- or H-like iron, 0.3c and =3.5 (=10.7/17). Fig. 1 (Middle panel) shows the data deconvolved using this best-fit model, showing explicitly that this description of unsaturated absorption/scattering/emission in a wind can match the sharp drop seen in the data. However, the signal–to–noise in these data is rather limited, which reduces their ability to test several key aspects of the model. In particular, there are only two data points above 8 keV. These are plainly consistent with the predicted model spectrum, including the recovery, but the uncertainties preclude a detection of this characteristic feature. Likewise, around the rest energy of the transition, the data are consistent with our particular choice for the velocity structure, but they also would be even better fit at the 1–2 sigma level by an even sharper transition. The counts spectra corresponding to these data are shown in Fig. 1 (Lower panel). Better data are clearly required in order to reveal the detailed shape of the 5–10 keV spectrum to give a more sensitive test of this model.
A nice additional property of the P Cygni model is that the energy at which the sharp feature occurs can change quite easily, either by changing the transition (e.g. He-like K is at 6.7 keV while H-like is 6.95 keV), or more generally by changing either the geometry (since the relative weighting of the emission and absorption components of the line profile depends on the solid angle subtended by the wind), or wind velocity structure. Such changes in energy of the sharp feature are observed in 1H 0707-495 (Gallo et al. 2004).
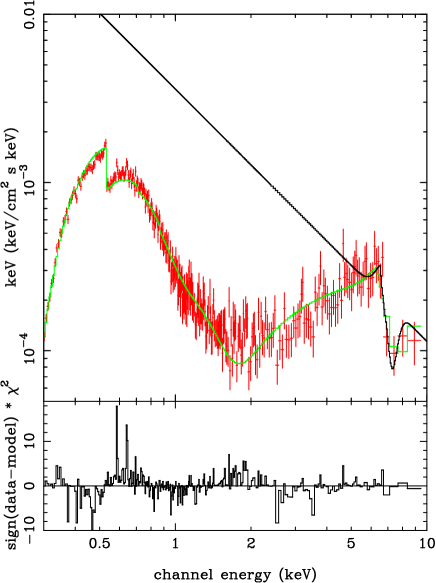
Fig. 2 shows the extrapolation of the best-fitting continuum power law inferred from these 5-10 keV fits to the lower energy data. Plainly, the model overpredicts the softer emission, compatible with an absorption origin of the soft X-ray excess. We include partially ionized absorbing material with Gaussian velocity smearing to model the lower energy curvature (see Gierliński & Done 2006 for model details), together with neutral absorption to account for the interstellar column along the line of sight in this galaxy and 1H 0707-495. Fig. 2 shows that this composite model (a power law modified by a P Cygni profile at iron and smeared absorption at low energies) matches the broad shape of the overall continuum curvature. The fit is not statistically acceptable, with =470/311, but this is unsurprising since there are other components which are not modelled here yet which are expected to be present at some level such as reflection/emission from the disc and/or wind (see below) and/or narrow ionized absorption from a much slower outflow (the classic ‘warm absorber’). The intrinsic, unabsorbed flux in the 0.3–10 keV band inferred from this best fit is ergs cm-2 s-1, over 6 larger than that observed (with roughly equal amounts absorbed by the neutral gas and smeared wind). While this is a large distortion of the X–ray flux, this is only a small fraction of the total bolometric luminosity, which is dominated by the disc (see the spectral deconvolution shown in Fig. 3 of GD04).
We stress also that this is not a self-consistent model, as the iron P Cygni profile and the soft excess absorption column are treated differently. The iron line profile calculation includes both emission, scattering and absorption (Sobolov approximation) in a structured velocity field, while the soft excess column is modelled only by absorption and a Gaussian velocity dispersion. Resonance lines in the smeared absorption column used to make the soft excess should likewise have P Cygni profiles, though much of the opacity at these lower energies is from non-resonance lines and absorption edges, diluting the P Cygni effect. A full calculation of the radiative transfer problem in a relativistic outflow is beyond the scope of this paper. However, we note that the derived absorption parameters for the soft excess and iron features are probably different, suggesting that even full radiative transfer on a single, constant ionization slab may not match the data. This is easiest to see for the ionization state. The ‘soft excess’ absorber must have many transitions in the soft X-ray region. Hence it cannot have iron predominantly as He- or H-like, as these are so highly ionized that few lower energy transitions should remain. The columns required are probably also different, although the velocities are similar. The ‘soft excess’ column is =4.6 1023 cm-2 (though this will depend on the assumed velocity structure, see Schurch & Done 2006). The total optical depth for the iron feature in the full bandpass fit is 1.2, implying an ion column of 51019 cm-2 (Lamers et al. 1987). For solar iron abundance and a fractional He-like ion abundance of 0.3 we estimate an equivalent Hydrogen column of =51024 cm-2. This is optically thick to electron scattering (see also the winds inferred by King & Pounds 2003).
An optically thick column does not invalidate the model, in that it will not lead to complete thermalization of the X-ray spectrum. Such thermalization requires that the effective optical depth (the geometric mean of the electron scattering and true absorption optical depth) is also larger than unity, but this is not the case here since there is very little true absorption opacity at such high ionization. However, it does mean that continuum scattering i.e. reflection from the wind should also be important. This will be smeared by the wind velocity shear, not through Keplerian motion as for reflection from the disc, so its properties can be used to constrain the space-time only if the wind geometry and velocity as a function of radius are understood. However, scattering also means that the intrinsic continuum variability will be smeared out over the size scale of the absorber. Thus in order to produce the observed, often dramatic variability (e.g. Leighly 1999), requires that the absorber size scale is small assuming it subtends a large solid angle, i.e. that the material is close to the black hole (also required by the extreme velocity). Changes in this column could also enhance the observed variability, perhaps producing the dramatic events seen from these objects (e.g. Boller et al. 1997).
More importantly for this paper, the large column can also affect the P Cygni profile region. Firstly, there should be more absorption at higher energies, in the iron K and nickel K lines and in the iron edge. These should also be velocity smeared, so can mask the characteristic recovery after the iron K P Cygni line profile (see Fig. 1) and/or lead to an overestimate of the terminal velocity. Secondly, electron scattering in the wind can distort the P Cygni profile. Line photons are Compton up or down scattered on collisins with free electrons, removing them from resonance and hence from the P Cygni profile. However, this will have the biggest effect where the line is very optically thick, so that multiple scatterings are key to forming the line profile, whereas our wind parameters give a resonance line optical depth around unity. Thus we expect that electron scattering does not substantially change the line profile, but a quantatitive assessment of all these effects requires a proper calulation of the radiative transfer in the wind.
The inferred continuum for this model is intrinsically steep, with =3.16. NLS1’s are generally steep (Boller, Brandt & Fink 1996; Brandt, Mathur & Elvis 1997), though for the obviously curved spectrum shown here the apparent spectral index depends on the bandpass used (Fig. 2). For these data from 1H 0707-495 the apparent index in the 2-10 keV band (with an edge to describe the sharp drop at 7 keV) gives an extremely flat spectrum with 1.1 (Boller et al. 2002), while the 0.3-1 keV band is apparently much steeper. Both reflection and absorption models maintain that neither of these indices represent the intrinsic illuminating spectrum, but instead result from the effects of partially ionized material. Nonetheless, the reflection dominated fits give slightly flatter indices, with =2.5-3 (Fabian et al. 2002; 2004). Thus they do make different predictions of the high energy flux, with the wind models giving 50–60% less flux in the 10–30 keV bandpass than the reflection models. This gives a potential diagnostic test between them which may be possible with Suzaku data (Sobolewska & Done 2006).
3 Discussion
The section above shows that the sharp drop at 7 keV in the NLS1 1H 0707-495 can be fit by an unsaturated P Cygni line profile from an outflowing wind with total column of 51024 cm-2 i.e. where the optical depth in both the resonance line and the continuum is of order unity. We note that this is the one of the most extreme objects in terms of the size of the sharp drop, so other NLS1’s will give lower columns. The apparent correlation between the iron feature and the soft excess seen at lower energies (Tanaka et al. 2005) is also naturally explained in terms of the wind absorption, though it is likely that there is a range of ionization parameters present in the outflowing material, with the soft excess requiring lower column and lower ionization state than the iron features. Even lower ionization, column and velocity material is observed from the clear wind features present in the UV line emission in this and other NLS1’s (e.g. Leighly 2004).
Chevallier et al. (2006) present an attractive idea for a multi-ionization column by assuming that the X-ray illuminated absorbing material is in approximate pressure balance. This means it is subject to an ionization instability (Krolik, McKee & Tarter 1981). The inner face of the cloud is highly ionized, on a stable branch where X-ray heating is balanced by Compton cooling and bremsstrahlung. Further into the cloud the X-ray heating is reduced, so to remain in pressure balance requires that the density increases. Yet this increases the importance of collisional cooling processes (bremsstrahlung and/or lines and recombination continua) which pulls the temperature down further (hence increasing the density). Lower temperatures mean the gas is less highly ionized, with more ion species existing. The dramatic increase in cooling efficiency produced by the increasing number of atomic transitions below 0.5 keV triggers the instability where the gas switches over a rather small range in optical depth between being hot, highly ionized and rarified to cool, mostly neutral and dense (Krolik et al. 1981). The ionization required in order to produce the soft excess from atomic processes lies exactly on this instability (Chevallier et al. 2006).
Thus this model gives a structure where there is a column containing (at most) only He- and H-like iron, followed by a column of partially ionized material which marks the point of the ionization instability. Beyond this the material is mostly neutral, but the dramatic increase in density probably causes this material to fragment into small clumps, effectively truncating the column at this point (Chevallier et al. 2006). Thus a single structure could produce the apparent ‘soft excess’ from partially ionized material across the ionization instability, and the sharp iron feature from the highly ionized column closer to the X-ray source.
However, it remains to be seen whether this could work for the steep intrinsic spectrum of inferred here. The models of Chevallier et al. (2006) are only calculated up to , and a steeper spectrum increases the importance of Compton cooling relative to heating, which weakens the extent of the ionisation instability (though does not completely suppress it e.g. Komossa & Meerschweinchen 2000).
4 Conclusions
NLS1’s are an extreme population, representing the highest AGN (e.g. Boroson 2002). They can show complex X-ray spectra, with a strong smooth soft excess below 1 keV, and a sharp drop around 7-8 keV. Here we show that these features can both be produced by a wind, and that in particular the sharpness of the feature at 7 keV matches well with a P Cygni profile produced from a resonance line of highly ionized iron.
The alternative geometry, in which the partially ionized material is seen in reflection, can also produce the correlated soft excess and iron line feature (e.g. Fabian et al. 2002, 2004; Crummy et al. 2006). In this interpretation the strongest soft excess/iron features seen require a reflection dominated geometry, and the smearing implies an extreme space-time as the large velocity shear is interpreted as arising from a Keplerian disc. The wind model described here also requires some extreme parameters: the strength of the largest iron features implies that the total column through the wind has optical depth of order unity to electron scattering (so there should also be reflection from the wind) and again there is a large velocity shear. However, here the mildly relativistic terminal velocity only implies that the wind is launched close to the black hole, rather than giving direct constraints on the space-time.
Thus both reflection and absorption can describe the data, but both require some extreme parameters. The question becomes which set of extreme parameters are most physically plausible. Certainly a reflecting disc with relativistic smearing is expected to be present at some level. But strong winds are likewise expected from objects with luminosity close to Eddington, especially sources with luminosity peaking in the UV/EUV region where line driving leads to dramatic enhancement of the radiation force (Proga, Stone & Kallman 2000; Proga & Kallman 2004). Any contribution from magneto-centrifugal forces will likewise increase the wind strength (e.g. Proga 2003 and references therein). We stress the importance of higher energy data in distinguishing between the two geometries, and in determining which piece of extreme physics is the most important in understanding the spectra of these objects.
5 Acknowledgements
Much of this work is based on observations obtained with XMM-Newton, an ESA science mission with instruments and contributions directly funded by ESA Member States and the USA (NASA). This research has made extensive use of NASA’s Astrophysics Data System Abstract Service. CD MG & NJS acknowledge financial support through a PPARC Senior fellowship and PDRF and PDRA, respectively. CD thanks ISAS for hospitality, and Aya Kubota and Thomas Boller for encouragement. We thank the referee, Kazushi Iwasawa, for insightful questions.
References
- [\citeauthoryearBoroson2002] Boroson T. A., 2002, ApJ, 565, 78.
- [\citeauthoryearBoller et al. 2002] Boller T., et al. , 2002, MNRAS, 329, L1.
- [\citeauthoryearBoller, Brandt, & Fink1996] Boller T., Brandt W. N., Fink H., 1996, A&A, 305, 53.
- [\citeauthoryearBoller et al. 1997] Boller T., Brandt W. N., Fabian A. C., Fink H. H., 1997, MNRAS, 289, 393.
- [\citeauthoryearBrandt, Mathur, & Elvis1997] Brandt W. N., Mathur S., Elvis M., 1997, MNRAS, 285, L25.
- [\citeauthoryearCastor & Lamers1979] Castor J. I., Lamers H. J. G. L. M.,1979, ApJS, 39, 481.
- [\citeauthoryearChevallier et al.2006] Chevallier L., Collin S., Dumont A.-M., Czerny B., Mouchet M., Gonçalves A. C., Goosmann R., 2006, A&A, 449, 493.
- [\citeauthoryearCrummy et al. 2006] Crummy J., Fabian A. C., Gallo L., Ross R. R., 2006, MNRAS, 365, 1067.
- [\citeauthoryearCzerny et al. 2003] Czerny B., Nikołajuk M., Róańska A., Dumont A.-M., Loska Z., Zycki P. T., 2003, A&A, 412, 317.
- [\citeauthoryearFabian et al. 1989] Fabian A. C., Rees M. J., Stella L., White N. E., 1989, MNRAS, 238, 729.
- [\citeauthoryearFabian et al. 2002] Fabian A. C., Ballantyne D. R., Merloni A., Vaughan S., Iwasawa K., Boller T., 2002, MNRAS, 331, L35.
- [\citeauthoryearFabian et al. 2004] Fabian A. C., Miniutti G., Gallo L., Boller T., Tanaka Y., Vaughan S., Ross R. R., 2004, MNRAS, 353, 1071.
- [\citeauthoryearFabian et al. 2005] Fabian A. C., Miniutti G., Iwasawa K., Ross R. R., 2005, MNRAS, 361, 795.
- [\citeauthoryearFan et al. 2003] Fan X., et al. , 2003, AJ, 125, 1649.
- [\citeauthoryearGallo et al. 2004] Gallo L. C., Tanaka Y., Boller T., Fabian A. C., Vaughan S., Brandt W. N., 2004, MNRAS, 353, 1064.
- [\citeauthoryearGallo2006] Gallo L. C., 2006, MNRAS, 368, 479.
- [\citeauthoryearGierliński & Done2004] Gierliński M., Done C., 2004, MNRAS, 349, L7.
- [\citeauthoryearGierliński & Done2006] Gierliński M., Done C., 2006, MNRAS,L64.
- [\citeauthoryearKing & Pounds2003] King A. R., Pounds K. A., 2003, MNRAS,345, 657.
- [\citeauthoryearKrolik, McKee, & Tarter1981] Krolik J. H., McKee C. F., Tarter C. B., 1981, ApJ, 249, 422.
- [\citeauthoryearKomossa & Meerschweinchen2000] Komossa S., Meerschweinchen J., 2000, A&A, 354, 411
- [\citeauthoryearLamers, Cerruti-Sola, & Perinotto1987] Lamers H. J. G. L. M., Cerruti-Sola M., Perinotto M., 1987, ApJ, 314, 726.
- [\citeauthoryearLeighly1999] Leighly K. M., 1999, ApJS, 125, 297.
- [\citeauthoryearLeighly2004] Leighly K. M., 2004, ApJ, 611, 125.
- [\citeauthoryearMcLure & Dunlop2004] McLure R. J., Dunlop J. S., 2004, MNRAS, 352, 1390.
- [\citeauthoryearMiniutti & Fabian2004] Miniutti G., Fabian A. C., 2004, MNRAS, 349, 1435.
- [\citeauthoryearPonti et al. 2006] Ponti G., Miniutti G., Cappi M., Maraschi L., Fabian A. C., Iwasawa K., 2006, MNRAS, 368, 903.
- [\citeauthoryearProga, Stone, & Kallman2000] Proga D., Stone J. M., Kallman T. R., 2000, ApJ, 543, 686.
- [\citeauthoryearProga2003] Proga D., 2003, ApJ, 585, 406.
- [\citeauthoryearProga & Kallman2004] Proga D., Kallman T. R., 2004, ApJ, 616, 688.
- [\citeauthoryearSchurch & Done2006]
- [\citeauthoryearSchulz & Brandt2002] Schulz N. S., Brandt W. N., 2002, ApJ, 572, 971 Schurch N. J., Done C., 2006, MNRAS, 762.
- [\citeauthoryearSobolewska & Done2006] Sobolewska M., Done C., 2006, MNRAS, submitted (astro-ph/0609223).
- [\citeauthoryearTanaka, Boller, & Gallo2005] Tanaka Y., Boller T., Gallo L., 2005, gbha.conf, 290.
- [\citeauthoryearTurner & Pounds1989] Turner T. J., Pounds K. A., 1989, MNRAS, 240, 833.
- [\citeauthoryearVolonteri & Rees2005] Volonteri M., Rees M. J., 2005, ApJ, 633, 624.
- [\citeauthoryearZheng et al. 1997] Zheng W., Kriss G. A., Telfer R. C., Grimes J. P., Davidsen A. F., 1997, ApJ, 475, 469.