Constraining population synthesis models via empirical binary compact object merger and supernovae rates
Abstract
The observed samples of supernovae (SN) and double compact objects (DCOs) provide several critical constraints on population-synthesis models: the parameters of these models must be carefully chosen to reproduce, among other factors, (i) the formation rates of double neutron star (NS-NS) binaries and of white dwarf-neutron star (WD-NS) binaries, estimated from binary samples, and (ii) the type II and Ib/c supernova rates. Even allowing for extremely conservative accounting of the uncertainties in observational and theoretical predictions, we find only a few plausible population synthesis models (roughly 9%) are consistent with DCO and SN rates empirically determined from observations. As a proof of concept, we describe the information that can be extracted about population synthesis models given these observational tests, including surprisingly good agreement with the neutron star kick distributions inferred from pulsar proper-motion measurements. In the present study, we find that the current observational constraints favor: kicks described by a single Maxwellian with a characteristic velocity of about 350km/s (i.e., at maximum likelihood; kick velocities between 100km/s and 700km/s remain within the 90% confidence interval of unimodal distributions); mass-loss fractions during non-conservative, but stable, mass transfer episodes of about 90%; and common envelope parameters of about 0.15-0.5. Finally, we use the subset of astrophysically consistent models to predict the rates at which black hole-neutron star (BH-NS) and NS-NS binaries merge in the Milky Way and the nearby Universe, assuming Milky-Way-like galaxies dominate. Inevitably, the resulting probability distributions for merger rates depend on our assumed priors for the population model input parameters. In this study we adopt relatively conservative priors (flat) for all model parameters covering a rather wide range of values. However, as we gain confidence in our knowledge of these inputs, the range of merger rates consistent with our knowledge should shift and narrow.
Subject headings:
binaries:close — stars:evolution — stars:neutron – black hole physics1. Introduction
Many ground-based gravitational wave detectors now operating at or near design sensitivity (i.e., LIGO, GEO, TAMA, and VIRGO) are designed to detect the late stages of double compact object (DCO) inspiral and final merger. Based only on early-stage data, these instruments have already provided conservative upper limits to certain DCO merger rates in the Milky Way (see,e.g. Abbot et al. (2005), The LIGO Scientific Collaboration; Abbott et al. (2005), The LIGO Scientific Collaboration). If LIGO indeed maintains its current level of sensitivity (Marx, for the LIGO Scientific Collaboration, 2006), LIGO data could set rate limits that exclude optimistic theoretical predictions, such as a population of binary black holes merging at a present-day rate density above (based on the design LIGO range of for double neutron stars). This upper limit has occasionally been reached in some theoretical predictions for BH-BH merger rates from isolated (e.g. Belczynski et al., 2002, hereafter BKB) and interacting (e.g. O’Shaughnessy et al., 2007e) binary stellar systems.111More generally, O’Shaughnessy et al. (2005a, c); Brown (1995); Portegies Zwart & Yungelson (1998); Belczynski et al. (2007a); and references therein discuss the range of DCO merger rates expected to arise from binary evolution in Milky Way-like galaxies. Thus, gravitational-wave based upper limits (and, eventually, detections) are expected to provide constraints on theoretical models of DCO formation.
Lacking a sample of DCOs containing a black hole, the only route to BH-BH merger rates is via population synthesis models. These involve a Monte Carlo exploration of the likely life histories of binary stars, given statistics governing the initial conditions for binaries and a method for following the behavior of single and binary stars (see, e.g., BKB, Hurley et al., 2002; Portegies Zwart & Verbunt, 1996; Fryer et al., 1998, and references therein). Unfortunately, our understanding of the evolution of single and binary stars is incomplete, and we parameterize the associated uncertainties with a great many parameters (), many of which can cause the predicted DCO merger rates to vary by more than one or two orders of magnitude when varied independently through their plausible range. To arrive at more definitive answers for DCO merger rates, we must substantially reduce our uncertainty in the parameters that enter into population synthesis calculations through comparison with observations when possible.
The simplest and most direct way to constrain the parameters of a given population synthesis code is to compare several of its many predictions against observations. For example, O’Shaughnessy et al. (2005c) (henceforth PSC1) required their population synthesis models be consistent with the empirically estimated formation rates derived from the three (now four) known Galactic NSNS binaries which are tight enough to merge through the emission of gravitational waves within Gyr. In this paper, we require our population synthesis models to be consistent (modulo experimental error) with six observationally determined rates: (i) the formation rate implied by the known Galactic merging NSNS binaries, mentioned above; (ii) the formation rate implied by the known Galactic NSNS binaries which do not merge within Gyr (henceforth denoted “wide” NSNS binaries); (iii,iv) the formation rate implied by the sample of merging and eccentric WD-NS binaries; and finally (v,vi) the type II and type Ib/c SNe rates. Further, we use the set of models consistent with these constraints to revise our population-synthesis-based expectations for various DCO merger rates, assuming no prior information, so all tested population synthesis model parameters consistent with our constraints are treated equally. Though many of the core concepts have been presented previously, notably in PSC1, this paper presents more constraints, higher-quality fits, and particularly the first analysis of fitting errors (as developed in our companion paper O’Shaughnessy et al., 2007c, henceforth PSF2) to arrive at substantially more reliable rate predictions that satisfy all available empirical rate constraints. Additionally, we present both the one and two-dimensional distributions of those population synthesis parameters which reproduce our complete set of constraints.
We note however, that we focus only on compact object binaries with one or two neutron stars. Merger rate predictions for binaries with two black holes must account for the mix of both spiral (Milky-Way like) and elliptical galaxies in the local Universe, since present-day merging double black hole binaries are often substantially longer-lived than their lighter counterparts; thus, compared to the small fraction of extremely long-lived progenitors of merging low-mass binaries, a significant fraction of presently merging BH-BH binaries could have been born ago during the epoch of elliptical galaxy formation. As modeling of the latter part involves computational elements and methodology that is not part of the present study (i.e., a two-component, time-dependent star formation model), we intend to undertake BH-BH rate predictions in a forthcoming paper O’Shaughnessy et al. (2007a); see also de Freitas Pacheo et al. (2005). However, the evolutionary channels and essential physics are very thoroughly addressed in Belczynski et al. (2007b).
In Sections 2 and 3 we describe the observational constraints we impose on the population synthesis models: agreement with empirical DCO merger rates [NSNS , based on Kim et al. (2003) (hereafter KKL) and PSC1; NS-WD, drawn from Kalogera et al. (2005); Kim et al. (2004)]; and supernova rates [drawn from Cappellaro et al. (1999)]. Considering the significant one-sigma systematic error in the pulsar birthrate (Vranesevic et al., 2004) and the strong correlations of that observable to the already included DCO merger rate observations, we do not impose the pulsar birthrate as an additional constraint. In §4 we briefly describe the version of the StarTrack code used and summarize the updated results from PSF2 on our population synthesis models and the resulting predictions for DCO formation rates and SN rates. In Section 5 we select from our family of possible models those predictions which are consistent with observations of DCOs. We thoroughly review the information gained from these constraints and discuss their implications for our understanding of binary evolution. Also, we employ this sample to generate refined predictions for the BH-NS and NSNS merger rates through the emission of gravitational waves.
2. Observations of NS DCOs
Seven NSNS binaries and four WD-NS binaries (with relatively massive WDs) have been discovered so far in the galactic disk, using pulsar surveys with well-understood selection effects. We are very specifically not including the recently-discovered binary PSR J1906+0746 (Lorimer et al., 2006), because the companion cannot be definitively classified as a WD or NS at present222Our predictions for the galactic NS-NS merger rate would increase by a factor of roughly two if indeed PSR J1906+0746 were a double neutron star.. We also omit PSR J2127+11C found in the globular cluster M15, since its formation is thought to be dynamical and not due to isolated binary evolution in the Galactic field; (see,e,g. Anderson et al., 1990). The basic measured and derived properties of these binaries are presented in Table 1.
| PSRs | Ṗ | M | M | eg | N | Refso | ||||||||
|---|---|---|---|---|---|---|---|---|---|---|---|---|---|---|
| (ms) | () | (hr) | (M⊙) | (M⊙) | (Gyr) | (Gyr) | (Gyr) | (Gyr) | (Myr) | |||||
| (1) NS-NS(m) | ||||||||||||||
| B1913+16 | 59.03 | 8.63 | 7.752 | 1.4408 | 1.3873 | 0.617 | 5.72 | 0.11 | 0.065 | 0.3 | 4.34 | 620 | 0.103 | 1,2 |
| B1534+12 | 37.90 | 2.43 | 10.098 | 1.3332 | 1.3452 | 0.274 | 6.04 | 0.25 | 0.19 | 2.7 | 9.55 | 440 | 1.011 | 3,4,5 |
| J0737-3039A | 22.70 | 1.74 | 2.454 | 1.337 | 1.25 | 0.088 | 0.207 | 0.145 | 0.085 | 14.1 | 1620 | 0.023 | 6,7 | |
| J1756-2251 | 28.46 | 1.02 | 7.67 | 1.4 | 1.18 | 0.181 | 0.44 | 0.38 | 1.7 | 16 | - | - | 8 | |
| (2) NS-NS(vw) | ||||||||||||||
| J1811-1736 | 104.182 | 0.916 | 451.20 | 1.62 | 1.11 | 0.828 | 1.8 | 1.74 | n/a | 7.8 | 606 | 2.61 | 9,10 | |
| J1518+4904 | 40.935 | 0.02 | 207.216 | 1.56 | 1.05 | 0.25 | 32 | 32 | n/a | 54.2 | 282 | 37.8 | 11 | |
| J1829+2456 | 41.0098 | 0.05 | 28.0 | 1.14 | 1.36 | 0.139 | 13.0 | 12.9 | n/a | 43.3 | 272 | 32.7 | 12 | |
| (3) WD-NS(m) | ||||||||||||||
| J0751+1807 | 3.479 | 0.00779 | 6.312 | 2.1 | 0.191 | 7.08 | 6.9 | 4.3 | 400 | 2850 | 0.66 | 13,14 | ||
| J1757-5322 | 8.870 | 0.0263 | 10.879 | 1.35 | 0.67 | 5.06 | 4.93 | 8.0 | 145 | 1240 | 1.74 | 15 | ||
| J1141-6545 | 393.9 | 4290 | 4.744 | 1.30 | 0.986 | 0.172 | 0.0015 | - | 0.56 | 0.104 | 370 | 0.047 | 16,17 | |
| (4) WD-NS(e) | ||||||||||||||
| J1141-6545 | 393.9 | 4290 | 4.744 | 1.30 | 0.986 | 0.172 | 0.0015 | - | 0.56 | 0.104 | 370 | 0.047 | 15,16 | |
| B2303+46 | 1066.37 | 569 | 295.2 | 1.34 | 1.3 | 0.658 | 0.0297 | 0.014 | n/a | 0.138 | 240 | 0.106 | 17,18 |
2.1. Methodology I: Preferred population model
In the context of NSNS , KKL developed a statistical method to estimate the likelihood of DCO formation rates, given an observed sample of DCOs in which one member is a pulsar, designed to account for the small number of known systems and their associated uncertainties. Their analysis assumes that each binary is a unique representative of its own class. For each primitive class (i.e., for each pulsar), they find a posterior probability distribution function for its formation rate :
| (1) |
The parameter depends on some of the properties of the pulsars in the observed DCO sample [see KKL Eq. (17)]:
| (2) |
where is the fraction of all solid angle the pulsar beam subtends; is the total detectable lifetime of the object; and is the total estimated number of systems similar to each of the observed ones (i.e., is effectively a volume-weighted probability that a pulsar with the same orbit and an optimally oriented beam would be seen with any of the radio pulsar surveys; this factor incorporates all our knowledge of pulsar survey selection effects as well as the pulsar space and luminosity distributions). In this section, we present results only for our preferred pulsar luminosity distribution model, corresponding a power law luminosity distribution with negative slope, index , and minimum “luminosity333More correctly, this quantitiy represents pseudo-luminosity using a observing frequency. ” mJy kpc2 [model 6 of KKL; as discussed therein, this model better accounts for more recent observations of faint pulsars]. In the following section, we describe how our predictions change when systematic uncertainties in and are incorporated into .
We obtain via detailed simulations of pulsar survey selection effects, as described in KKL (see also KKL and Kalogera et al., 2005). We obtain the beaming correction factor via direct pulsar measurements (Kalogera et al., 2001) for those systems for which data is available. In the cases where is not known, we choose a canonical value consistent with existing measurements. Finally, we estimate the detectable lifetime via pulsar and binary properties. The relevant lifetime for binaries detected via a pulsar component is
| (3) |
(where is the pulsar spindown age [see Arzoumanian et al. (1999)]; is the time remaining until the binary merges through the emission of gravitational waves [see Peters (1964) and Peters & Mathews (1963)]; and is the pulsar “death time” [Eq. (9) from Chen & Ruderman (1993)]). This calculation assumes the binary will be detectable via pulsar emission from its birth (estimated by the spindown contribution) up until its eventual merger via the emission of gravitational waves (estimated via ) or until the pulsar ceases to emit (estimated by ). [Since estimates are somewhat uncertain, we require that they do not exceed the current age of the Galactic disk ( Gyr).] Table 1 presents appropriate values for , , , and for each individual pulsar-containing DCO.
Using these individual rate estimates, we then generate a distribution for each net formation rate for any class by assuming our individual representatives are complete as well as independent – in other words, we assume any any member of class (for NS-NS, any merging double NS) is similar to one of the observed members of that class. [Lacking definitive information about orbital and pulsar parameter distributions, we prefer not to perform unwarranted extrapolations to account for binaries that have not been seen.] For example, to estimate the formation rate of merging NSNS binaries in Milky Way-equivalent galaxies (MWEG) , we take three merging NSNS binaries and combine their formation rate via
| (4) | |||||
[This expression is discussed in §5.2 of KKL and presented explicitly for the three-binary case in Eq. (A8) of Kim et al. (2004).]
Finally, for each class and thus each class rate distribution we define symmetric 95% confidence intervals: the upper and lower rate limits satisfy
| (5) |
This confidence-interval convention is different from the customary choice presented in KKL.
In all plots that follow, rate probability distributions are represented using a logarithmic scale for ; thus, instead of plotting , all plots instead show
| Type | Low | High | ||
|---|---|---|---|---|
| NS-NS(m) | 0.26 | 0.40 | ||
| NS-NS(vw) | 0.36 | 0.60 | ||
| WD-NS(e) | 0.45 | 0.65 | ||
| WD-NS(m) | 0.35 | 0.60 | ||
| SN Ib/c | 1 | 1 | ||
| SN II | 1 | 1 |
2.2. WD-NS binaries
Four WD-NS binaries with relatively massive WDs have been discovered in the galactic disk: PSRs J0751+1807, J1757-5322, J1141-6545, and B2303+46. The intrinsic and deduced properties of these four WDNS binaries are summarized in Table 1. While all four binaries may be applied to a net WD-NS formation rate estimate, the sample manifestly contains relics of distinctly different evolutionary channels; for example, while J0751+1807 and J1757-5332 have evidently been strongly circularized and spun up by a recent mass transfer episode, J1141-6545 cannot have been (Kaspi et al., 2000; Bailes et al., 2003). Ideally, population synthesis must produce distributions of WD-NS binaries consistent with both the observed orbital parameters and spins. The present sparse sample, however, does not allow a reliable nonparametric estimate of the distribution of WD-NS binary parameters. Instead, as first step towards applying constraints based on binary parameter distributions, we subdivide these four binaries into two overlapping classes: merging binaries, denoted WD-NS(m), which will merge through the emission of gravitational waves within Gyr; and eccentric binaries, denoted WD-NS(e), which have significant () eccentricity at present. The rate estimate derived for both classes is dominated by J1141-6545 (Kim et al., 2004; Kalogera et al., 2005). Ignoring systematic uncertainties (e.g., assuming the beaming correction factor is indeed its canonical value and not accounting the pulsar luminosity function uncertainties), Table 2 shows the 95% confidence interval for each class’ formation rate, shown per year for a Milky Way-like galaxy.
2.3. NSNS binaries
Seven NSNS binaries have been discovered so far in the Galactic disk. Four of the known systems will have merged within Gyr (i.e., “merging” binaries: PSRs J0737-3039A, B1913+16, B1534+12, and J1756-2251) and three are wide with much longer merger times (PSRs J1811-1736, J1518+4904, and J1829+2456). The intrinsic and deduced properties of these seven NSNS binaries are summarized in Table 1. PSR J1756-2251 was discovered recently with acceleration searches (Faulkner et al., 2005). Since its pulsar and orbital parameters are sufficiently similar to PSR B1913+16 and since the selection bias due to acceleration was already included in KKL, we do not expect this new system to significantly affect the NS-NS inspiral rate estimates. As discussed in more detail by Kim et al. (2006), the rate increase is estimated to be smaller than 4%. For this reason, we omit it when estimating NS-NS merger rates.
The observed NS-NS population naturally subdivides into two distinct classes, depending on whether they merge due to the emission of gravitational waves within 10 Gyr: merging NSNS binaries, denoted NSNS(m), and wide NSNS binaries, denoted NSNS(vw). Table 2 shows the 95% confidence interval for each class’ formation rate.
2.4. Recycling, selection effects, and the lack of wide NS-NS binaries
As Table 2 indicates, the confidence intervals for wide and merging NS-NS binaries are almost an order of magnitude from overlapping. On the contrary, population synthesis simulations produce merging and wide binaries at a roughly equal (and always highly correlated) rates. Since our rate estimation technique automatically compensates for the most obvious selection effects (e.g., orientation and detectable lifetime), two unbiased samples of wide and merging NS-NS binaries should arrive at nearly the same prediction for the NS-NS formation rate.
PSC1 explained this significant discrepancy by a selection effect: evolutionary tracks leading to wide NS-NS binaries should be less likely to recycle the first-born pulsar. The observed sample of wide NS-NS binaries [NSNS(vw)] represents a much smaller subset of recycled pulsars. As summarized in PSF2, we assume any wide NS-NS binary which in its past underwent any conventional, i.e., dynamically stable, mass transfer will recycle one of its neutron stars to a long-lived pulsar. This condition is likely to over-estimate the true NSNS(vw) formation rate. We note that neutron-star recycling can also possibly happen during dynamically unstable mass-transfer phases (common envelopes), but the vast majority of wide NS-NS do not evolve through such a phase.
2.5. Pulsar Population Model Uncertainties
As noted in KKL and subsequent papers, our reconstruction of the pulsar population (i.e., ) relies upon our understanding of pulsar survey selection effects and thus on the underlying pulsar luminosity distribution. This distribution can be well-constrained experimentally (see, e.g. Cordes & Chernoff, 1997), though these constraints do not yet incorporate recent faint pulsar discoveries such as PSR J1124-5916 (Camilo et al., 2002). Nonetheless, different observationally-consistent distributions imply significantly different distributions, with maximum-likelihood rates differing by factors of order (KKL). Since the constraint intervals discussed above assume the preferred pulsar luminosity distribution model – a power-law pulsar luminosity distribution with negative slope and minimum cutoff luminosity mJy kpc2 – they do not incorporate any uncertainty in the pulsar luminosity function.
The infrastructure needed to incorporate uncertainties in the pulsar luminosity function has been presented and applied, for example in Kim et al. (2006). However, out-of-date constraints on the pulsar luminosity function allow implausibly high minimum pulsar luminosities . A high minimum pulsar luminosity implies fewer merging pulsars have been missed by surveys. Thus, these out-of-date constraints on pulsar luminosity functions permit models consistent with substantially lower merger rates than now seem likely, given the discovery of faint pulsars. In other words, if we use the infrastructure presented in Kim et al. (2006) to marginalize over and generate a net distribution function for the merger rate, then the 95% confidence intervals associated with that net distribution would have a spuriously small lower bound, entirely because the pulsar population model permits large . Therefore, in the present study we present results based only on our preferred luminosity function and do not include the out-of-date luminosity function constraints by Cordes & Chernoff (1997) and the related net rate distribution provided by Kim et al. (2006).
3. Observations of supernovae
Type Ib/c and II supernovae occur extremely rarely near the Milky Way. While historical data contains several observations of and even surveys for supernovae, the selection effects in these long-duration heterogeneous data sets have made their interpretation difficult (Cappellaro 2005, private communication). In this paper, we estimate supernova rates and uncertainties using Table 4 of Cappellaro et al. (1999). To translate this table, which expresses results and their (one-sigma, systematics-dominated) uncertainties in terms of a number of supernovae per century per blue solar luminosities (), into the equivalent rates per Milky Way equivalent galaxy, we assume a Milky Way blue luminosity of relative to the solar blue and total luminosities (see, e.g., Kalogera et al. (2001), Phinney (1991), ADM:Cox2000, and references therein). More specifically, we translate the supernovae rates that appear in their Table 4, expressed in “SNU” (1 SNU = ) into a supernovae rate expressed in events per year per Milky Way-equivalent galaxy (MWEG) using a proportionality constant . For simplicity, we ignore uncertainty in the blue luminosity of the Milky Way and thus (see Kalogera et al., 2001, for an estimate of this uncertainty).
Unfortunately, without substantially more detailed information on and statistics of the limiting (systematic) errors, we cannot justify any relation between the linear, one-sigma confidence intervals provided in their Table 4 and the logarithmic, two-sigma confidence intervals needed in our analysis. Lacking any way to rigorously justify a useful choice444In fact, the Chebyshev inequality , which applies to any random variable with mean and standard deviation , provides a universal tool with which we can find a better-than- “overconfidence interval” on and thus . However, not only does that interval in includes – so arbitrarily small supernovae rates would be included – but it also corresponds to an excessively conservative confidence interval for Gaussian-distributed errors. for a bounded two-sided confidence interval in , we decided to employ the logarithmic confidence interval
| (6) |
where and are the average value of and one-sigma uncertainty in the supernovae rate (in SNU); the corresponding explicit confidence intervals (in per year per MWEG) for Type II and Ib/c supernovae are shown both in Table 2 and Figure 1. Intuitively, this logarithmic interval arises from (i) converting the mean value and limiting bounds of a one-sigma confidence interval in to a “one-sigma” confidence interval in ; (ii) calculating the maximum distance from the central value to the corresponding two “one-sigma” limits in ; and then (iii) doubling that distance to generate a “two-sigma” interval. [A marginally more optimistic case using the minimum distance from center to each limit also yields nearly the same intervals.]
Though fairly accurate studies exist of the high-redshift supernova rate (e.g., Cappellaro et al., 2005), they have little relevance to the present-day Milky Way. Several surveys have also attempted to determine the supernova rate in the Milky Way by a variety of indirect methods, such as statistics of supernova remnants (highly unreliable due to challenging selection effects; see, e.g., van den Bergh & Tammann, 1991) and direct observation of radioisotope-produced backgrounds (e.g., decay from , as described in Diehl et al., 2006). Taken independently, these methods have greater uncertainties than the historical studies of Cappellaro et al. (1999).
4. Population synthesis predictions
4.1. StarTrack population synthesis code
We estimate formation and merger rates for several classes of double compact objects using the StarTrack code first developed by BKB and recently significantly updated and tested as described in detail in Belczynski et al. (2006b); see §2 of Belczynski et al. (2007b) for a succinct description of the changes between versions. This updated code predicts somewhat different double compact object properties than the version used in BKB.
Additionally, we have adopted a maximum neutron star mass of (raised from used in our two previous studies PSC1 and O’Shaughnessy et al. (2005a), henceforth PSF1), motivated by recent observations suggesting pulsars with masses near (see, e.g.,Nice et al. (2005) and Splaver et al. (2002)). Such a higher maximum neutron star mass effectively converts many merging binaries we would otherwise interpret as BH-NS or even BH-BH binaries into merging NS binaries. Consequently the BH-NS and particularly BH-BH rates are decreased from the values seen in PSC1. [As a concrete example, with a low maximum NS mass, many BH-NS binaries form through accretion-induced collapse of a NS to a BH, as seen in Figure 1 of O’Shaughnessy et al. (2005b). However, a significant fraction of these systems would be interpreted as NS-NS binaries with the adopted higher maximum NS mass; see Belczynski et al. (2007b) for a detailed discussion to merger rates that this revised minimum neutron star mass implies.]
Like any population synthesis code, it evolves randomly chosen binaries from their birth to the present, tracking the stellar and binary parameters. For any class of events that is identifiable within the code, such as supernovae or DCO mergers, we estimate event rates by taking the average event rate within the simulation (i.e., by dividing the total number of events seen within some simulation by the duration of that simulation) and renormalizing by a scale factor that depends on properties of the simulation (i.e., the number of binaries simulated and the binary birth mass distributions assumed) and the Milky Way as a whole (i.e., the present-day star formation rate). Specifically, our simulations are normalized to be consistent with an assumed Milky Way star formation rate555Our approach gives only the average event rate. The present-day merger rate agrees with this quantity when most mergers occur relatively promptly (e.g., Myr) after their birth. Some DCOs – notably double BH binaries – have substantial delays between birth and merger, introducing a strong time dependence to the merger rate. The technique described above will significantly underestimate these rates. This point will be addressed in considerably more detail, both for the Milky Way and for a heterogeneous galaxy population in forthcoming papers by O’Shaughnessy et al. (2007b, a). of . The necessary formulae are presented and discussed extensively in a companion paper PSF2.
Finally, like any population synthesis code, the relative probabilities of different evolutionary endpoints are heavily influenced by the relative likelihood of different initial conditions, such as the distribution of initial semimajor axes. For example, observational data is consistent with initial semimajor axes distributed uniformly in ; see e.g., Figure 2 of Abt (1983) and Figure 7 of Duquennoy & Mayor (1991).666The semimajor axis distributions in these two papers are relatively similar, though they do predict a slightly different proportion of binaries in any small bin . However, for spiral galaxies the instantaneous merger rate depends on the fraction of binaries inside a broad period interval, not the derivative at any point. Considering the limits of the period distribution and the masses involved, we adopt a semimajor axis distribution flat in from contact to (see BKB).
When constructing our archived population synthesis results, we did not choose to record detailed information about the nature and amount of any mass transfer onto the first-born NS. We therefore cannot reconstruct precise population synthesis predictions for the NSNS(vw) formation rate. However, we do record whether some mass transfer occurs, and the nature of the mass transfer mechanism. The conventional mass transfer mechanism – dynamically stable Roche-lobe overflow – inevitably produces a disk around the compact object and can potentially spin that object up. Other mechanisms, such as (possibly hypercritical) common-envelope evolution, presumably involve a substantially more spherical accretion flow; the specific angular momentum accreted may be substantially lower, possibly not enough to recycle the neutron star. Thus for the purposes of identifying a class of potentially recycled (“visible”) wide NS-NS binaries, we assume any system which underwent mass transfer (dynamically stable in the case of wide systems) produced a recycled NS primary.
4.2. Fitting results
As in previous studies such as PSF1, here we have chosen to vary seven (7) model parameters in the synthesis calculations. These choices are strongly guided by our past experience with double-compact-object population synthesis and represent the model parameters for which strong dependence has been confirmed. These seven parameters enter into every aspect of our population synthesis model. One parameter, a power law index in our parameterization of the companion mass distribution, influences the initial binary parameter distributions (through the companion masses). Another parameter , the massive stellar wind strength, controls how rapidly the massive progenitors of compact objects lose mass; this parameter strongly affects the final compact-object mass distribution. Three parameters and are used to parameterize the supernovae kick distribution as a superposition of two independent maxwellians. These kicks provide critical opportunities to push distant stars into tight orbits and also to disrupt potential double neutron star progenitors. Finally, two parameters and govern energy and mass transfer during certain types of binary interactions; see Section 2.2.4 of BKB for details.
Other parameters, such as the fraction of stellar systems which are binary (here, we assume a binary fraction of 100%) and the distribution of initial binary parameters, are comparatively well-determined (see e.g..Abt (1983), Duquennoy & Mayor (1991) and references therein); for these parameters we have adopted preferred values.777Particularly for the application at hand – the gravitational-wave-dominated delay between binary birth and merger – the details of the semimajor axis distribution matter little. For a similar but more extreme case, see O’Shaughnessy et al. (2007e). Even for the less-well-constrained parameters, some inferences have been drawn from previous studies, either more or less directly (e.g., via observations of pulsar proper motions, which presumably relate closely to supernovae kick strengths; see, e.g., Hobbs et al. (2005), Arzoumanian et al. (2002), Faucher-Giguère & Kaspi (2006) and references therein) or via comparison of some subset of binary population synthesis results with observations (e.g., §8 of Belczynski et al. (2006b), van der Sluys et al. (2006), Nelemans & Tout (2005), Willems & Kolb (2002), Podsiadlowski et al. (2002) and references therein). Despite observational suggestions that point towards preferred values for these seven parameters – and despite the good agreement with short GRB and other observations obtained when using these preferred values (Belczynski et al. (2006a)) – in this paper we will conservatively examine the implications of a plausible range of each of these parameters. More specifically, despite the Milky Way-specific studies of O’Shaughnessy et al. (2005c, 2007d) (which apply only to spirals, not the elliptical galaxies included in this paper), to allow for a broad range of possible models, we consider the specific parameter ranges quoted in §2 of O’Shaughnessy et al. (2005a) for all parameters except kicks. For supernova kick parameters, we allow the dispersion of either component of a bimodal Maxwellian to run from 0 to 1000 km/s.
Since population synthesis calculations involve considerable computational expense, in practice we estimate the merger rate we expect for a given combination of population synthesis model parameters via seven-dimensional fits to an archive of roughly 3000 detailed simulations, as presented and analyzed in detail in PSF2.However, these fits introduce systematic errors, which have the potential to significantly change the predicted set of constraint-satisfying models. For this reason, PSF2 also estimates the rms error associated with each seven-dimensional fit. Finally, PSF2 demonstrates that, by broadening the constraint-satisfying interval by the fit’s rms error, the predicted set of constraint-satisfying models includes most models which actually satisfy the constraints. For this reason, the dark shaded regions in Figures 1, 2, and 3] account for both observational uncertainty in the Milky Way merger rate and for systematic errors in the fits against which these observations will be compared.
4.3. Prior distributions
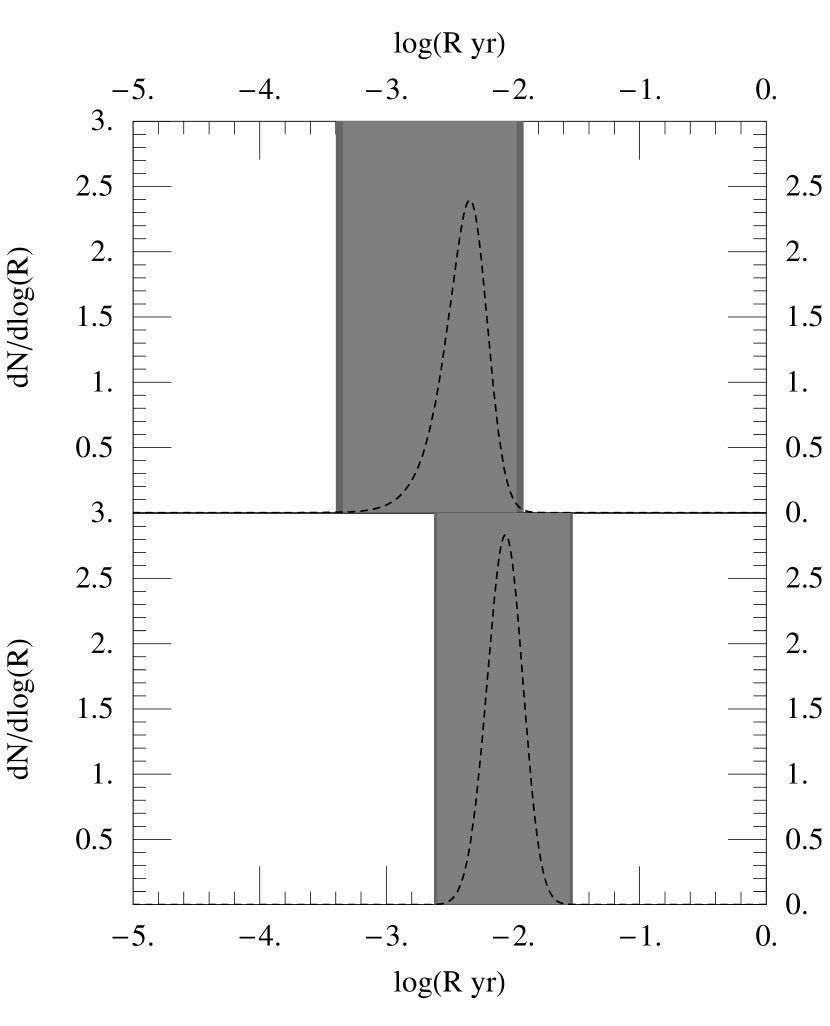
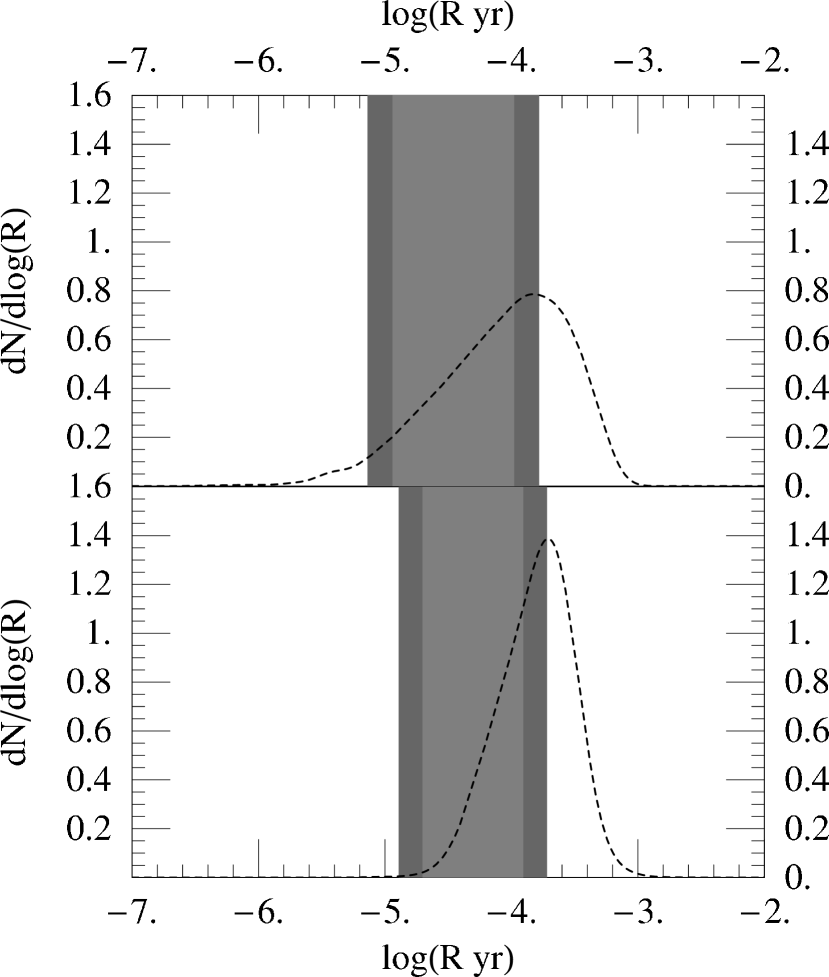
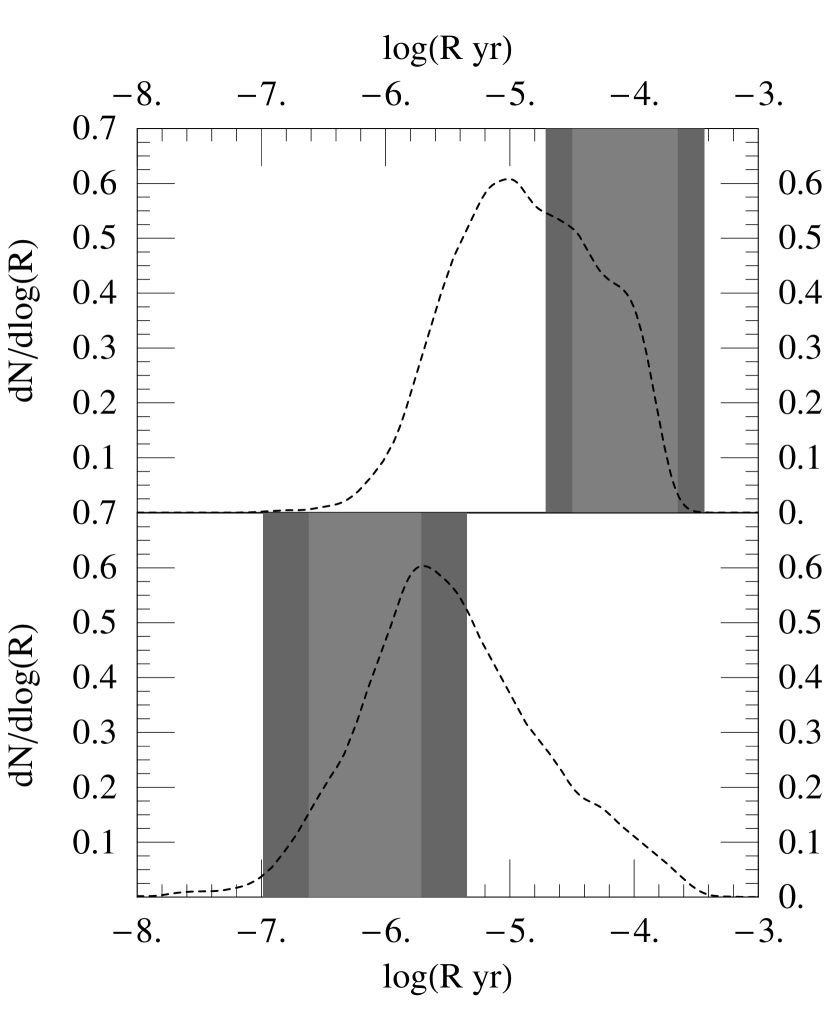
Lacking knowledge about which population synthesis model is correct, we assume all population synthesis model parameters in our range are equally likely. A monte carlo over the seven-dimensional parameter space allows us then to estimate the relative likelihood, all things being equal, of various DCO merger rates (shown in Figures 2,3, and 6) and supernova rates (Figure 1). Also shown in these figures are the observational constraints described in Sections 2 and 3 (shown in shaded gray). Table 2 provides both the explicit confidence intervals of the constraints and the fraction of a priori models which satisfy that constraint. Finally, the dotted lines in Figure 6 show the a priori population synthesis predictions for BH-NS and NS-NS merger rates in the Milky Way.
5. Applying and employing constraints
Physically consistent models must reproduce all predictions. Supernovae rates, being ill-determined due to the large observational systematic errors mentioned in Sec. 3, are easily reproduced by almost all models at the level; see Fig. 1. However, population synthesis models do not always reproduce observed formation rates for DCOs, as shown in Figs. 2 and 3. These four 95% confidence intervals implicitly define a confidence interval in the seven-dimensional space, consisting of of the original parameter volume when systematic errors in our fitting procedure are included; see Table 2.888Our confidence in this interval is significantly higher than 81%, because we have very conservatively incorporated estimates for systematic errors in our fits; see PSF2 for details. In other words, we are quite confident ( chance) that the physically-appropriate parameters entering into StarTrack can be confined within a small seven-dimensional volume, in principle significantly reducing our model uncertainty.
In Figure 4 we show one-dimensional projections onto each coordinate axis of the constraint-satisfying volume – in other words, the distribution of values each individual population synthesis parameter can take. For the purposes of this and subsequent plots, we use the following seven dimensionless parameters that run from 0 to 1: ; ; , ; ; , and . As seen in the top panel of this figure, the single most likely distribution of supernovae kicks bears a surprising resemblance to the observed pulsar kick distribution (see,e.g. Arzoumanian et al., 1999; Hobbs et al., 2005; Faucher-Giguère & Kaspi, 2006, and references therein), even though no information about pulsar motions have been included among our constraints and priors. However, as is clear from Figure 4 and more clearly by the top right panel of Figure 5, a wide range of kick velocity distributions remain consistent with observations, including those with very low () and very high () characteristic velocities. The population synthesis mass transfer parameter is particularly well-constrained, with a strong maximum near , implying that mass-loss fractions of about 90% or higher are favored in non-conservative, but stable, mass transfer episodes. Also, common envelope efficiencies of about 0.15-0.5 appear to be favored by the constraints. The rest of the one-dimensional parameter distributions are nearly constant and thus uninformative. Though small, the constraint-satisfying volume extends throughout the seven-dimensional parameter space. Higher-dimensional correlations disguise most of the remaining information, as indicated in Figure 5.


These results should be contrasted with the distinctly different post-constraint results shown in O’Shaughnessy et al. (2005c) (cf. their Figure 5 and C7). Notably, even though two fewer constraints were imposed, they find a significantly smaller ( versus ) constraint-satisfying volume. In large part, these differences can be ascribed to including systematic errors: in O’Shaughnessy et al. (2005c), preliminary data for the sparse and poor-quality NSNS(vw) sample was fit and applied without any account for fit-induced errors. However, our calculation also differs at several fundamental levels from the original approach : (i) the space of models studied is larger, covering more area in (see, e.g., PSF2); (ii) the observed sample of merging NS-NS binaries is compared with the total merging NS-NS formation rate predicted from population synthesis, rather than with subset of merging NS-NS which undergo mass transfer; and critically (iii) the constraints are more numerous.
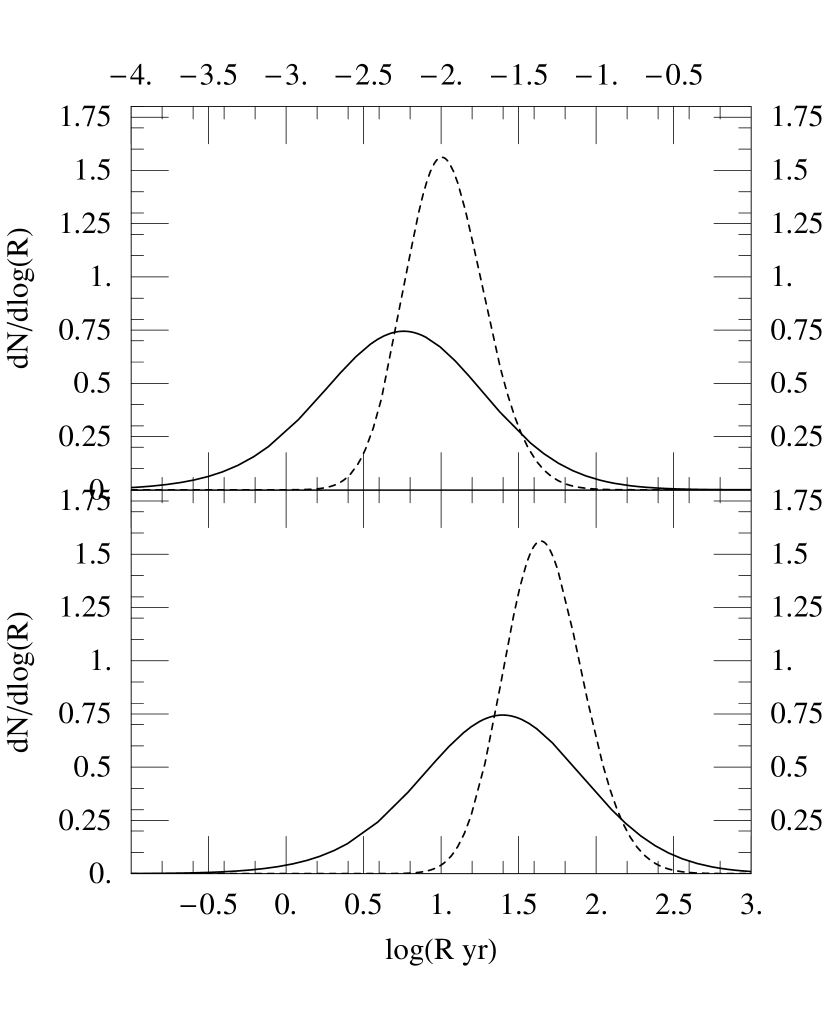
As in O’Shaughnessy et al. (2005c), evaluating fits for other DCO merger rates on the constraint-satisfying model parameters provides revised estimates for various phenomena of interest, such as for the BH-NS and NS-NS merger rates. Figure 6 shows smoothed histograms of the BH-NS and NS-NS merger rates, both before and after observational constraints were applied. To be conservative, these distributions also incorporate our best estimate for systematic errors associated with fitting to the data: rather than simply showing the histogram of merger rates that follows by evaluating the fits on many randomly poppulation synthesis parameters , we smooth the resulting histogram by a gaussian with width (i.e., by the characteristic systematic error). For BH-NS and NS-NS binaries this characteristic error is significantly smaller than the characteristic width of the distribution.
Finally, in Figure 7 we estimate the range of initial and advanced LIGO detection rates implied by these constrained results. This estimate combines our constrained population synthesis results; our estimates for systematic fitting error; the approximate LIGO range as a function of chirp mass : where , for initial and advanced LIGO, respectively; estimates for the average volume detected for a given species, as represented by for BH-NS and NS-NS, respectively (cf. O’Shaughnessy et al., 2005c, our average chirp masses are systematically higher because of our higher maximum neutron star mass); and a homogeneous, Euclidean universe populated with Milky Way-equivalent galaxies with density , each forming stars at rate (Kalogera et al., 2001). The high rate of double neutron star mergers [NS-NS(m)] demanded by observations explains most of the differences between the relative likelihoods of various merger rates based on a priori (solid) and constrained (dashed) expectations. For example, the lowest eliminate too many NS-NS binaries to be consistent with the many observed Galactic NS-NS binaries. Additionally, the differences between this paper’s results and those found in PSC1are in part produced from the different assumptions (priors) about the relative likelihood of different population synthesis parameters: our distributions of constrained and unconstrained merger rates differ from previous studies in large part because this study allows a broader range of supernovae kicks.
We emphasize that the new formation and merger rates of double compact objects that we use are the result of the revised population synthesis code StarTrack (Belczynski et al., 2006b). The underlying physics, and formation scenarios of BH-NS and NS-NS binaries will be discussed in full detail in Belczynski et al. (2007a).
6. Conclusions
O’Shaughnessy et al. (2005c) performed a proof-of-concept calculation to compare population synthesis simulations with observations, interpret the resulting constrained volume, and apply the constraint-satisfying parameters to revise a priori predictions of astrophysically critical rate results. In this paper, we demonstrate that even when systematic model fitting errors are aggressively overcompensated for, observational constraints still provide information about population synthesis parameters. These results include both surprisingly good agreement with pulsar kick distributions and strong constraints on at least one parameter involved in binary evolution. Since in almost all cases our systematic errors appear much smaller than those from observations, we are confident that now observational limitations, rather than computational ones, primarily limit our ability to constrain population synthesis results. In particular, we expect stringent tests of population synthesis models are possible, beginning by imposing more observational constraints than varied model parameters (seven in our case).
Our analysis remains predicated upon a correct identification of all parameters and input physics critical for the formation of double compact objects. Admittedly, our understanding of binary evolution continues to evolve; however multiple population studies from different groups over the years lead to very similar conclusions about the basic input physics that primarily affects the formation rates of double compact objects (Belczynski et al., 2002; Hurley et al., 2002; Portegies Zwart & Verbunt, 1996; Fryer et al., 1998). In this paper we use a relatively new version of the StarTrack code that is described in great detail inBelczynski et al. (2006b). A forthcoming paper (Belczynski et al., 2007a) will discuss how these updates affect the evolutionary history of NS binaries in significantly greater detail.
Our analysis also remains predicated upon a correct and complete interpretation of the observational sample and associated systematic and model uncertainties. In some respects, however, our models for observations and their biases may be incomplete or not representative. We effectively assume pulsar recycling is required to detect binary pulsars in our implicit hypothesis that only one pulsar in NS-NS systems, the one observed, was ever likely to have been detected. And finally we use a canonical value for pulsar beaming correction factor for several systems with known spins but unknown beaming geometry.
And to be comprehensive regarding the factors neglected here, our population synthesis parameter study has not varied over all plausible models. We have neither considered purely polar supernova kicks (see Johnston et al., 2005) nor changed the maximum NS mass from nor even allowed for a heterogeneous birth population of single stars and binaries (a binary fraction of 100% is assumed in all models). And of course we continue to use a single fixed star formation rate for the Milky Way, rather than treat it as an independent uncertain but constrained parameter.
However, all these limitations can be remedied by closer study. Thus, we expect that either (i) all DCO merger rates will become determined to within or better (based on the comparative accuracy to which we know NS-NS merger rates), or (ii) experimental data will conflict with the prevailing notion of binary population synthesis, revealing flaws and limitations in classical parametric models for binary stellar evolution.
References
- Abbot et al. (2005) (The LIGO Scientific Collaboration) Abbot et al. (The LIGO Scientific Collaboration). 2005, Phys. Rev. D, 72, 082002 [ADS] [ADS]
- Abbott et al. (2005) (The LIGO Scientific Collaboration) Abbott et al. (The LIGO Scientific Collaboration). 2005, Phys. Rev. D, 72, 082001
- Abt (1983) Abt, H. A. 1983, ARA&A, 21, 343 [ADS]
- Anderson et al. (1990) Anderson, S. B., Gorham, P. W., Kulkarni, S. R., Prince, T. A., & Wolszczan, A. 1990, Nature, 346, 42 [ADS]
- Arzoumanian et al. (2002) Arzoumanian, Z., Chernoff, D. F., & Cordes, J. M. 2002, ApJ, 568, 289 [ADS]
- Arzoumanian et al. (1999) Arzoumanian, Z., Cordes, J. M., & Wasserman, I. 1999, ApJ, 520, 696 [ADS]
- Bailes et al. (2003) Bailes, M., Ord, S. M., Knight, H. S., & Hotan, A. W. 2003, ApJ, 595, L49 [ADS]
- Belczynski et al. (2006a) Belczynski, C., Perna, R., Bulik, T., Kalogera, V., Ivanova, N., & Lamb, D. 2006a, arXiv eprint [URL]
- Belczynski et al. (2002) Belczynski, K., Kalogera, V., & Bulik, T. 2002, ApJ, 572, 407 [ADS]
- Belczynski et al. (2006b) Belczynski, K., Kalogera, V., Rasio, F., Taam, R., Zezas, A., Maccarone, T., & Ivanova, N. 2006b, arxiv eprint [URL]
- Belczynski et al. (2007a) Belczynski, K., Taam, R. E., Kalogera, V., Rasio, F. A., & Bulik, T. 2007a, In preparation
- Belczynski et al. (2007b) —. 2007b, ApJ, 662, 504
- Brown (1995) Brown, G. E. 1995, ApJ, 440, 270 [ADS]
- Camilo et al. (2002) Camilo, F., Manchester, R. N., Gaensler, B. M., Lorimer, D. R., & Sarkissian, J. 2002, ApJ, 567, L71 [ADS]
- Cappellaro et al. (1999) Cappellaro, E., Evans, R., & Turatto, M. 1999, A&A, 351, 459 [ADS]
- Cappellaro et al. (2005) Cappellaro, E., Riello, M., Altavilla, G., Botticella, M. T., Benetti, S., Clocchiatti, A., Danziger, J. I., Mazzali, P., Pastorello, A., Patat, F., Salvo, M., Turatto, M., & Valenti, S. 2005, A&A, 430, 83 [ADS]
- Champion et al. (2004) Champion, D. J., Lorimer, D. R., McLaughlin, M. A., Cordes, J. M., Arzoumanian, Z., Weisberg, J. M., & Taylor, J. H. 2004, MNRAS, 350, L61 [ADS]
- Chen & Ruderman (1993) Chen, K. & Ruderman, M. 1993, ApJ, 402, 264 [ADS]
- Cordes & Chernoff (1997) Cordes, J. M. & Chernoff, D. F. 1997, ApJ, 482, 971 [ADS]
- de Freitas Pacheo et al. (2005) de Freitas Pacheo, J. A., Regimbau, T., Vincent, T., & Spallici, A. 2005, IJMPD, In press [URL]
- Diehl et al. (2006) Diehl, R., Halloin, H., Kretschmer, K., Lichti, G. G., Schönfelder, V., Strong, A. W., von Kienlin, A., Wang, W., Jean, P., Knödlseder, J., Roques, J.-P., Weidenspointner, G., Schanne, S., Hartmann, D. H., Winkler, C., & Wunderer, C. 2006, Nature, 439, 45 [ADS]
- Duquennoy & Mayor (1991) Duquennoy, A. & Mayor, M. 1991, A&A, 248, 485 [ADS]
- Edwards & Bailes (2001) Edwards, R. T. & Bailes, M. 2001, ApJ, 547, L37 [ADS]
- Faucher-Giguère & Kaspi (2006) Faucher-Giguère, C.-A. & Kaspi, V. M. 2006, ApJ, 643, 332 [ADS]
- Faulkner et al. (2005) Faulkner, A. J., Kramer, M., Lyne, A. G., Manchester, R. N., McLaughlin, M. A., Stairs, I. H., Hobbs, G., Possenti, A., Lorimer, D. R., D’Amico, N., Camilo, F., & Burgay, M. 2005, ApJ, 618, L119 [ADS]
- Fryer et al. (1998) Fryer, C., Burrows, A., & Benz, W. 1998, ApJ, 496, 333 [ADS]
- Hobbs et al. (2005) Hobbs, G., Lorimer, D. R., Lyne, A. G., & Kramer, M. 2005, MNRAS, 360, 974 [ADS]
- Hulse & Taylor (1975) Hulse, R. A. & Taylor, J. H. 1975, ApJ, 195, L51 [ADS]
- Hurley et al. (2002) Hurley, J. R., Tout, C. A., & Pols, O. R. 2002, MNRAS, 329, 897 [ADS]
- Johnston et al. (2005) Johnston, S., Hobbs, G., Vigeland, S., Kramer, M., Weisberg, J. M., & Lyne, A. G. 2005, MNRAS, 364, 1397 [ADS]
- Kalogera et al. (2005) Kalogera, V., Kim, C., Lorimer, D. R., Ihm, M., & Belczynski, K. 2005, in ASP Conf. Ser. 328: Binary Radio Pulsars, ed. I. Stairs, 261–+
- Kalogera et al. (2001) Kalogera, V., Narayan, R., Spergel, D. N., & Taylor, J. H. 2001, ApJ, 556, 340 [URL]
- Kaspi et al. (2000) Kaspi, V. M., Lyne, A. G., Manchester, R. N., Crawford, F., Camilo, F., Bell, J. F., D’Amico, N., Stairs, I. H., McKay, N. P. F., Morris, D. J., & Possenti, A. 2000, ApJ, 543, 321 [ADS]
- Kim et al. (2003) Kim, C., Kalogera, V., & Lorimer, D. R. 2003, ApJ, 584, 985 [ADS]
- Kim et al. (2006) Kim, C., Kalogera, V., & Lorimer, D. R. 2006, in A life with stars [URL]
- Kim et al. (2004) Kim, C., Kalogera, V., Lorimer, D. R., & White, T. 2004, ApJ, 616, 1109 [ADS]
- Kramer et al. (2003) Kramer, M., Bell, J. F., Manchester, R. N., Lyne, A. G., Camilo, F., Stairs, I. H., D’Amico, N., Kaspi, V. M., Hobbs, G., Morris, D. J., Crawford, F., Possenti, A., Joshi, B. C., McLaughlin, M. A., Lorimer, D. R., & Faulkner, A. J. 2003, MNRAS, 342, 1299 [ADS]
- Lorimer (2005) Lorimer, D. 2005, Living Reviews in Relativity, 2005-7 [URL]
- Lorimer et al. (2006) Lorimer, D. R., Stairs, I. H., Freire, P. C., Cordes, J. M., Camilo, F., Faulkner, A. J., Lyne, A. G., Nice, D. J., Ransom, S. M., Arzoumanian, Z., Manchester, R. N., Champion, D. J., van Leeuwen, J., Mclaughlin, M. A., Ramachandran, R., Hessels, J. W., Vlemmings, W., Deshpande, A. A., Bhat, N. D., Chatterjee, S., Han, J. L., Gaensler, B. M., Kasian, L., Deneva, J. S., Reid, B., Lazio, T. J., Kaspi, V. M., Crawford, F., Lommen, A. N., Backer, D. C., Kramer, M., Stappers, B. W., Hobbs, G. B., Possenti, A., D’Amico, N., & Burgay, M. 2006, ApJ, 640, 428 [ADS]
- Lundgren et al. (1995) Lundgren, S. C., Zepka, A. F., & Cordes, J. M. 1995, ApJ, 453, 419 [ADS]
- Lyne et al. (2004) Lyne, A. G., Burgay, M., Kramer, M., Possenti, A., Manchester, R. N., Camilo, F., McLaughlin, M. A., Lorimer, D. R., D’Amico, N., Joshi, B. C., Reynolds, J., & Freire, P. C. C. 2004, Science, 303, 1153 [ADS]
- Lyne et al. (2000) Lyne, A. G., Camilo, F., Manchester, R. N., Bell, J. F., Kaspi, V. M., D’Amico, N., McKay, N. P. F., Crawford, F., Morris, D. J., Sheppard, D. C., & Stairs, I. H. 2000, MNRAS, 312, 698 [ADS]
- Nelemans & Tout (2005) Nelemans, G. & Tout, C. A. 2005, MNRAS, 356, 753 [ADS]
- Nice et al. (1996) Nice, D. J., Sayer, R. W., & Taylor, J. H. 1996, ApJ, 466, L87+ [ADS]
- Nice et al. (2005) Nice, D. J., Splaver, E. M., Stairs, I. H., Löhmer, O., Jessner, A., Kramer, M., & Cordes, J. M. 2005, ApJ, 634, 1242 [ADS]
- O’Shaughnessy et al. (2007a) O’Shaughnessy, R., Kalogera, V., & Belcynski, K. 2007a, in preparation
- O’Shaughnessy et al. (2007b) O’Shaughnessy, R., Kalogera, V., & Belczynski, C. 2007b, arXiv:0706.4139 [URL]
- O’Shaughnessy et al. (2005a) O’Shaughnessy, R., Kalogera, V., & Belczynski, K. 2005a, ApJ, 620, 385 [ADS]
- O’Shaughnessy et al. (2007c) —. 2007c, ApJ, 667, 1048 [URL]
- O’Shaughnessy et al. (2005b) O’Shaughnessy, R., Kaplan, J., Kalogera, V., & Belczynski, K. 2005b, ApJ, 632, 1035 [ADS]
- O’Shaughnessy et al. (2005c) O’Shaughnessy, R., Kim, C., Fragos, T., Kalogera, V., & Belczynski, K. 2005c, ApJ, 633, 1076 [ADS] [ADS]
- O’Shaughnessy et al. (2007d) O’Shaughnessy, R., Kim, C., Kalogera, V., & Belczynski, K. 2007d, Submitted to ApJ (astro-ph/0610076) [URL]
- O’Shaughnessy et al. (2007e) O’Shaughnessy, R., O’Leary, R., & Rasio, F. A. 2007e, Accepted by PRD rapid communications [URL]
- Peters (1964) Peters, P. 1964, Physical Review, 136, 1224 [ADS]
- Peters & Mathews (1963) Peters, P. C. & Mathews, J. 1963, Physical Review, 131, 435 [ADS]
- Phinney (1991) Phinney, E. S. 1991, ApJ, 380, L17 [ADS]
- Podsiadlowski et al. (2002) Podsiadlowski, P., Rappaport, S., & Pfahl, E. D. 2002, ApJ, 565, 1107 [ADS]
- Portegies Zwart & Verbunt (1996) Portegies Zwart, S. F. & Verbunt, F. 1996, A&A, 309, 179 [ADS]
- Portegies Zwart & Yungelson (1998) Portegies Zwart, S. F. & Yungelson, L. R. 1998, A&A, 332, 173 [ADS]
- Splaver et al. (2002) Splaver, E. M., Nice, D. J., Arzoumanian, Z., Camilo, F., Lyne, A. G., & Stairs, I. H. 2002, ApJ, 581, 509 [ADS]
- Splaver et al. (2005) Splaver, E. M., Nice, D. J., Stairs, I. H., Lommen, A. N., & Backer, D. C. 2005, ApJ, 620, 405 [ADS]
- Stairs et al. (2004) Stairs, I. H., Thorsett, S. E., & Arzoumanian, Z. 2004, Physical Review Letters, 93, 141101 [ADS]
- Stairs et al. (2002) Stairs, I. H., Thorsett, S. E., Taylor, J. H., & Wolszczan, A. 2002, ApJ, 581, 501 [ADS]
- Stokes et al. (1985) Stokes, G. H., Taylor, J. H., & Dewey, R. J. 1985, ApJ, 294, L21 [ADS]
- van den Bergh & Tammann (1991) van den Bergh, S. & Tammann, G. A. 1991, ARA&A, 29, 363 [ADS]
- van der Sluys et al. (2006) van der Sluys, M. V., Verbunt, F., & Pols, O. R. 2006, A&A, 460, 209 [ADS]
- van Kerkwijk & Kulkarni (1999) van Kerkwijk, M. H. & Kulkarni, S. R. 1999, ApJ, 516, L25 [ADS]
- Vranesevic et al. (2004) Vranesevic, N., Manchester, R. N., Lorimer, D. R., Hobbs, G. B., Lyne, A. G., Kramer, M., Camilo, F., Stairs, I. H., Kaspi, V. M., D’Amico, N., Possenti, A., Crawford, F., Faulkner, A. J., & McLaughlin, M. A. 2004, ApJ, 617, L139 [ADS]
- Wex et al. (2000) Wex, N., Kalogera, V., & Kramer, M. 2000, ApJ, 528, 401 [ADS]
- Willems & Kolb (2002) Willems, B. & Kolb, U. 2002, MNRAS, 337, 1004 [ADS]
- Wolszczan (1991) Wolszczan, A. 1991, Nature, 350, 688 [ADS]