SF2A 2006
Integrally monitoring GRS 1915+105 with simultaneous INTEGRAL, RXTE, Ryle and Nançay observations
Abstract
We report here the results of 2 observations performed simultaneously with INTEGRAL, RXTE, the Ryle and Nançay radio telescopes. These observations belong to the so-called and classes of variability during which a high level of correlated X-ray and radio variability is observed. We study the connection between the accretion processes seen in the X-rays, and the ejections seen in radio. By observing an ejection during class , we generalise the fact that the discrete ejections in GRS 1915+105 occur after sequences of soft X-ray dips/spikes. We then identify the most likely trigger of the ejection through a spectral approach to our INTEGRAL data. We show that each ejection is very probably the result of the ejection of a Comptonising medium responsible for the hard X-ray emission seen above 15 keV with INTEGRAL.
1 Introduction
GRS 1915+105 is the most active microquasar of our Galaxy.
An extensive review on this source can be found in Fender & Belloni (2004).
To summarize, GRS + hosts a black hole (BH) of 14.0 4.4 M⊙
(Harlaftis & Greiner 2004),
it is one of the brightest X-ray sources in the sky and it is a source of superluminal
ejection (Mirabel & Rodriguez 1994), with true velocity of the jets .
The source is also known to show a compact jet during its periods of
low steady levels of emission (e.g. Fuchs et al. 2003).
Multi-wavelength coverages from radio to X-ray have shown a
clear but complex association between the soft X-rays and radio/IR behaviours.
Of particular relevance is the existence of radio QPO in the range 20–40 min
associated with the X-ray variations on the same time scale (e.g. Mirabel et al. 98). These
so called “30-minute cycles” were interpreted as being due to small ejections of material from the
system, and were found to correlate with the disc instability, as
observed in the X-ray band.
Extensive observations at X-ray energies with RXTE allowed
Belloni et al. (2000) to classify all the observations into
12 separate classes (labelled with greek letters), which could be interpreted
as transitions between
three basic states (A-B-C): a hard state and two softer states. These
spectral changes are, in most of the classes, interpreted as reflecting
the rapid disappearance
of the inner portions of an accretion disc, followed by a slower
refilling of the emptied region (Belloni et al. 1997).
The link between the accretion and ejection processes is, however, far from
being understood and different kind of models are proposed to explain all
observational facts
including the X-ray low (0.1-10 Hz) frequency QPOs. It should be added that
until the launch of INTEGRAL,
all studies had been made below 20 keV with the PCA onboard RXTE, bringing, thus, only few
constraints to the behaviour of the hard X-ray emitter (hereafter called corona).
Since the launch of INTEGRAL in late
2002 we have monitored GRS 1915+105
with long exposure ( ks) pointings. All the observations have been conducted simultaneously
with other instruments, in particular RXTE and the Ryle Telescope, and in some cases with
others (Spitzer, Nançay, GMRT, Suzaku,…), with the aim of understanding the
physics of the accretion-ejection phenomena, including, for the first time, the behaviour of
the source seen above 20 keV up to few hundred keV. We report here the results obtained during
observations showing sequences of X-ray hard dips/soft spikes (hereafter cycles),
followed by radio flares.
2 First occurence of a cycle during an INTEGRAL observation: October 2004
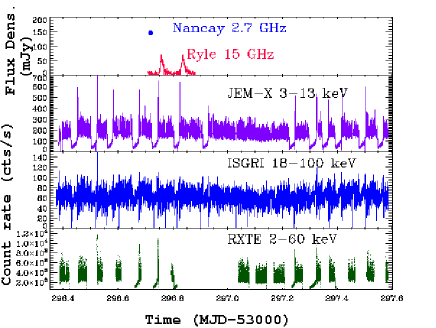
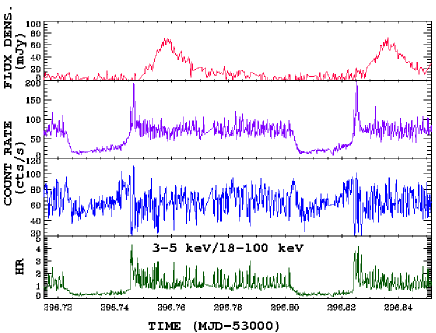
Fig. 1 shows the Nançay (2.7 GHz), Ryle (15 GHz), INTEGRAL JEM-X (3-13 keV) and ISGRI (18-100 keV), and the RXTE (2-60 keV) light curves. The delay between the return to the high level of soft X-ray (the spike) and the peak of the radio flares is 0.28 hours and 0.26 hours for the first and the second flares respectively. Zooming on the two cycles preceding the 2 radio flares one can see that in each case the return to a high level of soft X-ray is quite complex. In all cycles, while during the dip both the soft and the hard X-ray seem to evolve simultaneously (as illustrated by the rough constancy of the hardness ratio) the major spike is preceded by a precursor which is associated to a very short dip (Fig. 1 left). In order to understand better the spectral evolution during he cycle, and constrain the possible connection with the ejection, we divided each sequence of dip/spike into 4 intervals from which average spectra were extracted and analysed. Interval A corresponds to the main dip, it has a low 3-5/18-100 keV hardness ratio and a low soft X-ray flux. Interval B corresponds to the precursor spike (that is present in all cycles), interval C the dip that follows immediately after, and interval D corresponds to the major spike, that seems to precede to any interval of -type variations, between each cycle. Note that these A, B, C, D do not relate to the spectral states identified by Belloni et al. (2000).
 |
 |
We fitted the four resultant spectra with the same model consisting of an accretion disc modeled by the ezdisk model of XSPEC plus a comptonised component (comptt), modified by interstellar absorption (fixed to cm-2). While the details of the results are reported elsewhere (Rodriguez et al. in prep.), the best model allowed us to estimate the 3-50 keV relative unabsorbed fluxes of each spectral component, and thus study their evolution through the cycle. We can indicate that through the A-B-C-D sequence the accretion disc gets monotonically closer to the compact object, with an increasing flux, while the 3-50 keV flux of the “corona” is reduced by a factor 2.4 between B and C.
3 Ejection during a class for the first time: November 2004
While the observation of ejections during classes showing spectrally hard dips is not very new, and
seems to always occur after 100s hard dips (Klein-Wolt et al. 2002), no
generalisation had ever been drawn. The reason is that this had never been observed during the
long hard dips of class . During our observation on November 15-16 2004 the source is
found in the to class. On one occasion, after a hard dip, a radio
flare, which we interpret as being due to an ejection of material, is detected at 15 GHz with
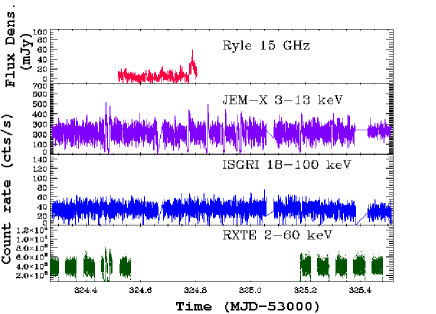
the Ryle (Fig. 2). The delay between the recovery of the soft X-rays seen by
JEM-X and the radio flare is 0.31 hour.
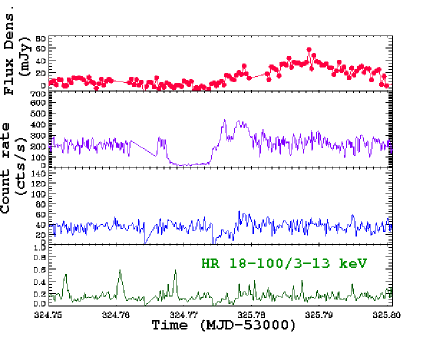
As for the previous observation if we zoom on the
interesting part at X-ray energies, the cycle is in fact composed
of a hard dip, a precursor spike, a secondary dip after the spike, and the return to
a high level of soft X-ray flux and variability (Fig. 2). Here we divided
this unique sequence into 4 intervals: main dip, precursor, short dip, and major spike,
that were fitted in
XSPEC with the same physical model as the previous observation. Again we focus on the
evolution of the relative unabsorbed fluxes to draw our conclusions. As in the previous class, the
disc gets closer to the compact object throughout the cycle with an
increasing flux, while the 3-50 keV flux of the corona is reduced by at least a factor 2.7, and up to
a factor 10 if all spectral parameters are left free to vary in the fits.
 |
 |
4 Discussion
Altough the 2 observations show clear differences, visible in the shape of the
light curves, the evolution of the hardness
ratio (Fig. 1 & 2), that of the spectral parameters,
the similarity of the cycles in their sequences, indicate that the physics connecting
accretion and ejection is the same.
In class the disc seems to approach the compact object and gets brigther,
throughout the A-B-C-D sequence, it does the same in class . In both cases
the evolution seems to be marked by a real change in the physical properties of the
Comptonizing plasma (corona) which result in a change of the spectral state. More importantly,
when studying the evolution of the relative fluxes of
the 2 components in the various intervals, while in all cases the 3-50 keV disc flux increases
from the dip to the main spike, the Compton flux decreases by a factor of in
class , and higher than 2.7 in class . This behaviour seems to suggest that
the dip following the precursor spike in the 2 classes, is due to the disappearance of
the so-called “corona”, and not simply to a pivoting of the spectrum.
Given the disappearance of one emitting medium on the one hand, and the appearance of ejected
material on the other hand, it is tempting to consider that the ejection
occurs at the precursor spike, and is therefore the result of the ejection of the corona. In class
it has been shown that the X-ray spike half way through the dip is the trigger of the
ejection (Mirabel et al. 1998). In addition, Chaty (1998) has further proposed that during class
, the spike corresponds to the disappearance of the corona, suggesting that the coronal
material is ejected in this particular class too. Rodriguez et al. (2002) reached the same conclusions
comparing the behaviour of the source at low and hard X-ray energies during a class
observation. The case of GRS 1915+105, although spectacular, is not unique.
Rodriguez et al. (2003) have come to the conclusion that in the microquasar
XTE J1550564 during its 2000 outburst the corona is ejected at the peak of the outburst and
further detected in radio. The main difference with
GRS + are the constants of time over which the ejections occur. While in XTE J1550564,
one ejection only is seen after the peak of the outburst at soft X-ray energies,
in GRS 1915+105 those kind of events can occur several times within few hours
(Fig. 1). The general behaviour, however, seems to be the same. The ejection
is coincident with a disappearance of one of the emitting medium, leading to the
conclusion that it is this media, the corona, that is blown away and detected later at
radio wavelengths.
In addition to confirming this proposition by including a precise analysis of the hard
X-rays, our observations allow us to generalise the connection of the accretion-ejection
phenomena in GRS 1915+105 by observing
an ejection during a class observation for the first time. We also provide evidence
that in at least two cases showing dip-spike sequences, the return to a high level of soft X-ray,
or the major spike, has a complex structure, and can be subdivided into a precursor spike
followed by a rapid dip and a major flare. Our analysis suggests that the ejection is triggered
at the precursor spike, similarly to class in which the ejection is triggered at the
soft spike half way
through the soft X-ray dip (Mirabel et al. 1998). Preliminary analysis of an INTEGRAL observation
during which ejections are observed show that the time delay between the
soft X-ray spike and the peak of the radio flare at 15 GHz is of the same order of magnitude
in class (about 0.3 hours Rodriguez et al. in prep.), vs. 0.27 and 0.31 hours
in classes
and respectively. The relative constancy of this delay further strenghtens the
association of the spike and the radio flare in all classes.
Although the mechanisms giving rise to the ejections is far from being understood,
our analysis answers the important question regarding the moment of the ejection which,
in turns, brings interesting
constraints on the existing models. The sequences of X-ray dip/spike could be due
to a “magnetic flood” (Tagger et al. 2004) during which a magnetic instability develops
during the spectrally hard dips, advects magnetic flux in the inner regions of the disc.
The X-ray spike
and associated ejection would be due to a reconnection event allowing the system to get rid
of the accumulated magnetic flux, blowing away the corona, and leading to the evolution to
a soft X-ray state. Many points remain unsolved, though. In particular, our analysis poses the
question on the relation between the approach of the disc and the ejection of the
corona. Is one consequence of the other?
Our multiwavelength monitoring will continue in the future with the main goal to obtain
more sequences of dip-spike radio flare sequences which will therefore allow us to have better
statistics on the occurence of radio flares and their connection to the X-rays, and hard X-rays
behaviour, and hopefully better constrain the models.
Acknowledgements
JR warmly thanks Jerome Chenevez and Carol Anne Oxborrow for their useful help with the JEM-X data reduction. JR also acknowledges useful discussions with Marion Cadolle Bel, Stéphane Corbel and Michel Tagger.
References
- [1] Belloni, T., Mendez, M., King, A. R., et al. 1997, ApJ, 488, 109
- [2] Belloni, T., Klein-Wolt, M., Mendez, et al. 2000, A&A, 355, 271
- [3] Chaty, S. 1998, These de Doctorat.
- [4] Fuchs, Y., Rodriguez, J., Mirabel, F., et al. 2003, A&A, 409, L35.
- [5] Harlaftis E.T, & Greiner J., 2004, A&A, 414, 13.
- [6] Klein-Wolt, M., Fender, R. P., Pooley, et al. 1998, MNRAS, 331, 745
- [7] Mirabel, I.F., & Rodríguez, L.F. 1994, Nature, 371, 46
- [8] Mirabel, I.F., Dhawan, V., Chaty, S., et al. 1998, A&A, 330, L9
- [9] Rodriguez, J., Durouchoux, P., Tagger, M., et al., 2002, A&A, 386, 271.
- [10] Rodriguez, J., Corbel, S., & Tomsick, J.A. 2003, ApJ, 595, 1032.
- [11] Tagger, M., Varnière, P., Rodriguez, J., & Pellat, R. 2004, ApJ, 607, 410