Superclusters of galaxies in the 2dF redshift survey.
III. The properties of galaxies in superclusters
Abstract
Aims. We use catalogues of superclusters of galaxies from the 2dF Galaxy Redshift Survey to study the properties of galaxies in superclusters.
Methods. We compare the properties of galaxies in high and low density regions of rich superclusters, in poor superclusters and in the field, as well as in groups, and of isolated galaxies in superclusters of various richness.
Results. We show that in rich superclusters the values of the luminosity density smoothed on a scale of 8 Mpc are higher than in poor superclusters: the median density in rich superclusters is , in poor superclusters . Rich superclusters contain high density cores with densities while in poor superclusters such high density cores are absent. The properties of galaxies in rich and poor superclusters and in the field are different: the fraction of early type, passive galaxies in rich superclusters is slightly larger than in poor superclusters, and is the smallest among the field galaxies. Most importantly, in high density cores of rich superclusters () there is an excess of early type, passive galaxies in groups and clusters, as well as among those which do not belong to groups or clusters. The main galaxies of superclusters have a rather limited range of absolute magnitudes. The main galaxies of rich superclusters have larger luminosities than those of poor superclusters and of groups in the field (the median values are correspondingly , and for rich and poor superclusters and groups in the field).
Conclusions. Our results show that both the local (group/cluster) environments and global (supercluster) environments influence galaxy morphologies and their star formation activity.
Key Words.:
cosmology: large-scale structure of the Universe – clusters of galaxies; cosmology: large-scale structure of the Universe – Galaxies; clusters: general1 Introduction
It is presently well established that galaxies belong to various systems from groups and clusters to superclusters, forming the supercluster-void network. Early studies of superclusters of galaxies were reviewed by Oort (oort83 (1983)). These studies were based on observational data about galaxies, as well as on data about nearby groups and clusters of galaxies. Classical cluster catalogues were constructed by Abell (abell (1958)) and Abell et al. (aco (1989)) by visual inspection of Palomar plates. The first relatively deep all-sky catalogues of superclusters of galaxies were complied by Zucca et al. (z93 (1993)) and Einasto et al. (e1994 (1994), 1997b , e2001 (2001)) using data about Abell clusters.
The modern era of the study of various systems of galaxies began when new deep redshift surveys of galaxies were published. These surveys cover large regions of sky and allow to investigate the distribution of galaxies up to fairly large distance from us. These surveys formed the basis for new catalogues of groups, clusters and superclusters of galaxies. The first of such catalogues was the Las Campanas catalogue of groups by Tucker et al. (Tucker00 (2000)). The Las Campanas Galaxy Redshift Survey and the Sloan Digital Sky Survey were also used to compile catalogues of groups, clusters and superclusters by Einasto et al. (2003a , 2003b , hereafter E03a and E03b) and Basilakos (bas03 (2003)). Group and supercluster catalogues based on the 2 degree Field Galaxy Redshift Survey (2dFGRS) were published by Eke et al. (eke04 (2004)), Yang et al. (yang04 (2004)) and Tago et al. (tago06 (2006), hereafter T06), and by Erdogdu et al. (erd04 (2004)) and Porter and Raychaudhury (pr05 (2005)).
The pioneering studies of the properties of galaxies in clusters by Davis & Geller (dg76 (1976)) and Dressler (d80 (1980)) showed that there exists a correlation between the spatial density of galaxies and their morphology – early type galaxies are located preferentially in the central regions of clusters, where the local densities are high, while late type galaxies are located mostly in outer regions of clusters, having lower local densities around them. Einasto (e91 (1991)) showed that clustering of galaxies depends on both their luminosity and morphology. Already early studies of the morphological segregation of galaxies at supercluster scales demonstrated that this segregation extends to scales of 10–15 Mpc (Giovanelli, Haynes and Chincarini gio86 (1986), Einasto and Einasto e87 (1987) and Mo et al. mo92 (1992)).
The data about galaxies in the Las Campanas Galaxy Redshift Survey, the Sloan Digital Sky Survey and the 2 degree Field Galaxy Redshift Survey (2dFGRS) enable us to study the properties and the spatial distribution of galaxies in detail. Numerous papers have demonstrated segregation of galaxies by their spectral type, luminosity and colour index (Norberg et al. n01 (2001), n02 (2002), Zehavi et al. zehavi02 (2002), Goto et al. go03 (2003), Hogg et al. hogg03 (2003), hogg04 (2004), Balogh et al. balogh04 (2004), De Propris et al. depr03 (2003), Madgwick et al. 2003b , Croton et al. cr05 (2005) and Blanton et al. blant04 (2004), blant06 (2006) among others). Blanton et al. (blant06 (2006)) come to the conclusion that the blue galaxy fraction and the recent star formation history in general, depend mostly on the local environment of galaxies. In this study the local environment was defined as the spatial density on the 0.5–1 Mpc scale, and the global density on the 5–10 Mpc scale. Croton et al. (cr05 (2005)) showed that galaxy populations depend also on the large scale environment. Balogh et al. (balogh04 (2004)) compared the populations of star-forming and quiescent galaxies in groups from the 2dFGRS and SDSS surveys and in small (1.1 Mpc) and large scales (5.5 Mpc) and showed that the relative numbers of these galaxies depend both on the local and global environments. Even low density environments contain a large fraction of non-star-forming galaxies.
On the basis of the 2dFGRS we recently compiled a new catalogues of superclusters of the 2dF galaxies (Einasto et al. 2006a , hereafter Paper I). This catalogue is available electronically at the web-site http://www.aai.ee/maret/2dfscl.html. In (Einasto et al. 2006b , hereafter Paper II) we studied various properties of these superclusters: their multiplicity, geometry, luminosity functions and other properties. We also compared the properties of real superclusters with simulated superclusters from the Millennium Simulations (Springel et al. springel05 (2005)), and from the semianalytical mock catalog by Croton et al. (cr06 (2006)).
In the present paper we continue our study of the properties of superclusters. We study the properties of galaxies: their luminosities, spectral types and colors in rich and poor superclusters and for comparison also in the field. These data enable to analyse populations of galaxies of different luminosity, morphology and star formation rate in various environments: in rich and poor superclusters, as well as in groups located in superclusters and in the field. The use of a large catalogue of superclusters enables us for the first time to study the properties of galaxies in a large number of superclusters of various richness.
The paper is composed as follows. In the next Section we shall describe the supercluster data. Then we study the properties of galaxies in superclusters, the density distribution in superclusters of various richness, and the properties of galaxies in groups located in regions of different large scale density in superclusters. Then we compare the luminosities of main galaxies in superclusters and in groups located in the field. In the last Sections we discuss the results and list our conclusions.
2 Data
We have used the 2dFGRS final release (Colless et al. col01 (2001), col03 (2003)) that contains 245,591 galaxies. This survey has allowed the 2dFGRS Team and many others to estimate fundamental cosmological parameters and to study intrinsic properties of galaxies in various cosmological environments; see Lahav (lahav04 (2004) and lahav05 (2005) ) for recent reviews.

We used the data about galaxies and groups of galaxies to compile a catalogue of superclusters of galaxies from the 2dF survey (Paper I). The 2dF sample becomes very diluted at large distances, thus we restrict our sample by a redshift limit ; we apply a lower limit to avoid confusion with unclassified objects and stars. We determined superclusters using a luminosity (or mass) density field smoothed with an Epanechnikov kernel of radius 8 Mpc ( is the present-day dimensionless Hubble constant in units of 100 km s-1 Mpc-1). When calculating luminosity densities we used weights for galaxies which correct the densities to account for galaxies, too faint to fall into the observational window of absolute magnitudes at the distance of the galaxy. We defined superclusters as connected non-percolating systems with densities above a certain threshold density. We used a threshold density 4.6 in units of the mean luminosity density.
Due to the selection of galaxies within a fixed apparent magnitude limits the observational window in absolute magnitudes shifts toward higher luminosities when the distance of galaxies increases. We analysed the selection effects in our supercluster catalogue in detail in Papers I and II. This analysis showed, in particular, that selections due to the use of a flux-limited sample of galaxies have been taken into account properly when estimating total luminosities of superclusters. For details we refer to Papers I and II.
We use in the present analysis only systems with at least 10 member galaxies from main supercluster catalogue of Paper I, which includes all systems up to a comoving distance Mpc. In total we use the data about 124 superclusters in the Northern sky and about 168 superclusters in the Southern sky, leaving out the poorest systems in the supercluster catalogue.
Another selection effect in flux-limited samples is the decrease of the number of galaxies in superclusters with increasing distance (Fig. 2). This selection effect affects poor superclusters at distances larger than Mpc more strongly than superclusters at smaller distances. Therefore we divide our superclusters into nearby and distant subsamples and select volume-limited samples as follows: nearby samples – (in the filter used in the 2dFGRS) and Mpc(denoted with ), and distant samples having and Mpc(denoted with ).
We additionally divide superclusters by their richness: rich superclusters with at least 200 member galaxies (we denote this sample as R), and poor superclusters with less than 200 member galaxies (P). We also use the data about field galaxies, i.e. galaxies which do not belong to superclusters (approximately 2/3 of all galaxies), as a comparison sample (FG). Our analysis showed that for the purposes of the present paper this division of superclusters into rich and poor systems is better than the division according to the number of DF-clusters used in Papers I and II (Section 3.2).
To study various properties of galaxies in superclusters we use the data about luminosities, spectral types and colors of galaxies as given in the 2dF redshift survey. We divide galaxies into populations of bright/faint galaxies, early/late type galaxies, non-star-forming and star-forming galaxies and passive/actively star formating galaxies by their luminosity, spectral parameter and by the colour index (Madgwick et al. ma02 (2002) and 2003a , Wild et al. wild04 (2004)).
In order to divide galaxies into populations of bright and faint galaxies we wanted to use an absolute magnitude limit close to the break luminosity in the Schechter luminosity function. According to the calculations of the luminosity function the value of varies for different galaxy populations ((Madgwick et al. 2003a , de Propris et al. depr03 (2003), Croton et al. cr05 (2005)), having values from to . Therefore we used a bright/faint galaxy limit as a compromise between different values.
The spectral parameter of galaxies, , correlates with the morphological type of galaxies (e.q. Madgwick et al. ma02 (2002), de Propris et al. depr03 (2003)); E/S0 galaxies (morphological T-type , Kennicutt ken92 (1992)) have . Thus we divided galaxies into populations of early and late type galaxies using this limit of the spectral parameter . Moreover, the spectral parameter is correlated with the equivalent width of the emission line, thus being an indicator of the star formation rate in galaxies (Madgwick et al. ma02 (2002) and 2003a ). We used the value to define the population of quiescent galaxies and for star-forming galaxies.
We also used information about colours of galaxies (the rest-frame colour index, , Wild et al. wild04 (2004)) to divide galaxies into populations of passive galaxies and actively star forming galaxies. For passive (red) galaxies . We used this limit to separate the populations of passive and actively star forming galaxies.
In addition to these spectral parameters of galaxies we use the data about groups of galaxies (T06) to find the fraction of galaxies in groups of various richness and to study the properties of galaxies in groups in rich and poor superclusters.
3 Properties of galaxies in superclusters
| ID | RN | RD | PN | PD | FGN | FGD |
|---|---|---|---|---|---|---|
| 1 | 2 | 3 | 4 | 5 | 6 | 7 |
| All | 7461 | 5747 | 1652 | 7031 | 36949 | 32162 |
| 0.17 | 1.86 | 0.18 | 2.21 | 0.14 | 1.55 | |
| All | 1.23 | 1.78 | 1.21 | 1.77 | 0.66 | 1.02 |
| 2.66 | 2.16 | 2.36 | 2.15 | 1.60 | 1.21 | |
| 1.09 | 1.27 | 1.08 | 1.18 | 0.58 | 0.78 | |
| SF | ||||||
| All | 2.42 | 3.63 | 2.29 | 3.61 | 1.41 | 2.24 |
| 7.31 | 4.43 | 6.78 | 4.47 | 4.34 | 2.64 | |
| 2.11 | 2.63 | 1.98 | 2.41 | 1.24 | 1.76 | |
| All | 1.99 | 3.27 | 1.98 | 3.72 | 1.03 | 2.24 |
| 3.11 | 3.69 | 2.52 | 4.42 | 1.59 | 2.48 | |
| 1.84 | 2.65 | 1.89 | 2.67 | 0.97 | 1.93 | |
| 0.34 | 0.09 | 0.30 | 0.05 | 0.05 | 0.003 | |
| 0.41 | 0.47 | 0.47 | 0.48 | 0.43 | 0.29 | |
| 0.25 | 0.45 | 0.23 | 0.47 | 0.52 | 0.71 |
The Columns in the Table are as follows:
1: Sample identification (all – all galaxies, – bright galaxies, – faint galaxies. – the ratio of the numbers of bright () and faint () galaxies, – the ratio of the number of early and late type galaxies, – the ratio of the numbers of quiescent and actively star forming galaxies (according to the spectral parameter ), – the ratio of the number of passive and actively star forming galaxies (according to the colour index ). – the fraction of galaxies in groups; – rich groups with at least ten member galaxies, – poor groups with less than ten galaxies, and – isolated galaxies, i.e. those galaxies which do not belong to groups.
2–7: Supercluster populations: RN and RD – nearby and distant rich superclusters, PN and PD – nearby and distant poor superclusters, FGN and FGD – nearby and distant field galaxies.
| ID1 | ID2 | ||
|---|---|---|---|
| 1 | 2 | 3 | 4 |
| RN | PN | 0.040 | 0.02635 |
| RN | FGN | 0.036 | 1.076e-07 |
| PN | FGN | 0.069 | 4.117e-07 |
| RD | PD | 0.041 | 3.594e-05 |
| RD | FGD | 0.074 | 2.2e-16 |
| PD | FGD | 0.100 | 2.2e-16 |
| RN | PN | 0.061 | 8.495e-05 |
| RN | FGN | 0.162 | 2.2e-16 |
| PN | FGN | 0.173 | 2.2e-16 |
| RD | PD | 0.049 | 2.839e-07 |
| RD | FGD | 0.118 | 2.2e-16 |
| PD | FGD | 0.135 | 2.2e-16 |
| RN | PN | 0.027 | 0.2564 |
| RN | FGN | 0.158 | 2.2e-16 |
| PN | FGN | 0.156 | 2.2e-16 |
| RD | PD | 0.041 | 6.066e-05 |
| RD | FGD | 0.136 | 2.2e-16 |
| PD | FGD | 0.135 | 2.2e-16 |
The Columns in the Table are as follows:
1–2: Sample ID (see Table LABEL:tab:1).
3–4: the Kolmogorov-Smirnov test results: the maximum difference and the probability that the distributions of population parameters are taken from the same parent distribution.
3.1 Luminosities, types and colours of galaxies in superclusters of different richness


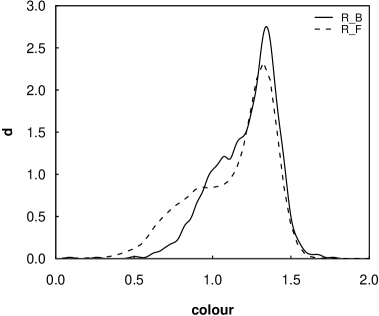
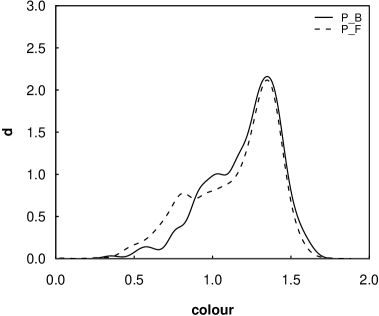

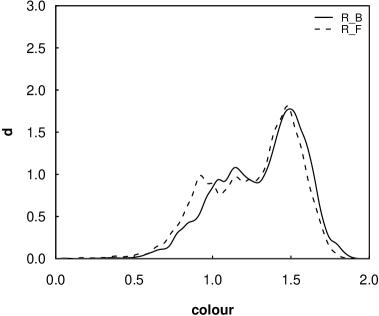
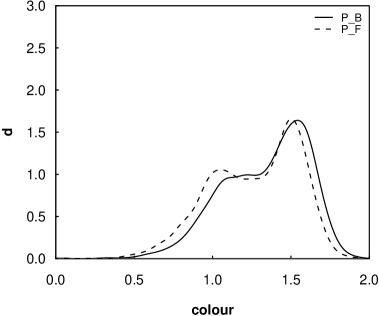

Table LABEL:tab:1 shows the galaxy content of rich and poor superclusters and field galaxies. Here we divide galaxies also by their luminosity: bright galaxies with and faint galaxies having . In Table LABEL:tab:2 we give the statistical significance that the distributions of luminosities, spectral parameter and colour index are drawn from the same parent sample according to the Kolmogorov-Smirnov test.
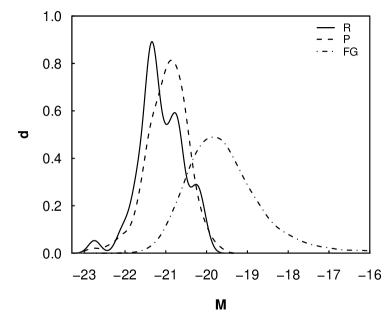
We plot in Figure 3 the differential luminosity functions for galaxies in rich and poor superclusters and in the field (right panel), as well as the distribution of luminosities of galaxies in rich and poor superclusters and in the field (left panel). As we see, the Poisson errors in the probability density histograms are very small, due to a large number of galaxies in our sample. Thus we do not show these errors, in general, to avoid overcrowding of the figures. Figure 4 shows the distributions of the colour indices of galaxies. We calculated these distributions using the probability density function in R (a language for data analysis and graphics (Ihaka & Gentleman ig96 (1996)).
Fig. 3 shows that there is an excess of faint galaxies among field galaxies in comparison with galaxies in superclusters. The ratio of the numbers of bright and faint galaxies in the field is smaller than this ratio for galaxies in superclusters (Table LABEL:tab:1). The KS test shows (Table LABEL:tab:2) that the differences between the luminosity distributions of galaxies in rich and poor superclusters are statistically significant at least at 97% confidence level, and the differences between luminosity distributions of galaxies in superclusters and in the field – even at a much higher level (Table LABEL:tab:1).
The ratio of the numbers of early and late type galaxies, (characterized by their spectral parameter ) in rich and poor superclusters and in the field (Table LABEL:tab:1) shows differences between these populations: this ratio is slightly larger for galaxies in rich superclusters than for galaxies in poor superclusters. Note that this ratio is also larger for bright galaxies in rich superclusters than for bright galaxies in poor superclusters – in rich superclusters the fraction of early type galaxies among bright galaxies is larger than in poor superclusters. In the field the fraction of early type galaxies is smaller than in superclusters.
The ratio of the numbers of quiescent and actively star forming galaxies, SF (as defined by their spectral parameter ) in rich and poor superclusters and in the field (Table LABEL:tab:1) shows even larger differences between bright and faint galaxies both in superclusters and in the field; for bright galaxies this fraction is about three times higher than for faint galaxies. In distant superclusters, where we use a higher magnitude limit to define a volume-limited sample, the difference between this fraction for bright and faint galaxies is smaller.
We note another difference between the galaxy populations of rich superclusters and in the field – in rich superclusters there is an excess of early type (and passive) galaxies among faint galaxies while in the field late type (and star forming) galaxies dominate among faint galaxies.
The ratio of passive and active galaxies according to their colour index is given in Table LABEL:tab:1 for galaxies in rich and poor superclusters and in the field. In Figure 4 we show the distributions of the colour index for bright and faint galaxies in these systems. This Figure shows a continous change of the distributions of colours of galaxies from rich to poor superclusters and to field galaxies; differences are larger in the case of nearby samples. The number of red galaxies in rich superclusters is larger than in poor superclusters among both bright and faint galaxies. In the case of the distant sample the colour of galaxies is redder. We shall analyse this effect in more detail in another paper (Einasto et al., in preparation). Thus in rich superclusters there is an excess of quiescent galaxies even among faint galaxies, while in the field the fraction of actively star forming galaxies is relatively large. The fraction of actively star forming galaxies in the field is larger than the fraction of these galaxies in superclusters.
The KS test shows that the differences between the distributions of colour indices of galaxies in both nearby and distant rich and poor superclusters, as well as the differences between colour indices of galaxies in superclusters and in the field are statistically significant at least at 99% confidence level.
The differences between the distributions of the spectral parameters and colour indices of bright and faint galaxies are expected due to the morphology-luminosity-density relation. However, our results show that galaxy populations in rich and poor superclusters are somewhat different; in rich supercluster there are relatively more early type, passive, red galaxies than in poor superclusters.
3.2 Properties of galaxies in individual superclusters
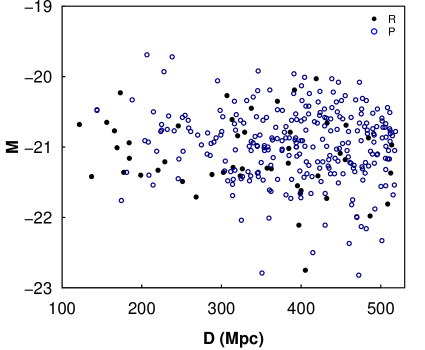
Next we compare the properties of galaxies in individual superclusters. In Figure 5 we plot the ratio of the numbers of bright and faint galaxies , the ratio of the numbers of early and late type galaxies , and the ratio of the numbers of passive and actively star forming galaxies in superclusters with respect to the distance of superclusters and to the number of galaxies.
This Figure shows that the scatter of the ratio with distance and with the number of galaxies in superclusters (here this number is the number of galaxies in superclusters in volume-limited samples, not in full samples) is very small in the case of nearby samples. In distant samples the scatter of this ratio is larger, and increases with distance. This scatter is small for richer superclusters. Due to a higher luminosity cut-off in distant superclusters individual differences between poor distant superclusters affect this ratio more stongly than in nearby superclusters.


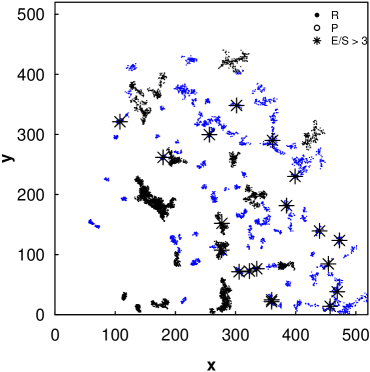
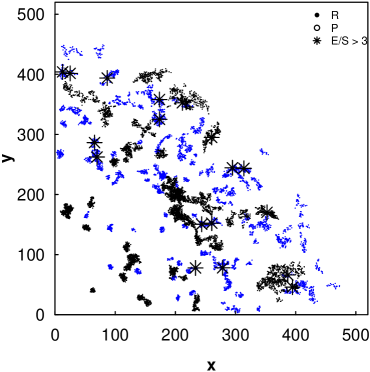
Comparison of the trends of the ratios of the numbers of early and late type galaxies with respect to the distance of superclusters and to the number of galaxies in superclusters shows that this ratio increases with distance (in Fig. 1 we show the location of superclusters with the ratio ). Also, this ratio is larger in poor superclusters; in some poor superclusters the ratio is over ten times larger than in superclusters in average.
We see similar trends, when we look at the ratio of passive and actively star forming galaxies. In the case of distant superclusters the ratio has an even larger scatter than the ratio . In some poor superclusters the number of passive galaxies is 15–20 times larger than the number of actively star forming galaxies.
This analysis shows that the properties of rich superclusters with at least 200 member galaxies are rather homogeneous. This is one reason why we choose this richness limit to separate rich and poor superclusters. Additionally, the properties of nearby superclusters show only a small scatter; a larger scatter of the properties of distant superclusters is in accordance with our results in Paper II where we also saw a large scatter of the properties of poor distant superclusters. These are probably due to individual variations of the properties of poor superclusters. Also, some poor distant superclusters may be affected by selection effects (see Fig. 2).
3.3 Density distribution in rich and poor superclusters
| ID | 1Q | Med | 3Q | KS | KS | |
|---|---|---|---|---|---|---|
| 1 | 2 | 3 | 4 | 5 | 6 | 7 |
| RN | 7461 | 5.85 | 7.35 | 9.72 | ||
| PN | 1652 | 4.94 | 5.38 | 6.10 | ||
| FGN | 36949 | 0.99 | 1.96 | 2.80 | ||
| RD | 5747 | 5.86 | 7.49 | 9.68 | ||
| PD | 7031 | 5.40 | 6.33 | 7.71 | ||
| FGD | 32162 | 1.41 | 2.34 | 3.39 | ||
| RNB | 1062 | 5.84 | 7.32 | 9.43 | ||
| RNF | 6399 | 5.85 | 7.34 | 9.73 | 0.023 | 0.7 |
| PNB | 250 | 4.90 | 5.37 | 6.08 | ||
| PNF | 1402 | 4.94 | 5.38 | 6.10 | 0.035 | 0.95 |
| FGNB | 4423 | 1.27 | 2.05 | 3.09 | ||
| FGNF | 32526 | 0.95 | 1.73 | 2.75 | 0.015 | 0.000162 |
| RDB | 3741 | 5.91 | 7.57 | 9.85 | ||
| RDF | 2006 | 5.79 | 7.31 | 9.43 | 0.042 | 0.018 |
| PDB | 4841 | 5.43 | 6.42 | 7.81 | ||
| 2190 | 5.34 | 6.14 | 7.44 | 0.068 | 1.95e-6 | |
| FGDB | 19563 | 1.52 | 2.43 | 3.46 | ||
| FGDF | 12599 | 1.23 | 2.18 | 3.26 | 0.11 | 2.2e-16 |
| RNE | 4044 | 6.00 | 7.57 | 10.22 | ||
| RNS | 2143 | 5.73 | 7.19 | 9.30 | 0.080 | 1.6e-10 |
| PNE | 888 | 4.97 | 5.44 | 6.15 | ||
| PNS | 493 | 4.88 | 5.32 | 5.98 | 0.099 | 0.7e-4 |
| FGNE | 14262 | 1.18 | 1.99 | 3.04 | ||
| FGNS | 14882 | 0.91 | 1.64 | 2.64 | 0.078 | 2.2e-16 |
| RDE | 3593 | 5.98 | 7.68 | 9.92 | ||
| RDS | 1213 | 5.60 | 6.94 | 9.01 | 0.07 | 3.32e-6 |
| PDE | 4361 | 5.45 | 6.42 | 7.81 | ||
| PDS | 1481 | 5.32 | 6.17 | 7.49 | 0.063 | 7.8e-6 |
| FGDE | 15431 | 1.63 | 2.56 | 3.55 | ||
| FGDS | 9411 | 1.27 | 2.17 | 3.26 | 0.11 | 2.2e-16 |
| RNq | 5192 | 5.94 | 7.47 | 9.98 | ||
| RNSF | 2143 | 5.73 | 7.08 | 9.18 | 0.067 | 2.8e-6 |
| PNq | 1129 | 4.95 | 5.41 | 6.14 | ||
| PNSF | 493 | 4.87 | 5.30 | 5.96 | 0.087 | 0.011 |
| FGNq | 21003 | 1.09 | 1.91 | 2.94 | ||
| FGNSF | 14882 | 0.87 | 1.59 | 2.60 | 0.10 | 2.2e-16 |
| RDq | 4401 | 5.91 | 7.58 | 9.82 | ||
| RDSF | 1213 | 5.68 | 7.15 | 9.26 | 0.064 | 0.7e-4 |
| PDq | 5346 | 5.42 | 6.37 | 7.75 | ||
| PDSF | 1481 | 4.87 | 5.30 | 5.96 | 0.048 | 0.01 |
| FGDq | 21101 | 1.54 | 2.46 | 3.49 | ||
| FGDSF | 9411 | 1.25 | 2.12 | 3.21 | 0.10 | 2.2e-16 |
| RNP | 4948 | 5.94 | 7.49 | 10.01 | ||
| RNA | 2513 | 5.71 | 7.08 | 9.12 | 0.077 | 5.1e-9 |
| PNP | 1097 | 4.96 | 5.43 | 6.14 | ||
| PNA | 555 | 4.87 | 5.31 | 5.98 | 0.086 | 0.009 |
| FGNP | 18764 | 1.12 | 1.94 | 3.00 | ||
| FGNA | 18185 | 0.87 | 1.58 | 2.57 | 0.11 | 2.2e-16 |
| RDP | 4400 | 5.96 | 7.62 | 9.85 | ||
| RDA | 1347 | 5.65 | 7.15 | 9.24 | 0.075 | 2.0e-5 |
| PDP | 5542 | 5.41 | 6.35 | 7.75 | ||
| PDA | 1489 | 5.34 | 6.23 | 7.53 | 0.037 | 0.087 |
| FGDP | 22257 | 1.50 | 2.44 | 3.48 | ||
| FGDA | 9905 | 1.21 | 2.08 | 3.16 | 0.10 | 2.2e-16 |
The Columns in the Table are as follows:
1: Population ID. – rich superclusters, – poor superclusters, – field galaxies; – bright galaxies (), – faint galaxies (), and – early and late type galaxies, and – passive and actively star forming galaxies (according to the spectral parameter ), and SF – quiescent and actively star forming galaxies (according to the colour index ). Index indicates the nearby population, and Mpc, index – the distant population, and Mpc.
2: the number of galaxies in each population.
3–5: the lower quartile, median and upper quartile values of supercluster parameters.
6 and 7: the Kolmogorov-Smirnov test results: the maximum difference and the probability that the distributions of population parameters are taken from the same parent distribution.
Next we study how the properties of galaxies – their luminosities, types and activity – depend on the large scale environment, defined as the value of the density field at the location of galaxies (environmental density). We compare the distribution of densities at the location of galaxies of each subsamples and for all populations.
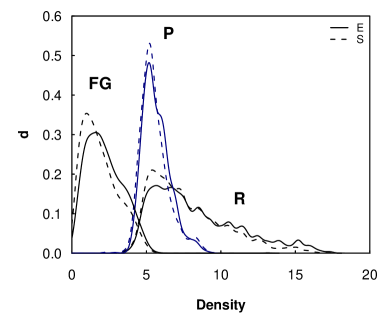
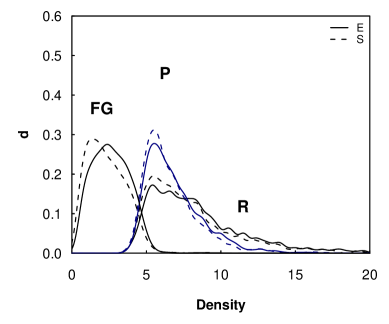
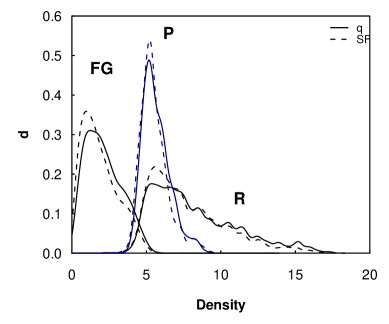
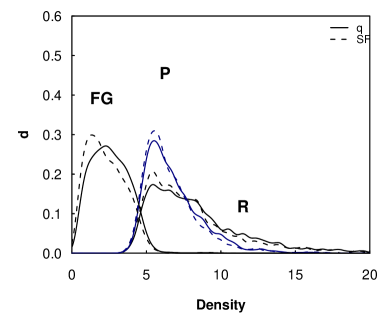
The results of this analysis are presented in Table LABEL:tab:3 and in Figures 6-8. In Table LABEL:tab:3 we give the lower quantile, median and upper quantile values of densities, as well as the results of the KS tests – the maximal differences between the density distributions , and probabilities , which show whether sample pairs may belong to the same parent sample.
Let us at first analyse the general distribution of densities in superclusters of various richness (see, e.g., Fig. 6). One remarkable feature seen in this Figure is the different distribution of densities in rich and poor superclusters. Densities which correspond to rich superclusters have a median value of , and the maximum densities are about 17–20 (see also Paper II, where we showed that both mean and maximal densities in rich superclusters are larger than in poor superclusters). These large densities show that rich superclusters contain high density cores. Densities in poor superclusters show a completely different distribution: they have a median value of , and the maximum values densities are less than for nearby poor superclusters and less than in distant poor superclusters. Thus high density regions are absent in nearby poor superclusters; far away, even in some poor superclusters high density cores are seen. It may be possible that these poor superclusters are classified as poor due to selection effects.
We remind that superclusters were defined as connected non-percolating systems with densities above a threshold density 4.6 in units of the mean luminosity density. We used an identical threshold density limit for superclusters of all richnesses. Then we divided superclusters by richness according to the number of galaxies in them, without using any additional condition about the values of the density field in supercluster regions. Thus these differences in density distributions reflect intrinsic properties of superclusters of various richness, and not due to faults in the supercluster construction.
Next we analyse the distribution of densities at the location of galaxies from different populations.
Table LABEL:tab:3 shows the distribution of densities around bright and faint galaxies. In nearby poor superclusters the differences between the density distributions are not statistically significant (according to the KS test); in nearby rich superclusters the probability that the density distribution around bright and faint galaxies are taken from the same parent distribution is 0.7. In distant superclusters the differences are larger and their statistical significance is higher. In the field the differences between densities at the location of bright and faint galaxies are statistically significant at a very high level.
Next we compare the density distributions at the location of galaxies of different type. Table LABEL:tab:3 shows that in all systems at the location of early type galaxies the values of the density field are larger than at the location of late type galaxies.
A closer look at Fig. 6 shows several interesting details. In both rich and poor superclusters at densities less than there is an excess of late type galaxies. In rich superclusters at densities there is seen an excess of early type galaxies. In distant poor superclusters there are also high density regions with an excess of early type galaxies and densities . As alreay noted, it may be possible that these poor superclusters are classified as poor due to selection effects.
Next we look at the density distributions at the location of quiescent and star forming galaxies, characterized by their spectral parameter (Table LABEL:tab:3). We see that the overall distributions of densities is rather similar to those for early and late type galaxies. Passive galaxies are located at higher environmental densities than actively star forming galaxies.
Figure 7 shows the density limits for regions where galaxies of different star formation rates dominate. In the case of nearby superclusters at densities less than there is an excess of star forming galaxies in both rich and poor superclusters. In regions with densities passive galaxies dominate. These are the same density limits as those for early and late type galaxies. This is true also for distant superclusters.
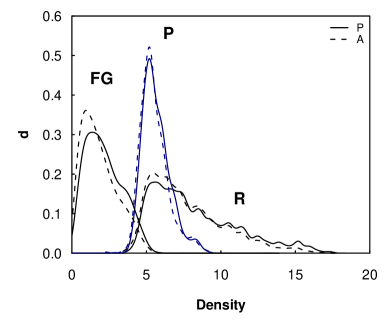
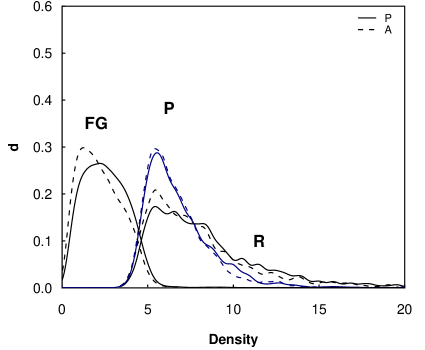
Now let us study the distribution of the environmental densities for galaxies divided into populations of passive (red) and active (blue) galaxies using colour information (Table LABEL:tab:3). As found before, passive galaxies have larger environmental densities than actively star forming galaxies. We see in Fig. 8 that also in this case the density limits for lower density regions where star forming galaxies dominate, and for higher density regions where passive galaxies dominate are the same as in the previous case.
The KS test confirms that the differences between environmental density distributions for galaxies of different properties are statistically significant at very high levels (Table LABEL:tab:3). The differences between the densities extend to the lowest amplitudes of the density field (for field galaxies).
To conclude, these Figures show correlation between the properties of galaxies and environmental density. There are also certain differences between rich and poor superclusters: in rich superclusters there are higher density cores with where early type, red, passive galaxies dominate, and lower density regions where there is an excess of late type, blue, and actively star forming galaxies. In poor superclusters those high density regions are absent. This is another important difference between rich and poor superclusters.
Among field galaxies we see also that at lower densities, late type, star forming galaxies dominate while at higher densities, there is an excess of early type, passive galaxies.
3.4 Properties of galaxies in rich and poor groups and of isolated galaxies in superclusters
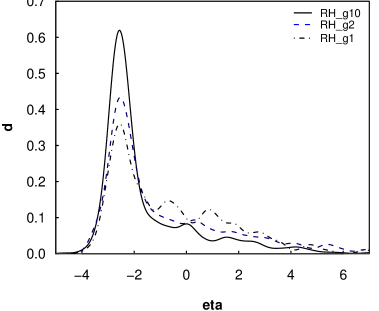
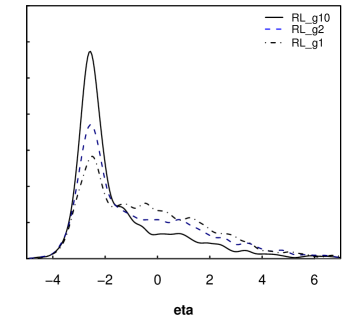
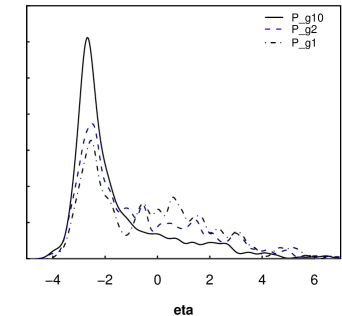
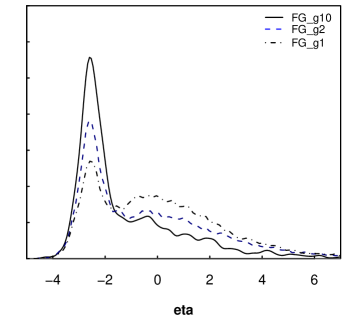
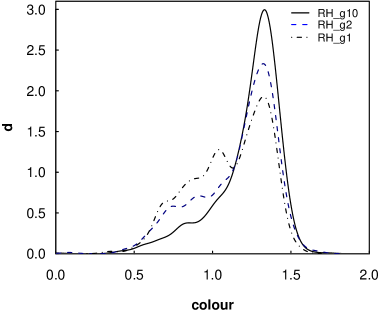
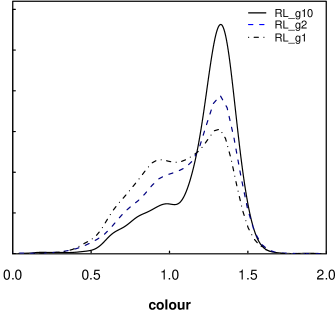
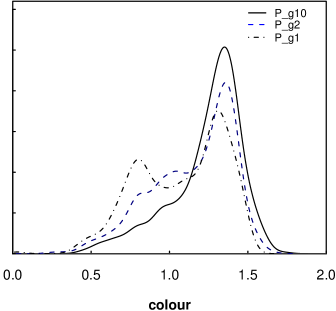
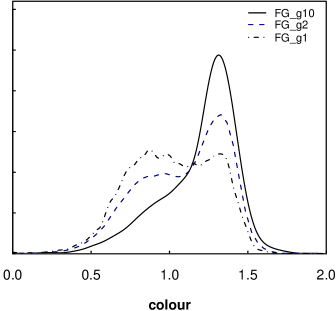
About 75% of galaxies in superclusters and about 50% of galaxies in the field belong to groups of galaxies of various richness. Next we compare the properties of galaxies in rich and poor groups and of isolated galaxies in various environments (in high and low density regions of rich superclusters, in poor superclusters and in the field). In this analysis we divide groups by their richness as follows: rich () groups and clusters (we denote this sample as ) and poor groups (, ). Those galaxies in superclusters and in the field which do not belong to groups form a sample of isolated galaxies (). In other words, we analyse how both the small (group) scale and large (supercluster) scale environments influence the properties of galaxies. In this analysis we use the data about nearby superclusters only, as these data are more reliable. The results of this analysis are presented in Table LABEL:tab:4 and in Figure 9. In Table LABEL:tab:5 we give the results of the Kolmogorov-Smirnov test showing the probability that the distributions of the spectral parameters and the colour index are drawn from the same parent sample.
Fig. 9 and Table LABEL:tab:4 show additional interesting features. Let us analyse, for example, the presence of passive and actively star forming galaxies according to the colour information in groups of various richness in superclusters and in the field. The fraction of passive (red) galaxies is largest in rich groups in the high density cores of rich superclusters. Even in poor groups in these high density regions the fraction of passive galaxies is larger than this fraction in poor groups in poor superclusters and in the field. And finally, the fraction of passive galaxies among galaxies which do not belong to groups, but are located in superclusters, is 1.5 times higher than among isolated galaxies in the field. This shows that star formation in galaxies in high density cores of superclusters is supressed even for isolated galaxies, not only in rich groups and clusters in these regions.
The fraction of star forming galaxies in low density regions of rich superclusters and in poor superclusters is similar. In the field, star forming galaxies are as abundant as isolated supercluster galaxies, while passive galaxies dominate in groups.
Fig. 9 shows also a shift to blue colours when we compare the distribution of the colour index for isolated galaxies in superclusters and in the field. Therefore the differences between colour distributions berween these populations are even larger than the ratio shows.
We see similar trends when we study the fractions of quiescent and actively star forming galaxies, according to spectral information, in groups of various richness in superclusters and in the field. In high density regions of rich superclusters the fraction of passive galaxies is the largest. Even among isolated galaxies in these regions the ratio of the numbers of quiescent and actively star forming galaxies is comparable to that of in poor groups in less dense enviromnents, in low density regions of rich superclusters and in poor superclusters.
The ratio of the numbers of early and late type galaxies shows similar trends: in high density cores early type galaxies dominate both in rich and in poor groups; even among isolated galaxies in these regions late and early type galaxies are almost equally present while in poor superclusters and in low density regions of rich superclusters late type galaxies dominate among isolated galaxies.
These results show that both local (group/cluster) environments and global (supercluster) environments are important in forming galaxy morphologies and star formation activity.
A weak dependence of the ratio of the numbers of bright and faint galaxies on the environment, found in the present analysis, is caused by the fact that we used the data about relatively bright galaxies only. Among isolated galaxies the fraction of bright galaxies is smaller, thus the differences between the properties of galaxies in groups and isolated galaxies come at least partly from the luminosity difference. However, in superclusters of different richness the ratio for galaxies in groups and for isolated galaxies is similar, thus the differences between the properties of galaxies in rich and poor superclusters are not due to different luminosities of galaxies.
| ID | RH | RL | P | FG |
|---|---|---|---|---|
| 1 | 2 | 3 | 4 | 5 |
| 878 | 1664 | 501 | 1788 | |
| 536 | 2528 | 769 | 15981 | |
| 285 | 1570 | 382 | 19180 | |
| 2.52 | 2.00 | 2.46 | 1.67 | |
| 1.35 | 1.03 | 1.04 | 0.82 | |
| 0.93 | 0.70 | 0.69 | 0.49 | |
| SF | ||||
| 4.87 | 4.04 | 4.69 | 3.47 | |
| 2.44 | 2.01 | 2.09 | 1.61 | |
| 1.99 | 1.59 | 1.30 | 1.17 | |
| 4.23 | 3.37 | 3.91 | 2.89 | |
| 2.21 | 1.72 | 1.73 | 1.29 | |
| 1.28 | 1.12 | 1.23 | 0.78 | |
| 0.16 | 0.19 | 0.20 | 0.20 | |
| 0.18 | 0.18 | 0.19 | 0.16 | |
| 0.10 | 0.13 | 0.11 | 0.11 |
The Columns in the Table are as follows:
1: Group membership: – galaxies in rich () groups, – galaxies in poor () groups, – isolated galaxies (i.e. galaxies which do not belong to groups);
2–5: Populations: RH – high density regions () of rich superclusters, RL – low density regions () of rich superclusters, P – poor superclusters, FG – field galaxies;
– the ratio of the numbers of early and late type galaxies, SF – the ratio of the numbers of quiescent and actively star forming galaxies (according to the spectral parameter ), – the ratio of the numbers of passive and actively star forming galaxies (according to the colour index ), – the ratio of the numbers of the bright () and faint () galaxies.
| ID1 | ID2 | ||
|---|---|---|---|
| 1 | 2 | 3 | 4 |
| RHGr10 | RHGr2 | 0.1444 | 1.870e-06 |
| RHGr2 | RHI | 0.1275 | 0.004715 |
| RHGr10 | RLGr10 | 0.0539 | 0.07127 |
| RHGr2 | RLGr2 | 0.0801 | 0.00684 |
| RHI | RLI | 0.0832 | 0.07094 |
| RLGr10 | RLGr2 | 0.1692 | 2.2e-16 |
| RLGr2 | RLI | 0.1249 | 1.49e-13 |
| RLGr10 | PGr10 | 0.1034 | 0.000529 |
| RLGr2 | PGr2 | 0.0686 | 0.007783 |
| RLI | PI | 0.0724 | 0.08008 |
| PGr10 | PGr2 | 0.1897 | 6.639e-10 |
| PGr2 | PI | 0.1245 | 0.0007295 |
| PGr10 | FGGr10 | 0.1105 | 0.0001426 |
| PGr2 | FGGr2 | 0.1064 | 1.228e-07 |
| PI | FGI | 0.1379 | 1.304e-06 |
| FGGr10 | FGGr2 | 0.1909 | 2.2e-16 |
| FGGr2 | FGI | 0.1353 | 2.2e-16 |
| RHGr10 | RHGr2 | 0.1658 | 2.801e-08 |
| RHGr2 | RHI | 0.112 | 0.02062 |
| RHGr10 | RLGr10 | 0.069 | 0.008986 |
| RHGr2 | RLGr2 | 0.0799 | 0.007649 |
| RHI | RLI | 0.088 | 0.05248 |
| RLGr10 | RLGr2 | 0.1682 | 2.2e-16 |
| RLGr2 | RLI | 0.1029 | 3.799e-09 |
| RLGr10 | PGr10 | 0.0802 | 0.01511 |
| RLGr2 | PGr2 | 0.032 | 0.5936 |
| RLI | PI | 0.0696 | 0.1084 |
| PGr10 | PGr2 | 0.2018 | 5.521e-11 |
| PGr2 | PI | 0.1478 | 3.589e-05 |
| PGr10 | FGGr10 | 0.1098 | 0.0001757 |
| PGr2 | FGGr2 | 0.0867 | 4.108e-05 |
| PI | FGI | 0.0905 | 0.004841 |
| FGGr10 | FGGr2 | 0.1796 | 2.2e-16 |
| FGGr2 | FGI | 0.121 | 2.2e-16 |
| RHGr10 | PGr10 | 0.0666 | 0.1217 |
| RHGr2 | PGr2 | 0.0719 | 0.08098 |
| RHI | PI | 0.1187 | 0.02229 |
The Columns in the Table are as follows:
1–2: Sample ID. – galaxies in rich () groups, – galaxies in poor () groups, – isolated galaxies (i.e. galaxies which do not belong to groups); RH – high density cores of rich superclusters, RL – low density regions of rich superclusters, P – poor superclusters, FG – field galaxies.
3–4: the Kolmogorov-Smirnov test results: the maximum difference and the probability that the distributions of population parameters are taken from the same parent distribution.
3.5 Luminosities of supercluster main galaxies
We determined for each supercluster the main group and its main galaxy as described in Paper I: the most luminous cluster in the vicinity of the highest density peak in a supercluster is considered as the main cluster and its brightest galaxy – the main galaxy of the supercluster. When determining main galaxies we used an automated search routine, without using supplementary information on the morphological type, colour etc.
Fig. 10 (left panel) shows the luminosities of main galaxies of superclusters at various distances from the observer. Since almost all main galaxies have a luminosity higher than the 2dF survey limit the trend with distance is weak. Note the narrow range of luminosities of main galaxies.
Fig. 10 (right panel) shows the distributions of luminosities of supercluster main galaxies. This Figure shows that main galaxies of rich superclusters have larger luminosities than those of poor superclusters. The median luminosities of main galaxies of rich and poor superclusters and of groups in the field are, correspondingly, 21.2, 20.9 and 19.7 magnitudes. The Kolmogorov-Smirnov test shows that the probability that the luminosities of main galaxies of rich and poor superclusters are taken from the same parent distribution is less than , the probability that the luminosities of main galaxies of superclusters and of groups in the field are taken from the same parent distribution is less than .
4 Discussion and conclusions
A detailed study of luminosity functions of galaxies from the 2dF survey in regions of different density of the large-scale environment was made by Croton et al. (cr05 (2005)), and in clusters by De Propris et al. (depr03 (2003)). De Propris et al. (depr03 (2003)) found that the luminosity functions of early type galaxies in clusters are brighter and steeper than those in the field, and that clustering of passive galaxies is stronger than clustering of actively star forming galaxies (Madgwick et al. 2003b ). Using densities smoothed on a scale of 8 Mpc Croton et al. (cr05 (2005)) divided the volume under study into 7 regions of various environmental densities, from extreme voids to cluster populations and found that the brightest galaxies in voids are approximately 5 times fainter than those in clusters. Even larger differences between luminosities of galaxies in high and low density regions were found in Einasto et al. (2005b ). In the present paper we showed, in accordance to these results, that the luminosity-density dependence in important for galaxies of all types both in superclusters and among field galaxies at all densities.
Several recent studies address the problem whether the properties of galaxies, their star formation activity in particular, correlates with the local and/or global environment of galaxies, defined, for example, as the clustercentric distance. The well-known morphology-density relation is an example of such correlation (Dressler (d80 (1980)). One question asked in these studies is whether there exists a critical density so that star formation is supressed in all groups/clusters where the density exceeds this critical value. Lewis et al. (lew02 (2002)) used the data about star-forming galaxies in the 2dFGRS to show that there exists a correlation between the star formation activity and the local galaxy density which holds for galaxies at distances at least two virial radii from the cluster/group centre.
Balogh et al. (balogh04 (2004)) compared the populations of star-forming and quiescent galaxies in small (1.1 Mpc) and large scales (5.5 Mpc) and showed that the relative numbers of these galaxies depend both on the local and global environments. Even low density environments contain a large fraction of non-star-forming galaxies. They concluded that the galaxy population must be only indirectly related to their present-day environment. Possible physical mechanisms must have been more effective in the past, and perhaps affeced the star formation rate in very short (less than 1 Gyr) timescales, like starbursts induced by galaxy interactions in close pairs of galaxies (see Balogh et al. balogh04 (2004) and references therein).
Gray et al. (gray04 (2004)) found, using data about the supercluster A901/902, strong evidence that the highest density regions in clusters are populated mostly with quiescent galaxies, while star forming galaxies dominate in outer/lower density regions of clusters. Similarly, Haines et al. (hai06 (2006)) demonstrated that the colours of galaxies in the core region of the Shapley supercluster depend on environment, redder galaxies being located in cluster cores. They also found large concentrations of faint blue galaxies between clusters.
Our results are in accordance with those;in addition we showed that even at supercluster scales, the properties of galaxies and their environmental densities are correlated. In high density cores of rich superclusters the fraction of quiescent (red) galaxies is higher than this fraction in lower density regions even for those galaxies which do not belong to groups or clusters.
Porter and Raychaudhury (pr05 (2005)) investigated the star formation rate in groups of galaxies from the Pisces-Cetus supercluster, according to their spectral index . They concluded that galaxies in rich clusters have lower star formation rates than galaxies in poor groups. This is in accordance with our results, showing that galaxies from a higher density environment have lower star formation rates than galaxies from a lower density environment.
Our previous analysis in Paper II demonstrated that geometrical properties of rich and poor superclusters are different, rich superclusters have larger sizes, their shapes and compactness differ from those of poor superclusters. The mean density of superclusters increases gradually with increasing total luminosity or richness of superclusters. This demonstrates that rich superclusters are physical systems with properties different from those of poor systems, they do not represent just percolations of several loose systems.
Our present study reveals additional differences between rich and poor superclusters. Rich superclusters contain high density cores which are absent in poor supercluters. The fraction of early type and passive galaxies in groups and clusters and among isolated galaxies in high density cores of rich superclusters is higher than in groups in poor superclusters.
We shall analyse the detailed properties of high density regions in rich superclusters in another study (Einasto et al., in preparation).
Hilton et al. (hil05 (2005)) found that the fraction of early spectral type galaxies is significantly higher in clusters with a high X-ray flux. Many of these clusters belong to rich superclusters (Einasto et al. e2001 (2001), Belsole et al. bel04 (2004)), so this result is in accordance with the present paper.
Our analysis shows that main galaxies of superclusters form a specific class of galaxies with a very limited range of luminosities. Main galaxies of rich superclusters are more luminous than main galaxies of poor superclusters. A similar conclusion has been reached by Einasto & Einasto (e87 (1987)) using data on nearby superclusters. This is in accordance with the result of De Propris et al. (depr03 (2003)) that there is an excess of very bright galaxies in cores of clusters. Main galaxies of superclusters are formed by multiple merger processes, as indicated by direct observations and numerical simulations (see Laine et al. laine03 (2003) and Gao et al. gao05 (2005)). It has been known already for a long time that first-ranked cluster galaxies have a small dispersion of absolute magnitudes (Hubble & Humason hubble31 (1931), Hubble hubble36 (1936), Sandage sandage76 (1976)). More recent studies by Postman & Lauer (postman95 (1995)) and Laine et al. (laine03 (2003)) have shown that absolute magnitudes of brightest cluster galaxies have a scatter of about 0.24 - 0.33 mag. The scatter of luminosities of supercluster main galaxies is larger than the scatter of brightest cluster galaxies. There may be several reasons for this. One possibility is that we have found the main group and its main galaxy by an automated search routine, and supplementary information on the morphological type, colour etc. has not been used. For this reason our sample of main galaxies is probably not as homogeneous as samples of first-ranked cluster galaxies investigated by Hubble, Sandage, Postman and others.
Our analysis shows a large scatter of the properties of galaxies in poor superclusters. In rich superclusters this scatter is small.
Numerical simulations show that dynamical evolution in high-density regions is determined by a high overall mean density that speeds up clustering of particles (Einasto et al. 2005b and references therein, Gao, Springel and White gsw05 (2005)). In high density regions clustering starts early and continues until the present. The haloes that populate high density regions are themselves also richer, more massive and have larger velocities than the haloes in low density regions. In low density filaments that cross voids, as well as in the outer low density regions of high density systems, the mean density is low and thus the evolution is slow, and in these regions haloes themselves are also poor, less massive and have small velocities. These differences affect the evolution and properties of galaxies in various environments.
In this paper we have used a catalogue of superclusters of galaxies from the 2dF galaxy redshift survey to study the properties of galaxies in superclusters and the properties of the richest superclusters. Our main conclusions are the following.
-
•
The density distributions in rich and poor superclusters are different. The densities in rich superclusters are higher than in poor superclusters, and rich superclusters contain high density cores which are absent in poor superclusters.
-
•
Rich superclusters contain a higher fraction of early type, passive, red galaxies than poor superclusters.
-
•
The properties of galaxies are correlated with the values of the luminosity density field smoothed on a scale of 8 Mpc/h: early type, passive, non-starforming galaxies have higher environmental densities while late type, active, star/forming galaxies have lower environmental densities. This trend extends to field galaxies and to the lowest densities in our sample.
-
•
The fraction of early type, passive galaxies is the highest in rich groups/clusters in high density regions of rich superclusters. In these high density regions even among isolated galaxies the fraction of star forming galaxies is smaller than the fraction of star forming galaxies among isolated galaxies in poor superclusters and in the field.
-
•
Main galaxies of rich superclusters have larger luminosities (median value 21.2) than main galaxies of poor superclusters (median value 20.9) and main galaxies of groups in the field (median value 19.7).
Our results show that both local (group/cluster) environments and global (supercluster) environments are important in ifluencing galaxy morphologies and their star formation activity. This indicates the importance of the role of superclusters, and specially rich superclusters as a high density environment, which affects the properties of their member galaxies and groups/clusters of galaxies.
Acknowledgements.
We are pleased to thank the 2dFGRS Team for the publicly available data releases. The present study was supported by Estonian Science Foundation grants No. 4695, 5347 and 6104, and Estonian Ministry for Education and Science support by grant TO 0060058S98. This work has also been supported by the University of Valencia through a visiting professorship for Enn Saar and by the Spanish MCyT project AYA2003-08739-C02-01. J.E. thanks Astrophysikalisches Institut Potsdam (using DFG-grant 436 EST 17/2/05) for hospitality where part of this study was performed. P.H. was supported by the Finnish Academy of Sciences (grant 46733).References
- (1) Abell, G.: 1958, ApJS 3, 211
- (2) Abell, G., Corwin, H., Olowin, R.: 1989, ApJS 70, 1
- (3) Bahcall, N., McKay, T.A., Annis, J., et al. : 2003, ApJS 148, 243
- (4) Balogh, M., Eke, V., Miller, C., et al. 2004, MNRAS, 348, 1355
- (5) Basilakos, S., 2003, MNRAS 344, 602
- (6) Belsole, E., Pratt, G.W., Sauvageot, J.-L-., Bourdin, H., AA, 415, 821
- (7) Blanton, M.R., Eisenstein, D., Hogg, D.W., et al. 2004a, ApJ, 629, 143
- (8) Blanton, M.R., Eisenstein, D., Hogg, D.W., et al. 2006, ApJ, 645, 977
- (9) Broadhurst, T.J., Ellis, R.S., Koo, D.C. and Szalay, A.S., 1990, Nature, 343, 726
- (10) Colless, M.M., Dalton, G.B., Maddox, S.J., et al. : 2001, MNRAS 328, 1039
- (11) Colless, M.M., Peterson, B.A., Jackson, C.A., et al. : 2003, (astro-ph/0306581)
- (12) Croton, D.J., Farrar, G.R., Norberg, P., et al., 2005, MNRAS, 356, 1155
- (13) Croton, D.J., Springel, V., White, S.D.M., et al., 2006, MNRAS, 367, 864
- (14) Davis, M., & Geller, M.J. 1976, ApJ, 208, 13
- (15) De Propris, R., et al. (2dF GRS Team): 2002, MNRAS 329, 87
- (16) De Propris, R., et al. (2dF GRS Team): 2003, MNRAS 342, 725
- (17) Dressler, A., 1980, ApJ 236, 351
- (18) Einasto, J., Einasto, M., Hütsi, G., et al. : 2003a, A&A 410, 425 (E03a)
- (19) Einasto, J., Einasto, M., Tago, E. et al. 1999, ApJ, 519, 456
- (20) Einasto, J., Einasto, M., Tago, E. et al. 2006a, A&A, (submitted, Paper I) (astro-ph/0603764)
- (21) Einasto, J., Einasto, M., Saar, E. et al. 2006b, A&A, (accepted, Paper II) (astro-ph/0604539)
- (22) Einasto, J., Hütsi, G., Einasto, M., et al. : 2003b, A&A 405, 425 (E03b)
- (23) Einasto, J., Tago E., Einasto, M., Saar, E.: 2005a, In ”Nearby Large-Scale Structures and the Zone of Avoidance”, eds. A.P. Fairall, P. Woudt, ASP Conf. Series, 329, 27
- (24) Einasto, J., Tago E., Einasto, M., et al. 2005b, A&A, 439, 45 (E05b)
- (25) Einasto, J., Einasto, M., Gottlöber, S. et al. 1997a, Nature, 385, 139
- (26) Einasto, M., 1991, MNRAS, 252, 261
- (27) Einasto, M., & Einasto, J., 1987, MNRAS, 226, 543 (E87)
- (28) Einasto, M., Einasto, J., Müller, V., Heinämäki, P., Tucker, D.L.: 2003c, AA 401, 851
- (29) Einasto, M., Einasto, J., Tago, E., Dalton, G. & Andernach, H., 1994, MNRAS, 269, 301 (E94)
- (30) Einasto, M., Einasto, J., Tago, E., Müller, V. & Andernach, H., 2001, AJ, 122, 2222 (E01)
- (31) Einasto, M., Jaaniste, J., Einasto, J., et al., 2003d, AA 405, 821
- (32) Einasto, M., Tago, E., Jaaniste, J., Einasto, J. & Andernach, H., 1997, A&A Suppl., 123, 119
- (33) Eke, V. R., Baugh, C. M., Cole, S., et al. : 2004, MNRAS 348, 866
- (34) Erdogdu, P., Lahav, O., Zaroubi, S. et al. 2004, MNRAS,352, 939
- (35) Gao, L., White, S.D.M., Jenkins, A. et al. 2005, MNRAS, 363, 379
- (36) Gao, L., Springel, V. and White, S.D.M. 2005, MNRAS, 363, 66
- (37) Giovanelli, R., Haynes, M.P., Chincarini, G. L., 1986, ApJ 300, 77
- (38) Goto, T, Okamura, S., Sekiguchi, M., et al. 2003, PASJ 55, 757
- (39) Gray, M.E., Wolf, C., Meisenheimer, K. et al. 2004, MNRAS,347, L73
- (40) Haines, C.P., Merluzzi, P., Mercurio, A., et al. 2006, [astro-ph/0606152]
- (41) Hilton, M., Collins, C., De Propris, R. et al., MNRAS 363, 661
- (42) Hogg, D.W., Blanton, M.R., Brinchmann, J., et al. 2004, ApJ, 601, L29
- (43) Hogg, D.W., Blanton, M.R., Eisenstein, D.J. et al. 2003, ApJ, 585, L5
- (44) Hubble, E. & Humason, M.L. 1931,ApJ, 74, 43
- (45) Hubble, E. 1936, ApJ, 84, 270
- (46) Huchra, J. P., Geller, M. J.: 1982, ApJ 257, 423
- (47) Ihaka, R., & Gentleman, R., 1996, J. of Computational and Graphical Statistics, 5, 299
- (48) Kennicutt, R.C., J.: 1992, ApJS 79, 255
- (49) Lahav, O. 2004, Pub. Astr. Soc. Australia, 21, 404
- (50) Lahav, O. 2005, In ”Nearby Large-Scale Structures and the Zone of Avoidance”, eds. A.P. Fairall, P. Woudt, ASP Conf. Series, 329, 3
- (51) Laine, S., van der Marel, R., Lauer, T.R. et al. 2003, AJ, 125, 478
- (52) Lewis, I., Balogh, M., De Propris, R., et al. 2002, MNRAS, 334, 673
- (53) Madgwick, D.S., et al. (the 2dFGRS Team), 2002, MNRAS, 333, 133
- (54) Madgwick, D.S., Somerville, R., Lahav, O., Ellis, R., 2003, MNRAS, 343, 871
- (55) Madgwick, D.S., Hawkins, E., Lahav, O., et al., 2003, MNRAS, 344, 847
- (56) Mo, H. J., Einasto, M., Xia, X. Y., Deng, Z. G.: 1992, MNRAS 255, 382.
- (57) Norberg, P., Baugh, C.M., Hawkins, E., et al. 2001, MNRAS, 328, 64
- (58) Norberg, P., Baugh, C.M., Hawkins, E., et al. 2002, MNRAS, 332, 827
- (59) Norberg, P., Cole, S., Baugh, C.M. et al.: 2002, MNRAS 336, 907
- (60) Oort, J.H. 1983, Ann. Rev. Astr. Astrophys. 21, 373
- (61) Porter, S.C. & Raychaudhury, S. 2005, MNRAS, 364, 1387
- (62) Postman, M. & Lauer, T.R. 1995, ApJ, 440, 28
- (63) Sandage, A., 1976, ApJ, 205, 6
- (64) Springel, V., White, S.D.M., Jenkins, A. et al. 2005, Nature, 435, 629
- (65) Tago, E., Einasto, J., Saar, E. et al. 2006, AN, 327, 365 (T06)
- (66) Tucker, D.L., Oemler, A.Jr., Hashimoto, Y., et al. : 2000, ApJS 130, 237
- (67) Wild, V., Peacock, J.A., Lahav, O., et al. (the 2dFGRS Team), 2004, MNRAS, …
- (68) Yang, X., Mo, H.J., van den Bosch, F.C., Jing, Y.P.: 2004, MNRAS 357, 608
- (69) Zehavi, I., Blanton, M. R., Frieman, J. A., et al. 2002, ApJ, 571, 172
- (70) Zucca, E. et al. 1993, ApJ, 407, 470