Discovery of a Gravitationally Lensed Quasar from the Sloan Digital Sky Survey: SDSS J133222.62+034739.9 111Based in part on data collected at Subaru Telescope, which is operated by the National Astronomical Observatory of Japan.
Abstract
We report the discovery of the two-image gravitationally lensed quasar SDSS J133222.62+034739.9 (SDSS J1332+0347) with an image separation of . This system consists of a source quasar at and a lens galaxy at . The agreement of the luminosity, ellipticity and position angle of the lens galaxy with those expected from lens model confirms the lensing hypothesis.
1 Introduction
Strong gravitational lensing is a powerful probe of the large scale properties of the universe (Kochanek, 2006). The well-known physics makes it straightforward to use lensing in cosmological estimates of the dark energy (Turner, 1990; Fukugita et al., 1990) and the Hubble constant (Refsdal, 1964). The gravitational lensing effect depends solely on the mass density of the field, it is also an ideal tool for studies of dark matter in galaxies and clusters of galaxies (e.g., Oguri et al., 2004a). The Cosmic Lens All Sky Survey (CLASS; Myers et al., 2003; Browne et al., 2003), which was conducted in the radio band, is the largest current statistical sample of lensed compact sources. However, the CLASS has only 13 lensed radio sources in its well-defined statistical sample. Larger lens samples are critical to using lensed quasars for cosmological and astrophysical tests.
Optical surveys for lensed quasars are both complementary to radio surveys like the CLASS and likely to produce larger lens samples since only one-tenth of quasars are radio-loud (Ivezić et al., 2002). Our Sloan Digital Sky Survey Quasar Lens Search (SQLS; Oguri et al., 2006) is based on the Sloan Digital Sky Survey (SDSS; York et al., 2000), and its catalog of roughly 100,000 spectroscopically-confirmed quasars (e.g., Schneider et al., 2005). So far, the SQLS has succeeded in discovering 14 new lensed quasars (Inada et al., 2003a, b, c, 2005, 2006; Johnston et al., 2003; Morgan et al., 2003; Pindor et al., 2004, 2006; Oguri et al., 2004b, 2005; Burles et al., 2006), as well as recovering many previously known lensed quasars (Walsh et al., 1979; Weymann et al., 1980; Surdej et al., 1987; Bade et al., 1997; Oscoz et al., 1997; Schechter et al., 1998; Morgan et al., 2001). Indeed, the number of SDSS-discovered lensed quasars is already a significant fraction of all known quasar lenses ( 222see CASTLES website, http://cfa-www.harvard.edu/castles/). The large number of lenses contained in the SQLS and its well-defined selection function means that the lens catalog provided by the SQLS will be very useful for statistical studies of strong lensing (Oguri et al., 2006).
In this paper, we report the discovery of a gravitationally lensed quasar, SDSS J133222.62+034739.9 (hereafter SDSS J1332+0347). The quasar was confirmed to be doubly imaged by a low-redshift early-type galaxy, from observations using the Subaru 8.2-meter telescope and the University of Hawaii 2.2-meter (UH88) telescope. This paper is organized as follows. The SDSS data for SDSS J1332+0347, including its selection, is described in §2. The follow-up images and spectra are shown in §3 and §4, respectively. In §5 we model the lens. Finally we summarize our results in §6. Throughout the paper we assume a cosmological model with the matter density , cosmological constant , and Hubble constant . Magnitudes are measured in AB system.
2 SDSS Data
The SDSS is a survey to conduct both optical imaging and spectroscopy. It covers about 10,000 square degrees of the sky approximately centered on the North Galactic Cap with the dedicated wide-field 2.5-m telescope (Gunn et al., 2006) at the Apache Point Observatory in New Mexico, USA. The five broad-band photometric data are taken in imaging surveys (Fukugita et al., 1996; Gunn et al., 1998; Lupton et al., 1999; Tucker et al., 2006) and are reduced automatically by the photometric pipeline (Lupton et al., 2001). From the magnitudes, colors, and morphologies of each object, quasar and galaxy candidates are selected as spectroscopic targets (Eisenstein et al., 2001; Richards et al., 2002; Strauss et al., 2002), and then assigned for spectroscopic observations by the tiling algorithm (Blanton et al., 2003). The spectra cover the wavelength range from 3800 Å to 9200 Å with a resolution of . The astrometric accuracy is better than rms (Pier et al., 2003) and the photometric zeropoint errors are less than magnitude over the entire survey area (Hogg et al., 2001; Smith et al., 2002; Ivezić et al., 2004). Most of the data have already become publicly available (Stoughton et al., 2002; Abazajian et al., 2003, 2004, 2005; Adelman-McCarthy et al., 2006).
SDSS J1332+0347 was selected as a lensed quasar candidate from the SDSS quasar sample, using the same selection algorithm as that described in Inada et al. (2003a). In this algorithm, the morphological parameters of each quasar are used to select lensed quasar candidates. SDSS J1332+0347 was also selected by an improved algorithm (Oguri et al., 2006) whose selection function has been extensively tested, and it is in the well-defined source quasar sample of the SQLS for lensed quasar statistics.
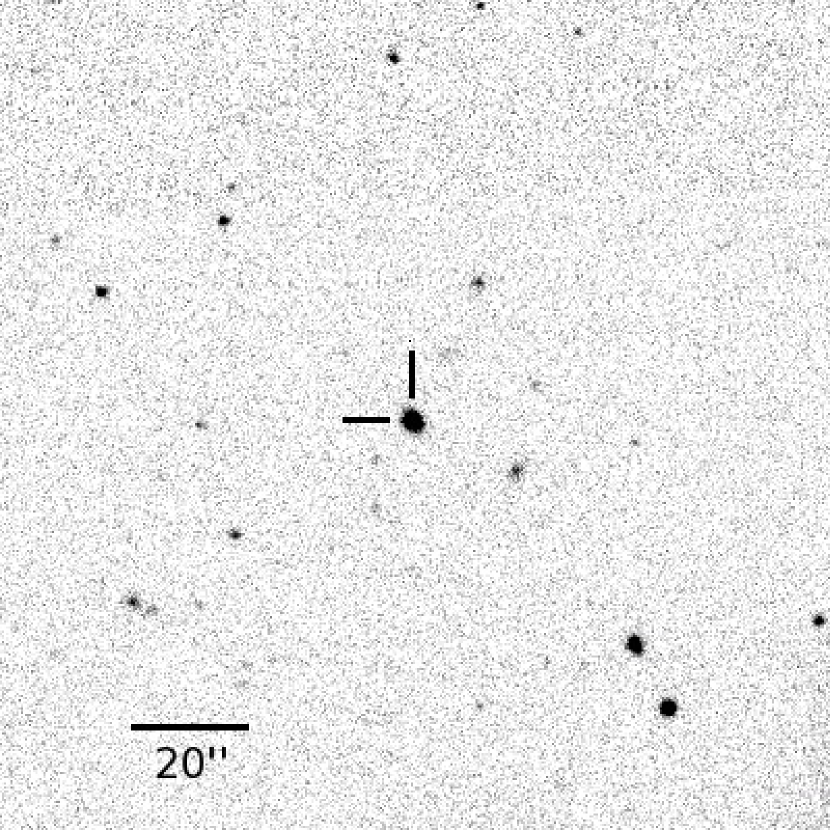
Figure 1 shows the SDSS -band image of the field under the seeing of . The SDSS Point Spread Function (PSF) magnitudes and the quasar redshift are summarized in Table 1. The SDSS images indicate that the object is more extended than a single star, making it a good lens candidate and a target for higher angular resolution observations.
3 Imaging Observations
We obtained a 90 sec -band image of SDSS J1332+0347 with the Suprime-Cam (Miyazaki et al., 2002) on the Subaru 8.2-meter telescope at Mauna Kea in seeing on 2003 May 28. The -band image was reduced in a standard way for the Suprime-Cam data using the NEKO software (Yagi et al., 2002) and the SDFRED package (Ouchi et al., 2004). The absolute flux was calibrated using nearby stars in the SDSS catalogs. The small differences between the SDSS and Suprime-Cam -band response functions are not important here. We also acquired a 720 sec -band image of this object with the QUick near-InfraRed Camera (QUIRC) on the UH88 telescope in seeing on 2005 February 20. The -band image was reduced in a standard way using IRAF 333IRAF is the Image Reduction and Analysis Facility, a general purpose software system for the reduction and analysis of astronomical data. IRAF is written and supported by the IRAF programming group at the National Optical Astronomy Observatories (NOAO) in Tucson, Arizona. NOAO is operated by the Association of Universities for Research in Astronomy (AURA), Inc. under cooperative agreement with the National Science Foundation., and calibrated using the standard star FS 23 (Hawarden et al., 2001).
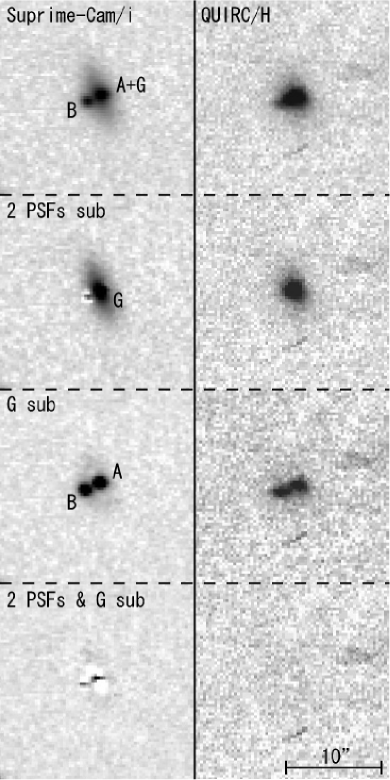
The and images are shown in Figure 2. Taking a closer look at the images, especially the -band Suprime-Cam image, we see two compact sources bracketing an extended elliptical source. Indeed, models of the images using a public software, GALFIT (Peng et al., 2002), consisting of two point sources and an extended object with a de Vaucouleurs profile between them fit the data well. We used stars in the images as templates for the PSF in this procedure. We also show the observed galaxy after subtracting models for the two point sources, the observed stellar components after subtracting models for the galaxy, and the residuals after subtracting models for the point sources and the galaxy, in the second, third, and bottom panels of Figure 2, respectively. We name the two stellar components A and B, where A is the brighter component that lies closer to the galaxy (separated by 026), component G. The separation of the two stellar components derived from the -band image is , and our relative astrometry is summarized in Table 2. The stellar components have similar colors of and mag for A and B, respectively, while the galaxy G has a redder color of mag. The photometry of the components is also summarized in Table 2. These astrometric and photometric properties are typical of known lensed quasar systems (e.g., Inada et al., 2006), and imply that both components A and B are lensed images of a quasar and component G is the lens galaxy.
4 Spectroscopic Observations
We carried out a spectroscopic observation of SDSS J1332+0347 using the Faint Object Camera And Spectrograph (FOCAS; Kashikawa et al., 2002) installed on the Subaru 8.2-meter telescope on 2003 June 20 with an exposure time of 900 sec in seeing. The observation was conducted in 22 on-chip binning mode, using a -width slit aligned along components A and B, with the grism 300B and the filter L600. This configuration provides a spectrum covering 3,900 Å to 6,000 Å with a spectral resolution of R, a spectral dispersion of 2.7 Å pixel-1 and a spatial pixel scale of . We used IRAF to analyze the spectra, extracting two traces corresponding to a blend of image A with the galaxy G and image B, respectively.
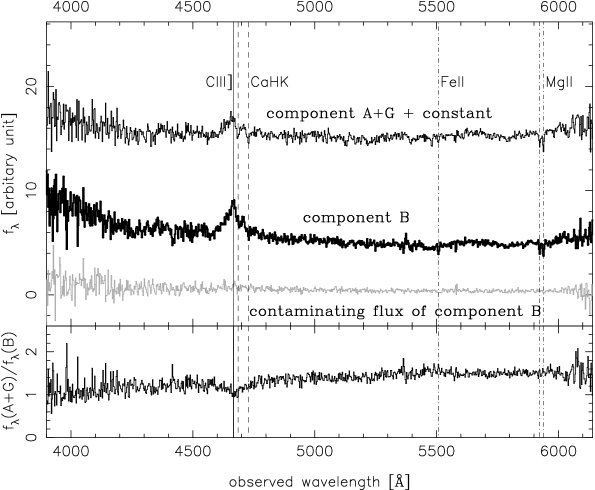
The two spectra are shown in Figure 3. We clearly see broad C III] emission lines redshifted to . On the red wings of the C III] emission lines, we also see an absorption doublet at 4686 Å and 4728 Å, which we interpret as Ca II H and K absorption lines redshifted to . These strong absorption lines significantly distort the emission lines. It would be helpful to have a cleaner emission line in order to determine the quasar redshifts more accurately, but, the C III] emission lines are the only strong emission lines in the FOCAS spectra. We estimated the quasar redshifts using three approaches; 1) using the whole line profiles (), 2) using only the line peaks (), and 3) using the whole line profiles after masking and then interpolating through the absorption lines (). The results, summarized in Table 3, confirm that the two quasars have the same redshifts. We adopt procedure 3) for our standard result of as it is likely to be the most reliable. We also verified that the spectrum A+G has little contamination from quasar B by extracting a spectrum at the same distance from component B as component A+G but in the opposite direction. The spectrum, shown in Figure 3, has no significant emission, and we conclude that the C III] emission line in the spectrum A+G is due to component A. Furthermore, in the spectra of both components A+G and B, we can see Mg II 2796,2803 doublet absorption lines and a Fe II 2600 absorption line by an intervening object at .
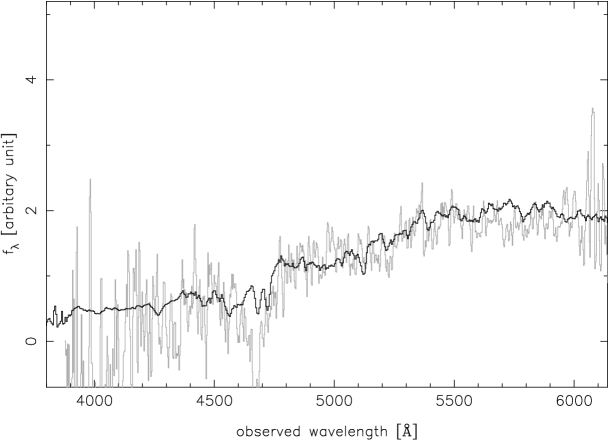
The spectral flux ratio between components A+G and B, displayed in the bottom panel of Figure 3, indicates that combination of A+G is redder than component B. If we scale the spectrum B by the -band flux ratio of between components A and B, and subtract it from the spectrum A+G, then we obtain the residual spectrum shown in Figure 4. While the spectrum is noisy, especially around the C III] emission line and towards the blue wavelength region, the spectral energy distribution (SED) is consistent with a template spectrum of an elliptical galaxy (Kinney et al., 1996) at the redshift of the Ca II absorption feature, . Given the strength of the absorption, we conclude that the SEDs of components A and B are identical and that component G is an elliptical galaxy at .
5 Lens Model
We used the lensmodel package (Keeton, 2001b) to fit a mass model to the observations of SDSS J1332+0347, assuming that the object is indeed a lensed quasar system. We assume the standard Singular Isothermal Ellipsoid (SIE) model characterized by eight parameters: the Einstein radius , ellipticity , position angle , position of the lensing galaxy, the position and flux of the source quasar. Since the number of observable constraints is also eight (the positions of A, B, and G, and the fluxes of A and B), the number of degrees of freedom is zero. As expected, we were able to find a model that perfectly reproduces the observables, . The results of the model are presented in Table 4. We note that the best-fit values for the ellipticity and the position angle, and , are in good agreement with those observed for the galaxy G (derived using GALFIT in -band image; see Figure 2), of and , respectively.
Einstein radii are related to the velocity dispersions of lensing galaxies, so we can use the Faber and Jackson relation (Faber & Jacson, 1976) to estimate the luminosity of the lens galaxy. From the best-fit value , we estimate that the apparent magnitude of the lens is , assuming the correlation of velocity dispersions and magnitudes of early-type galaxies derived by Bernardi et al. (2003). This is again in good agreement with the observed magnitude of the galaxy G, (Table 2), implying that galaxy G is responsible for the most of the lens potential.
6 Conclusions
We have presented the extensive follow-up observations of SDSS J1332+0347 using the Subaru telescope and UH88 telescope. We found a bright galaxy (component G) between two stellar components (components A and B) with similar color in both the Subaru/Suprime-Cam -band and UH88/QUIRC -band images. Although the C III] emission lines of the two stellar components are distorted by the Ca II H and K absorption lines from the bright galaxy at , we can still confirm that the two quasars are at the same redshift, . Subtraction of a scaled spectrum of component B from the component A+G leaves a residual that is consistent with the spectrum of an elliptical galaxy redshifted to . The observed luminosity, ellipticity and position angle of the bright galaxy are in good agreement with those expected from a standard lens model. All these results lead us to the conclusion that SDSS J1332+0347 is indeed a lensed quasar system, where a source quasar at is lensed by a bright lens galaxy at resulting in an image separation of . One peculiar characteristic of the lens is that the brighter component A is closer to the lens galaxy than the fainter component B. We have no difficulty reproducing the flux ratio, and note that such inverted flux ratios were also observed and easily modeled in the two-image lens HE1104–1805 (Wisotzki et al., 1993). This discovery adds another object to the complete sample of the SDSS lensed quasars that can be used to estimate the cosmological model. The brightness of the lens galaxy also makes it a good candidate for dynamical observations; higher-resolution imaging would allow us to determine more accurately the brightness of the components in this lens system, and spectroscopic observations with better signal-to-noise ratios would also allow us to study the interstellar medium in the lens galaxy in detail.
References
- Abazajian et al. (2003) Abazajian, K., et al. 2003, AJ, 126, 2081
- Abazajian et al. (2004) Abazajian, K., et al. 2004, AJ, 128, 502
- Abazajian et al. (2005) Abazajian, K., et al. 2005, AJ, 129, 1755
- Adelman-McCarthy et al. (2006) Adelman-McCarthy, J. K., et al. 2006, ApJS, 162, 38
- Bade et al. (1997) Bade, N., Siebert, J., Lopez, S., Voges, W., & Reimers, D. 1997, A&A, 317, L13
- Bernardi et al. (2003) Bernardi, M., et al. 2003, AJ, 125, 1849
- Blanton et al. (2003) Blanton, M. R., Lin, H., Lupton, R. H., Maley, F. M., Young, N., Zehavi, I., & Loveday, J. 2003, AJ, 125, 2276
- Browne et al. (2003) Browne, I. W. A., et al. 2003, MNRAS, 341, 13
- Burles et al. (2006) Burles, S., et al. 2006, AJ, in preparation
- Eisenstein et al. (2001) Eisenstein, D. J., et al. 2001, AJ, 122, 2267
- Fukugita et al. (1990) Fukugita, M., Futamase, T., & Kasai, M. 1990, MNRAS, 246, 24P
- Fukugita et al. (1996) Fukugita, M., Ichikawa, T., Gunn, J. E., Doi, M., Shimasaku, K., & Schneider, D. P. 1996, AJ, 111, 1748
- Gunn et al. (1998) Gunn, J. E., et al. 1998, AJ, 116, 3040
- Gunn et al. (2006) Gunn, J. E., et al. 2006, AJ, 131, 2332
- Hawarden et al. (2001) Hawarden, T. G., Leggett, S. K., Letawsky, M. B., Ballantyne, D. R., & Casali, M. M. 2001, MNRAS, 325, 563
- Hogg et al. (2001) Hogg, D. W., Finkbeiner, D. P., Schlegel, D. J., & Gunn, J. E. 2001, AJ, 122, 2129
- Inada et al. (2003a) Inada, N., et al. 2003a, AJ, 126, 666
- Inada et al. (2003b) Inada, N., et al. 2003b, AJ, submitted
- Inada et al. (2003c) Inada, N., et al. 2003c, Nature, 426, 810
- Inada et al. (2005) Inada, N., et al. 2005, AJ, 130, 1967
- Inada et al. (2006) Inada, N., et al. 2006, AJ, 131, 1934
- Ivezić et al. (2002) Ivezić, Ž., et al. 2002, AJ, 124, 2364
- Ivezić et al. (2004) Ivezić, Ž., et al. 2004, AN, 325, 583
- Faber & Jacson (1976) Faber, S. M., & Jackson, R. E. 1976, ApJ, 204, 668
- Johnston et al. (2003) Johnston, D. E., et al. 2003, AJ, 126, 2281
- Kashikawa et al. (2002) Kashikawa, N., et al. 2002, PASJ, 54, 819
- Keeton (2001b) Keeton, C. R. 2001b, preprint (astro-ph/0102340)
- Kinney et al. (1996) Kinney, A. L., et al. 1996, ApJ, 467, 38
- Kochanek (2006) Kochanek, C. S., 2006, in Gravitational Lensing: Strong, Weak and Micro, Saas-Fee Advanced Course 33, G. Meylan, P. North, P. Jetzer, eds., (Springer: Berlin) 91 [astro-ph/0407232]
- Lupton et al. (1999) Lupton, R. H., Gunn, J. E., & Szalay, A. S. 1999, AJ, 118, 1406
- Lupton et al. (2001) Lupton, R., Gunn, J. E., Ivezić, Z., Knapp, G. R., Kent, S., & Yasuda, N. 2001, in ASP Conf. Ser. 238, Astronomical Data Analysis Software and Systems X, ed. F. R. Harnden, Jr., F. A. Primini, and H. E. Payne (San Francisco: Astr. Soc. Pac.), p. 269 (astro-ph/0101420)
- Miyazaki et al. (2002) Miyazaki, S., et al. 2002, PASJ, 54, 833
- Morgan et al. (2001) Morgan, N. D., Becker, R. H., Gregg, M. D., Schechter, P. L., & White, R. L. 2001, AJ, 121, 611
- Morgan et al. (2003) Morgan, N. D., Snyder, J. A., & Reens, L. H. 2003, AJ, 126, 2145
- Myers et al. (2003) Myers, S. T., et al. 2003, MNRAS, 341, 1
- Oguri et al. (2004a) Oguri, M., et al. 2004a, ApJ, 605, 78
- Oguri et al. (2004b) Oguri, M., et al. 2004b, PASJ, 56, 399
- Oguri et al. (2005) Oguri, M., et al. 2005, ApJ, 622, 106
- Oguri et al. (2006) Oguri, M., et al. 2006, AJ, 132, 999
- Oscoz et al. (1997) Oscoz, A., Serra-Ricart, M., Mediavilla, E., Buitrago, J., & Goicoechea, L. J. 1997, AJ, 491, L7
- Ouchi et al. (2004) Ouchi, M., et al. 2004, ApJ, 611, 660
- Peng et al. (2002) Peng, C. Y., Ho, L. C., Impey, C. D., & Rix, H.-W. 2002, AJ, 124, 266
- Pier et al. (2003) Pier, J. R., Munn, J. A., Hindsley, R. B., Hennessy, G. S., Kent, S. M., Lupton, R. H., & Ivezić, Ź. 2003, AJ, 125, 1559
- Pindor et al. (2004) Pindor, B., et al. 2004, AJ, 127, 1318
- Pindor et al. (2006) Pindor, B., et al. 2006, AJ, 131, 41
- Refsdal (1964) Refsdal, S. 1964, MNRAS, 128, 307
- Richards et al. (2002) Richards, G. T., et al. 2002, AJ, 123, 2945
- Schechter et al. (1998) Schechter, P. L., Gregg, M. D., Becker, R. H., Helfand, D. J., & White, R. L. 1998, AJ, 115, 1371
- Schneider et al. (2005) Schneider, D. P., et al. 2005, AJ, 130, 367
- Smith et al. (2002) Smith, A., et al. 2002, AJ, 123, 2121
- Steidel et al. (1992) Steidel, C. C., & Sargent, W. L. W., 1992, ApJS, 80, 1
- Stoughton et al. (2002) Stoughton, C., et al. 2002, AJ, 123, 485
- Strauss et al. (2002) Strauss, M. A., et al. 2002, AJ, 124, 1810
- Surdej et al. (1987) Surdej, J., Swings, J.-P., Magain, P., Courvoisier, T. J.-L., & Borgeest, U. 1987, Nature, 329, 695
- Tucker et al. (2006) Tucker, D. L., et al. 2006, AN, in press
- Turner (1990) Turner, E. L. 1990, ApJ, 365, L43
- Walsh et al. (1979) Walsh, D., Carswell, R. F., & Weymann, R. J. 1979, Nature, 279, 381
- Weymann et al. (1980) Weymann, R. J., et al. 1980, Nature, 285, 641
- Wisotzki et al. (1993) Wisotzki, L., Köhler, R., Kayser, R., & Reimers, D., 1993, A&A, 278, L15
- Yagi et al. (2002) Yagi, M., et al. 2002, AJ, 123, 66
- York et al. (2000) York, D. G., et al. 2000, AJ, 120, 1579
| aaPSF magnitudes from the SDSS imaging data. | aaPSF magnitudes from the SDSS imaging data. | aaPSF magnitudes from the SDSS imaging data. | aaPSF magnitudes from the SDSS imaging data. | aaPSF magnitudes from the SDSS imaging data. | Redshiftbbquasar redshift from the SDSS spectrum. |
|---|---|---|---|---|---|
| 19.120.03 | 18.610.03 | 18.260.02 | 17.950.02 | 17.840.02 | 1.4380.003 |
| Object | [arcsec]aaThe positive directions of and are West and North, respectively. The values are measured in the Subaru Suprime-cam -band image. | [arcsec]aaThe positive directions of and are West and North, respectively. The values are measured in the Subaru Suprime-cam -band image. | bbThe errors do not include the absolute calibration uncertainty. | bbThe errors do not include the absolute calibration uncertainty. |
|---|---|---|---|---|
| A | ||||
| B | ||||
| G |
Note. — All the values are the outputs of the GALFIT procedure for SDSS J1332+0347.
| Object | ||||||
|---|---|---|---|---|---|---|
| A+G | ||||||
| B |
| Parameter | Value |
|---|---|
| Einstein radius | |
| Ellipticity | |
| Position angleaaEach position angle is measured East of North. | |
| Total magnification | |
| Time delay | day |