Two New Gravitationally Lensed Double Quasars from the Sloan Digital Sky Survey
Abstract
We report the discoveries of the two-image gravitationally lensed quasars, SDSS J0746+4403 and SDSS J1406+6126, selected from the Sloan Digital Sky Survey (SDSS). SDSS J0746+4403, which will be included in our lens sample for statistics and cosmology, has a source redshift of , an estimated lens redshift of , and an image separation of . SDSS J1406+6126 has a source redshift of , a spectroscopically measured lens redshift of , and an image separation of . We find that the two quasar images of SDSS J1406+6126 have different intervening Mg II absorption strengths, which are suggestive of large variations of absorbers on kpc scales. The positions and fluxes of both the lensed quasar systems are easily reproduced by simple mass models with reasonable parameter values. These objects bring to 18 the number of lensed quasars that have been discovered from the SDSS data.
1 Introduction
Gravitationally lensed quasars are unique astronomical and cosmological tools (see the review by Kochanek, 2006). They are useful for studying the mass distributions, substructures and interstellar mediums of their lens galaxies, the structure of the quasar host galaxy and accretion disk, and estimating the cosmological model (e.g., Kochanek, 1991; Mao & Schneider, 1998; Chang & Refsdal, 1984; Turner, 1990; Fukugita et al., 1990; Refsdal, 1964). Lensed quasars due to foreground galaxy clusters probe the distribution of dark matter in the lens objects (Oguri et al., 2004a; Williams & Saha, 2004), and their statistics can be an useful test of dark matter models (Narayan & White, 1998; Oguri & Keeton, 2004b). A continuing problem, however, is the limited number of strongly lensed quasars (approximately 100, Kochanek, 2006) and the still more limited number found in systematic surveys. In particular, the current largest completed survey, the Cosmic Lens All Sky Survey (CLASS; Myers et al., 2003; Browne et al., 2003), led to a well-defined statistical sample of only 13 lensed radio sources. While the CLASS survey can be used to obtain constraints on dark energy (Chae et al., 2002; Mitchell et al., 2005), larger well-defined lens samples are needed to be competitive with other approaches to constraining the cosmological model.
The Sloan Digital Sky Survey (SDSS; York et al., 2000) is currently the best candidate for building a larger, well-defined lensed quasar sample than the CLASS. The SDSS is expected to eventually provide a catalog of roughly spectroscopically identified quasars (Schneider et al., 2005, 2006), which we have been searching for gravitationally lensed quasars in the SDSS Quasar Lens Search (SQLS; Oguri et al., 2006; Inada et al., 2006b). Since the probability of a quasar being multiply imaged is of order (Turner et al., 1984), we have a reasonable expectation of obtaining a well-defined sample of roughly 100 lensed quasars. Including the two new lenses reported here, we have now discovered 18 new lensed quasars (Inada et al., 2003a, b, c, 2005, 2006a; Johnston et al., 2003; Morgan et al., 2003; Pindor et al., 2004, 2005; Oguri et al., 2004c, 2005; Burles et al., 2006; Morokuma et al., 2006; Kayo et al., 2006), and recovered 8 previously known lensed quasars (Walsh et al., 1979; Weymann et al., 1980; Surdej et al., 1987; Bade et al., 1997; Oscoz et al., 1997; Schechter et al., 1998; Morgan et al., 2001; Magain et al., 1988), making the SQLS the largest survey for gravitational lensed quasars to date.
In this paper, we present two new doubly-imaged lensed quasars found in the course of the SQLS, SDSS J074653.03+440351.3 (SDSS J0746+4403) and SDSS J140624.82+612640.9 (SDSS J1406+6126). They were confirmed with the observations at the W. M. Keck Observatory’s Keck II telescope, the University of Hawaii 2.2-meter (UH88) telescope, and the MDM Observatory’s 2.4-m Hiltner (MDM 2.4-m) telescope. The structure of this paper is as follows. We describe our lens candidate selection from the SDSS data in §2. The results of the imaging and spectroscopic follow-up observations for SDSS J0746+4403 and SDSS J1406+6126 are presented in §3 and §4, respectively. Section 5 discusses the models of the lensed quasars and we summarize our results in §6. We assume a cosmological model with matter density , cosmological constant , and Hubble constant (Spergel et al., 2003).
2 Selection Algorithm
The SDSS consists of a photometric survey (Gunn et al., 1998; Lupton et al., 1999; Tucker et al., 2006) in five broad-band optical filters (Fukugita et al., 1996) and a spectroscopic survey with a multi-fiber spectrograph covering 3800 Å to 9200 Å at a resolution of , both using a dedicated wide-field ( field of view) 2.5-m telescope (Gunn et al., 2006) at the Apache Point Observatory in New Mexico, USA. The final survey area is about 10,000 square degrees of the sky approximately centered on the North Galactic Cap. Once the imaging data is processed by the photometric pipeline (Lupton et al., 2001; Lupton, 2005), quasar and galaxy candidates are selected for spectroscopy (Eisenstein et al., 2001; Richards et al., 2002; Strauss et al., 2002) and the spectroscopic observations are conducted according to the tiling algorithm of Blanton et al. (2003). The imaging data has an astrometric accuracy better than about rms per coordinate (Pier et al., 2003) and photometric zeropoint errors less than about 0.03 magnitude over the entire survey area (Hogg et al., 2001; Smith et al., 2002; Ivezić et al., 2004). The SDSS is continuously releasing the data to the public (Stoughton et al., 2002; Abazajian et al., 2003, 2004, 2005; Adelman-McCarthy, 2006).
The two objects, SDSS J0746+4403 and SDSS J1406+6126, were selected as lensed quasar candidates from the sample of the SDSS spectroscopically confirmed quasars by two algorithms. The first method is the algorithm we used previously (e.g., Inada et al., 2003a), which identifies close separation (10) lens candidates as quasars with low probabilities of being well fit as a point source, an exponential disk or a de Vaucouleurs profile. The second is the new algorithm introduced by Oguri et al. (2006) that examines close pairs of objects (quasars); both candidates also satisfy the new morphological selection criteria. We note that SDSS J1406+6126 with (-band Point-Spread Function magnitude corrected for Galactic extinction) is slightly fainter than the magnitude limit we are using to construct our statistical lens sample (see Oguri et al., 2006).
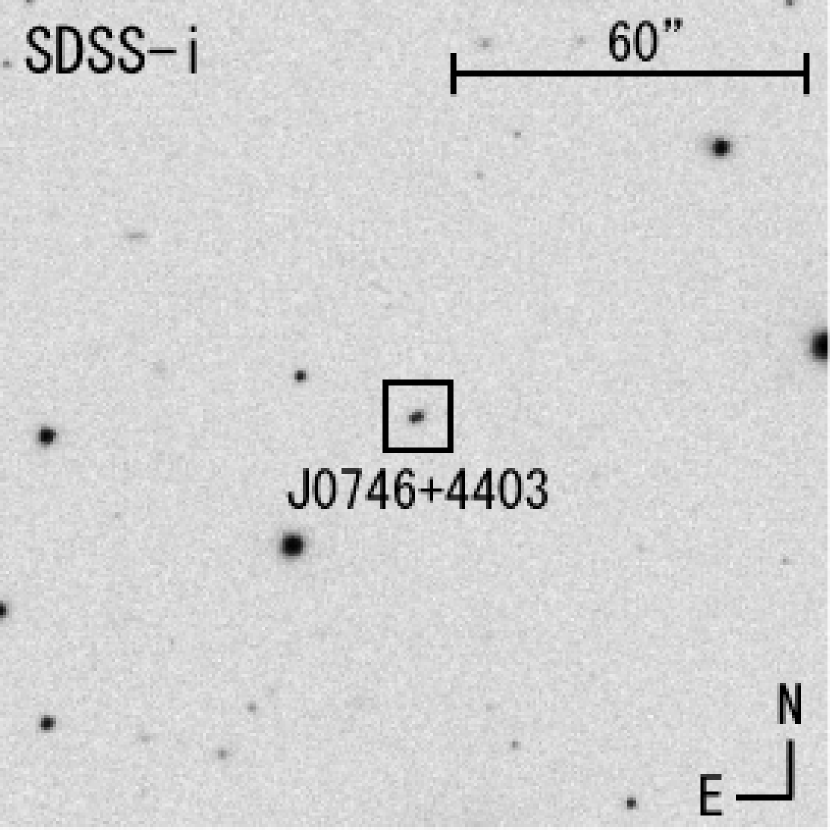
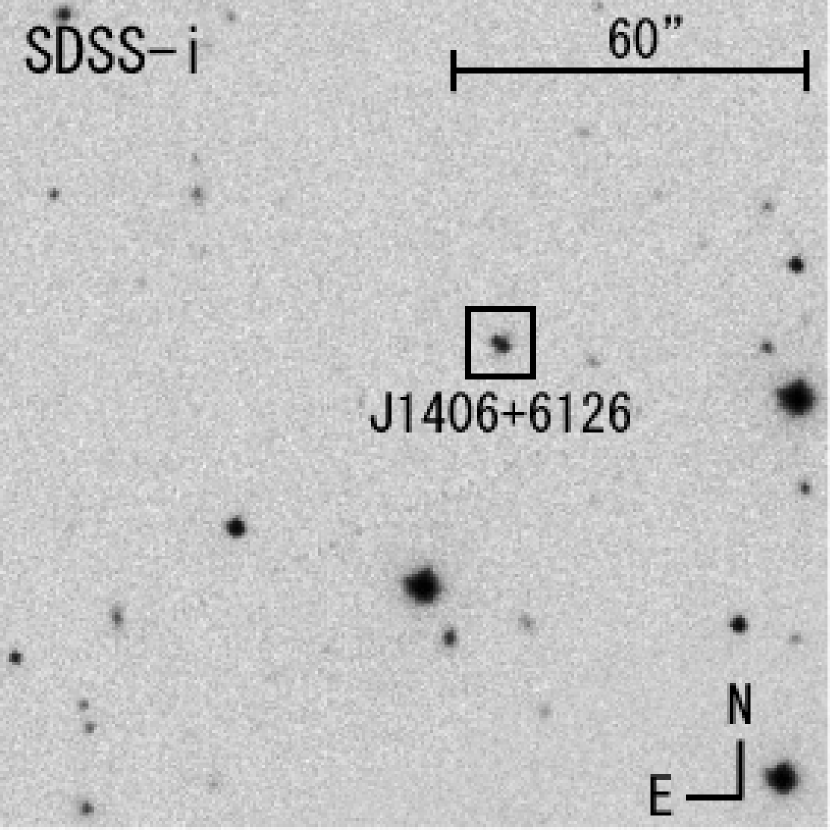
Figure 1 shows the SDSS -band images of SDSS J0746+4403 and SDSS J1406+6126. The total magnitudes inside a aperture radius (without Galactic extinction corrections) and the quasar redshifts from the SDSS imaging and spectroscopic data are summarized in Table 1. Both objects are marginally resolved in the SDSS imaging data and (spatially) unresolved in the SDSS spectroscopic data, thus additional observations were needed to confirm that they are indeed gravitationally lensed quasars.
3 Follow-Up Observations of SDSS J0746+4403
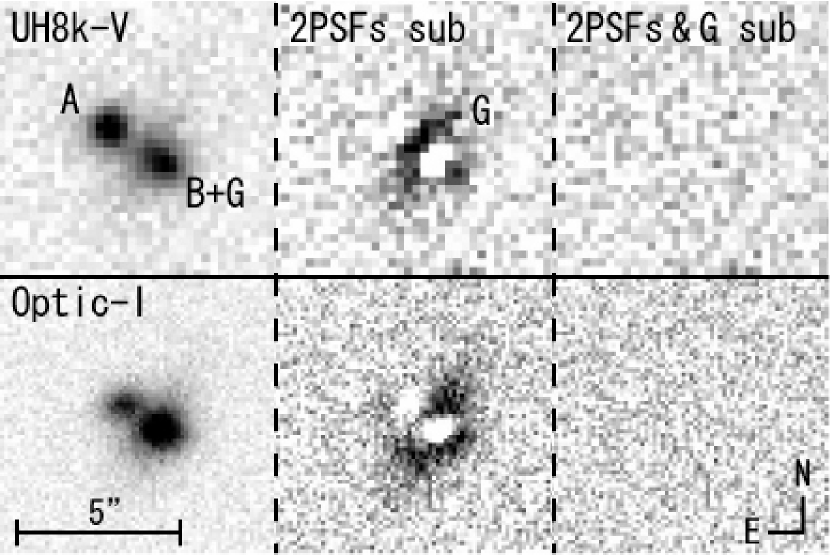
We obtained -, -, and -band images of SDSS J0746+4403 with the 8k mosaic CCD camera (UH8k, 0235 pixels) and the Orthogonal Parallel Transfer Imaging Camera (OPTIC, 0137 pixels) at the UH88 telescope. We also obtained a deep -band image with the Retractable Optical Camera for Monitoring (RETROCAM, 0259 pixels, Morgan et al., 2005) at the MDM 2.4-m telescope. The observations were conducted on 2004 December 14 (UH8k-, 07 seeing, 240 sec), 2004 December 16 (UH8k- and -, 08 seeing, 360 and 270 sec), 2006 February 23 (RETROCAM-, 10 seeing, 2700 sec), and 2006 May 3 (OPTIC-, 10 seeing, 300 sec). In all these images, which are shown in the left column of Figure 2, we observe two stellar components (denoted as A and B; A being the Eastern component) with a separation of . The middle column of Figure 2 shows the residuals after fitting the images using only two point spread functions (PSFs) constructed from nearby stars. In each case, there are significant, extended residual fluxes (named G), particularly in the redder bands. The most natural interpretation is that they come from a lens galaxy. The right column of Figure 2 shows the residuals after using GALFIT (Peng et al., 2002) to fit the data with two PSFs and an extended galaxy (modeled by a Sérsic profile) between them. With the addition of a galaxy, the residuals are indistinguishable from noise. A and B have very similar colors, while G has much redder colors (see Table 2) that are similar to those of an early-type galaxy at 0.2–0.5 (Fukugita et al., 1995). The predicted -band magnitude of mag for a lens galaxy at producing the observed separation (Rusin et al., 2003) agrees well with the observed magnitude of mag. The relative astrometry of the components (from the OPTIC -band image) and the absolute photometry for the UH8k -band observations are summarized in Table 2. The magnitudes are calibrated using the standard star PG 0231+051 (Landolt, 1992).
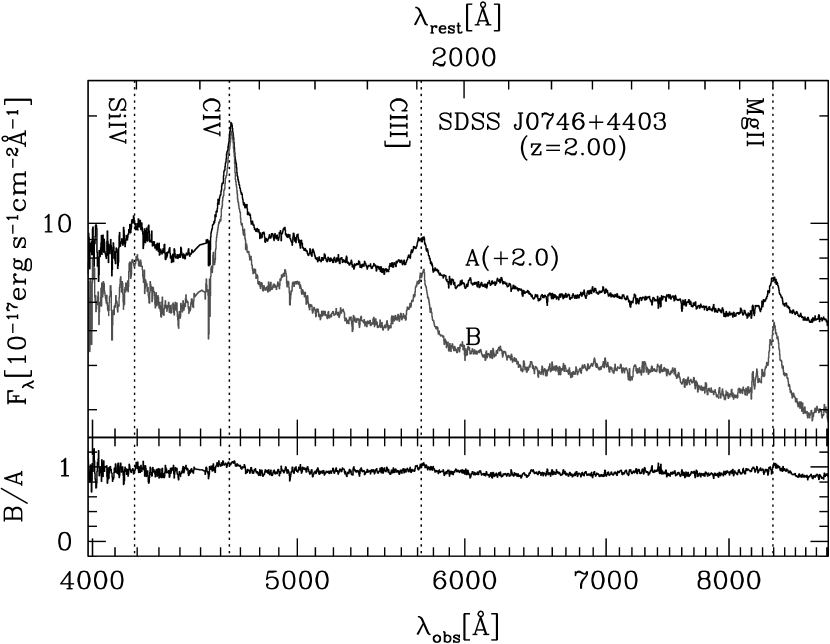
We obtained 1200 sec spectra of components A and B with the Echellette Spectrograph and Imager (ESI; Sutin, 1997; Sheinis et al., 2002) and the MIT-LL 20484096 CCD detector at the Keck II telescope on 2006 March 5 ( seeing). The wavelength coverage was 3900 Å to 11,000 Å with a spectral dispersion of Å pixel-1. The spatial sampling scale of the CCD detector is pixel-1 and we used a wide slit aligned to observe components A and B simultaneously. Since the spectra of the two components were well-separated in the spectral CCD image, we were able to extract the spectra of the two quasars using standard IRAF111IRAF is the Image Reduction and Analysis Facility, a general purpose software system for the reduction and analysis of astronomical data. IRAF is written and supported by the IRAF programming group at the National Optical Astronomy Observatories (NOAO) in Tucson, Arizona. NOAO is operated by the Association of Universities for Research in Astronomy (AURA), Inc. under cooperative agreement with the National Science Foundation tasks. We calibrated the spectra using the spectroscopic standard G191-B2B (Oke, 1990), and the telluric lines were corrected using a high resolution model of the absorption bands derived from ESI observations of standard stars. The binned spectra of components A and B, whose bad pixels and bad columns were corrected by liner interpolation, are shown in the upper panel of Figure 3, and the ratio of the spectra is shown in the lower panel. The spectral flux ratios of both the continuum and the Si IV, C IV, C III], and Mg II emission lines are remarkably similar, with an overall flux ratio of . As reported in Table 3, the quasar redshifts and emission line-widths are consistent with the hypothesis that the spectra are identical.
4 Follow-Up Observations of SDSS J1406+6126
Since it was obvious that a galaxy is associated with the quasar SDSS J1406+6126 even in the SDSS images, we acquired a short 90 sec exposure UH8k -band image on 2005 May 7 (08 seeing) in order to see if there are multiple stellar (quasar) images. As shown in the upper left panel of Figure 4, it turned out that the object consists of two stellar components (named components A and B, with A being the brighter component) and an extended object (component G) between them. We obtained a deeper and higher spatial resolution -band image with the OPTIC camera on 2006 May 3 (10 seeing, 300 sec), which is also shown in the left column of Figure 4. We again find that the residuals using a fit consisting of only 2 PSFs are significant (the middle column of Figure 4), while a model consisting of two PSFs plus an extended component fits the images well (the right column of Figure 4). The observed color of component G () is also typical of an early-type galaxy at the spectroscopic redshift of that we discuss later in this section (Fukugita et al., 1995). The relative astrometry from the OPTIC -band image and the absolute photometry from the UH8k -band and OPTIC -band images for components A, B, and G are summarized in Table 4. The photometric calibration was done using the standard stars PG 1047+003 and PG 1633+099 (Landolt, 1992). The angular separation of components A and B is .
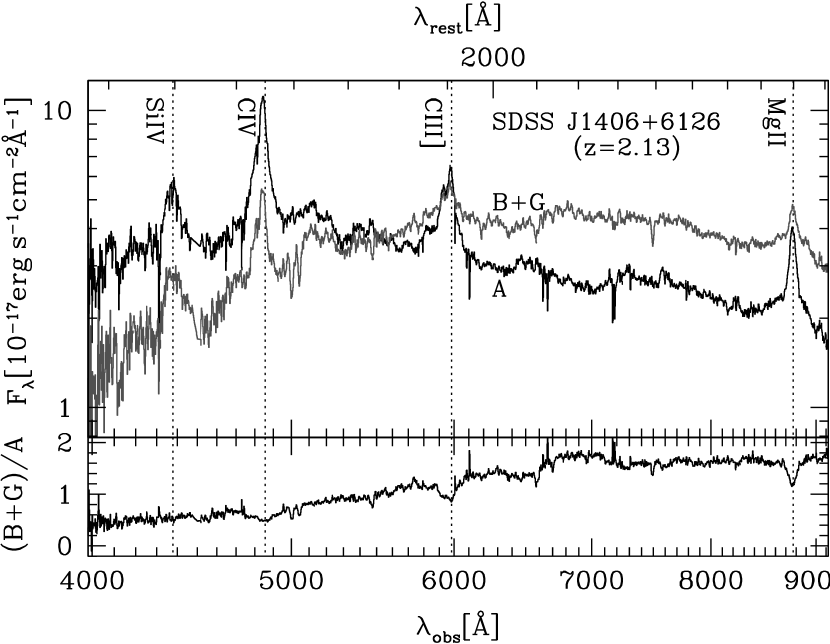
We obtained a 1200 sec spectrum of SDSS J1406+6126 on the same night the spectra of SDSS J0746+443 were acquired, using the same instrumental set up and observing method. Components B and G are too close to be separated, so we extracted spectra for components A and B+G. The binned and bad pixel (bad column) corrected spectra of component A and B+G are shown in Figure 5. The galaxy heavily contaminates the B+G spectrum, but component B is clearly a quasar at the same redshift as component A and with similar emission line widths (see Table 5). If we scale and subtract the spectrum of A from the spectrum of component B+G, we find a residual spectrum corresponding to an early-type galaxy at , as shown in Figure 6. If we correct the B+G spectrum for the emission from the lens galaxy, the flux ratio of the A and B spectra shows little wavelength dependence.
There are two interesting Mg II absorption systems in the spectra of SDSS J1406+6126. There is an absorption system at (4730 Å) with a Mg II rest frame equivalent width (REWMgII) of 1.3 Å in the spectrum of component A that is absent (REW) from the spectrum of component B. A second system at (7150 Å) has the REWMgII of 1.3 Å in component A but only 0.3 Å in component B. These large equivalent width differences are occurring on scales222We used the formulae quoted in Smette et al. (1992) to calculate the proper separation between the lensed quasar images. of only (for ) and (for ), respectively. Such large fractional changes have been seen only for weak absorption systems (REWMgII Å), as shown in Figure 10 of Ellison et al. (2004). Large REWMgII variations on kpc scales in strong intervening absorption systems, like those we have found in the SDSS J1406+6126 spectra, could indicate a range of size scales for such absorption systems or could be just rare outliers.
5 Lens Models
The follow-up data strongly supports the hypothesis that both objects are two-image gravitational lenses. To do our final test that the hypothesis is reasonable, we modeled both systems using a standard mass model consisting of a Singular Isothermal Sphere (SIS) with an external shear. The models have just as many parameters (the Einstein radius , the shear and its position angle , the position of the lens galaxy, and the position and flux of the source quasar) as the data supplies constraints (the 3 component positions and the 2 quasar fluxes), so the number of degrees of freedom is zero. Thus we expect the mass model to be able to fit the data perfectly, and the only check on the models is the degree to which the parameters are physically reasonable. We adopt the relative positions and -band flux ratios from Table 2 and Table 4 as constraints.
We use the lensmodel software (Keeton, 2001) to fit the models, and the parameters of the best-fitting models () and their 1 () errors are summarized in Table 6. The external shears of required to fit the data are typical for lensed quasars (e.g., Oguri et al., 2005; Inada et al., 2006a). The predicted time delays and total magnifications are 3 days and for SDSS J0746+4403, and 20 days and for SDSS J1406+6126.
6 Summary
We have discovered two new lensed quasars in the SDSS: SDSS J0746+4403 and SDSS J1406+6126. SDSS J0746+4403 is a two-image lens () formed from a quasar by a foreground galaxy at . The redshift of the lens galaxy was estimated from its colors and -band magnitude. SDSS J1406+6126 is a two-image lens () formed from a quasar by a spectroscopically confirmed lens galaxy at . Both lenses have properties that are easily reproduced by standard lens models with reasonable parameters. SDSS J0746+4403 is particularly important because it will be included in the well-defined statistical sample of the SQLS that we plan to use to constrain the cosmological model. SDSS J1406+6126 is slightly fainter than our magnitude limit for the statistical sample, but the relatively large image separation and the bright lens galaxy should make it a useful lens for studying the structure of early-type galaxies. A particularly interesting feature of SDSS J1406+6126 is that it has two strong Mg II absorption line systems that show dramatic changes on the few kpc scales of the path separations, which could provide an useful insight into the size distribution of absorption systems. Spectroscopy to measure the redshifts and velocity dispersions of the lens galaxies, high-resolution imaging to determine the structures of the lens galaxies, and measurements of the time delays are the next steps towards using these lenses to study the structure and evolution of galaxies.
References
- Abazajian et al. (2003) Abazajian, K., et al. 2003, AJ, 126, 2081
- Abazajian et al. (2004) Abazajian, K., et al. 2004, AJ, 128, 502
- Abazajian et al. (2005) Abazajian, K., et al. 2005, AJ, 129, 1755
- Adelman-McCarthy (2006) Adelman-McCarthy, J. K., et al. 2006, ApJS, 162, 38
- Bade et al. (1997) Bade, N., Siebert, J., Lopez, S., Voges, W., & Reimers, D. 1997, A&A, 317, L13
- Blanton et al. (2003) Blanton, M. R., Lin, H., Lupton, R. H., Maley, F. M., Young, N., Zehavi, I., & Loveday, J. 2003, AJ, 125, 2276
- Browne et al. (2003) Browne, I. W. A., et al. 2003, MNRAS, 341, 13
- Burles et al. (2006) Burles, S., et al. 2005, AJ, in preparation
- Chae et al. (2002) Chae, K.-H., et al. 2002, Phys. Rev. Lett., 89, 151301
- Chang & Refsdal (1984) Chang, K., & Refsdal, S. 1984, A&A, 132, 168
- Eisenstein et al. (2001) Eisenstein, D. J., et al. 2001, AJ, 122, 2267
- Ellison et al. (2004) Ellison, S. L., Ibata, R., Pettini, M., Lewis, G. F., Aracil, B., Petitjean, P., & Srianand, R. 2004, A&A, 414, 79
- Fukugita et al. (1990) Fukugita, M., Futamase, T., & Kasai, M. 1990, MNRAS, 246, 24
- Fukugita et al. (1996) Fukugita, M., Ichikawa, T., Gunn, J. E., Doi, M., Shimasaku, K., & Schneider, D. P. 1996, AJ, 111, 1748
- Fukugita et al. (1995) Fukugita, M., Shimasaku, K., & Ichikawa, T. 1995, PASP, 107, 945
- Gunn et al. (1998) Gunn, J. E., et al. 1998, AJ, 116, 3040
- Gunn et al. (2006) Gunn, J. E., et al. 2006, AJ, 131, 2332
- Hogg et al. (2001) Hogg, D. W., Finkbeiner, D. P., Schlegel, D. J., & Gunn, J. E. 2001, AJ, 122, 2129
- Inada et al. (2003a) Inada, N., et al. 2003a, AJ, 126, 666
- Inada et al. (2003b) Inada, N., et al. 2003b, AJ, submitted
- Inada et al. (2003c) Inada, N., et al. 2003c, Nature, 426, 810
- Inada et al. (2005) Inada, N., et al. 2005, AJ, 130, 1967
- Inada et al. (2006a) Inada, N. et al. 2006a, AJ, 131, 1934
- Inada et al. (2006b) Inada, N. et al. 2006b, AJ, in preparation
- Ivezić et al. (2004) Ivezić, Ž., et al. 2004, AN, 325, 583
- Johnston et al. (2003) Johnston, D. E., et al. 2003, AJ, 126, 2281
- Kayo et al. (2006) Kayo, I., et al. 2006, AJ, in preparation
- Keeton (2001) Keeton, C. R. 2001b, preprint (astro-ph/0102340)
- Kochanek (2006) Kochanek, C.S., 2006, in Gravitational Lensing: Strong Weak and Micro, Saas-Fee Advanced Course 33, G. Meylan, P. North, P. Jetzer, eds., (Springer: Berlin) 91 (astro-ph/0407232)
- Kochanek (1991) Kochanek, C. S. 1991, ApJ, 373, 354
- Landolt (1992) Landolt, A. U. 1992, AJ, 104, 340
- Lupton et al. (1999) Lupton, R. H., Gunn, J. E., & Szalay, A. S. 1999, AJ, 118, 1406
- Lupton et al. (2001) Lupton, R., Gunn, J. E., Ivezić, Z., Knapp, G. R., Kent, S., & Yasuda, N. 2001, in ASP Conf. Ser. 238, Astronomical Data Analysis Software and Systems X, ed. F. R. Harnden, Jr., F. A. Primini, and H. E. Payne (San Francisco: Astr. Soc. Pac.), p. 269 (astro-ph/0101420)
- Lupton (2005) Lupton, R. 2005, AJ, submitted
- Magain et al. (1988) Magain, P., Surdej, J., Swings, J.-P., Borgeest, U., & Kayser, R 1988, Nature, 334, 325
- Mao & Schneider (1998) Mao, S., & Schneider, P. 1998, MNRAS, 295, 587
- Mitchell et al. (2005) Mitchell, J. L., Keeton, C. R., Frieman, J. A., & Sheth R. K. 2005, ApJ, 622, 81
- Morgan et al. (2001) Morgan, N. D., Becker, R. H., Gregg, M. D., Schechter, P. L., & White, R. L. 2001, AJ, 121, 611
- Morgan et al. (2003) Morgan, N. D., Snyder, J. A., & Reens, L. H. 2003, AJ, 126, 2145
- Morgan et al. (2005) Morgan, C. W., Byard, P. L., DePoy, D. L., Derwent, M., Kochanek, C. S., Marshall, J. L., O’Brien, T. P., Pogge, R. W. 2005, AJ, 129, 2504
- Morokuma et al. (2006) Morokuma, T., et al. 2006, AJ, submitted
- Myers et al. (2003) Myers, S. T., et al. 2003, MNRAS, 341, 1
- Narayan & White (1998) Narayan, R., & White, S. D. M. 1988, MNRAS, 231, 97
- Oguri et al. (2004a) Oguri, M., et al. 2004a, ApJ, 605, 78
- Oguri & Keeton (2004b) Oguri, M., & Keeton, C. R. 2004b, ApJ, 610, 663
- Oguri et al. (2004c) Oguri, M., et al. 2004c, PASJ, 56, 399
- Oguri et al. (2005) Oguri, M., et al. 2005, ApJ, 622, 106
- Oguri et al. (2006) Oguri, M., et al. 2006, AJ, 132, 999
- Oke (1990) Oke, J. B. 1990, AJ, 99, 1621
- Oscoz et al. (1997) Oscoz, A., Serra-Ricart, M., Mediavilla, E., Buitrago, J., & Goicoechea, L. J. 1997, AJ, 491, L7
- Peng et al. (2002) Peng, C. Y., Ho, L. C., Impey, C. D., & Rix, H.-W. 2002, AJ, 124, 266
- Pier et al. (2003) Pier, J. R., Munn, J. A., Hindsley, R. B., Hennessy, G. S., Kent, S. M., Lupton, R. H., & Ivezić, Ź. 2003, AJ, 125, 1559
- Pindor et al. (2004) Pindor, B., et al. 2004, AJ, 127, 1318
- Pindor et al. (2005) Pindor, B., et al. 2005, AJ, 131, 41
- Refsdal (1964) Refsdal, S. 1964, MNRAS, 128, 307
- Richards et al. (2002) Richards, G. T., et al. 2002, AJ, 123, 2945
- Rusin et al. (2003) Rusin, D, et al. 2003, ApJ, 587, 143
- Schechter et al. (1998) Schechter, P. L., Gregg, M. D., Becker, R. H., Helfand, D. J., & White, R. L. 1998, AJ, 115, 1371
- Schneider et al. (2005) Schneider, D. P., et al. 2005, AJ, 130, 367
- Schneider et al. (2006) Schneider, D. P., et al. 2006, AJ, in preparation
- Sheinis et al. (2002) Sheinis, A. I., Bolte, M., Epps, H. W., Kibrick, R. I., Miller, J. S., Radovan, M. V., Bigelow, B. C., & Sutin, B. M. 2002, PASP, 114, 851
- Smette et al. (1992) Smette, A., Surdej, J., Shaver, P. A., Foltz, C. B., Chaffee, F. H., Weymann, R. J., Williams, R. E., & Magain, P. 1992, ApJ, 389, 39
- Smith et al. (2002) Smith, J. A., et al. 2002, AJ, 123, 2121
- Spergel et al. (2003) Spergel, D. N., et al. 2003, ApJS, 148, 175
- Stoughton et al. (2002) Stoughton, C., et al. 2002, AJ, 123, 485
- Strauss et al. (2002) Strauss, M. A., et al. 2002, AJ, 124, 1810
- Surdej et al. (1987) Surdej, J., Swings, J.-P., Magain, P., Courvoisier, T. J.-L., & Borgeest, U. 1987, Nature, 329, 695
- Sutin (1997) Sutin, B. M. 1997, Proc. SIPE, 2871, 1116
- Tucker et al. (2006) Tucker, D. L., et al. 2006, AN, in press
- Turner (1990) Turner, E. L. 1990, ApJ, 365, L43
- Turner et al. (1984) Turner, E. L., Ostriker, J. P., & Gott, J. R., III 1984, ApJ, 284, 1
- Walsh et al. (1979) Walsh, D., Carswell, R. F., & Weymann, R. J. 1979, Nature, 279, 381
- Weymann et al. (1980) Weymann, R. J., et al. 1980, Nature, 285, 641
- Williams & Saha (2004) Williams, L. L. R., & Saha, P. 2004, AJ, 128, 2631
- York et al. (2000) York, D. G., et al. 2000, AJ, 120, 1579
![[Uncaptioned image]](/html/astro-ph/0609696/assets/x3.png)

| Object | aatotal magnitudes inside a aperture radius and without Galactic extinction corrections from the SDSS data. | aatotal magnitudes inside a aperture radius and without Galactic extinction corrections from the SDSS data. | aatotal magnitudes inside a aperture radius and without Galactic extinction corrections from the SDSS data. | aatotal magnitudes inside a aperture radius and without Galactic extinction corrections from the SDSS data. | aatotal magnitudes inside a aperture radius and without Galactic extinction corrections from the SDSS data. | Redshiftbbquasar redshifts from the SDSS spectra. |
|---|---|---|---|---|---|---|
| SDSS J0746+4403 | 18.830.03 | 18.740.01 | 18.700.02 | 18.410.02 | 18.200.06 | 1.9980.002 |
| SDSS J1406+6126 | 19.700.07 | 19.370.06 | 19.210.14 | 19.110.18 | 18.780.22 | 2.1340.002 |
| Component | X (arcsec)aaMeasured in the OPTIC -band image using GALFIT. The positive directions of X and Y are defined by east and north, respectively. The celestial coordinates of component A are R.A. and Decl. (J2000). | Y (arcsec)aaMeasured in the OPTIC -band image using GALFIT. The positive directions of X and Y are defined by east and north, respectively. The celestial coordinates of component A are R.A. and Decl. (J2000). | bbMeasured in the UH8k -band images using GALFIT. The errors do not include the photometric uncertainty of the standard star. | bbMeasured in the UH8k -band images using GALFIT. The errors do not include the photometric uncertainty of the standard star. | bbMeasured in the UH8k -band images using GALFIT. The errors do not include the photometric uncertainty of the standard star. |
|---|---|---|---|---|---|
| A | 0.0000.003 | 0.0000.003 | 19.870.01 | 19.530.01 | 19.080.01 |
| B | 0.9330.004 | 0.5410.004 | 19.970.05 | 19.550.02 | 19.110.01 |
| G | 0.5970.041 | 0.2010.041 | 21.571.00 | 20.650.05 | 19.620.19 |
| Component A | Component B | ||||||
|---|---|---|---|---|---|---|---|
| Line( Å) | ( Å) | FWHM( Å) | Redshift | ( Å) | FWHM( Å) | Redshift | |
| Si IV (1396.76) | 4196.90 | 107.5 | 2.00470.0015 | 4197.36 | 94.3 | 2.00510.0008 | |
| C IV (1549.06) | 4654.18 | 95.8 | 2.00450.0004 | 4654.32 | 96.7 | 2.00460.0002 | |
| C III] (1908.73) | 5725.77 | 119.2 | 1.99980.0009 | 5726.97 | 113.3 | 2.00040.0006 | |
| Mg II (2798.75) | 8402.93 | 155.7 | 2.00240.0005 | 8403.06 | 166.5 | 2.00240.0007 | |
| Object | X (arcsec)aaMeasured in the OPTIC -band image using GALFIT. The positive directions of X and Y are defined by east and north, respectively. The celestial coordinates of component A are R.A. and Decl. (J2000). | Y (arcsec)aaMeasured in the OPTIC -band image using GALFIT. The positive directions of X and Y are defined by east and north, respectively. The celestial coordinates of component A are R.A. and Decl. (J2000). | bbMeasured in the UH8k -band image and OPTIC -band image using GALFIT. The errors do not include the photometric uncertainty of the standard star. | bbMeasured in the UH8k -band image and OPTIC -band image using GALFIT. The errors do not include the photometric uncertainty of the standard star. |
|---|---|---|---|---|
| A | 0.0000.004 | 0.0000.004 | 19.990.01 | 19.380.01 |
| B | 1.6390.007 | 1.1030.007 | 20.600.03 | 19.970.04 |
| G | 1.1430.006 | 0.7270.006 | 19.860.07 | 18.120.02 |
| Component A | Component B | ||||||
|---|---|---|---|---|---|---|---|
| Line( Å) | ( Å) | FWHM( Å) | Redshift | ( Å) | FWHM( Å) | Redshift | |
| Si IV(1396.76) | 4376.51 | 90.6 | 2.13330.0009 | 4377.14 | 95.7 | 2.13380.0009 | |
| C IV(1549.06) | 4842.11 | 73.9 | 2.12580.0004 | 4841.59 | 63.2 | 2.12550.0005 | |
| C III](1908.73) | 5975.09 | 73.6 | 2.13040.0005 | 5974.41 | 69.5 | 2.13000.0012 | |
| Mg II(2798.75) | 8766.79 | 83.4 | 2.13240.0004 | 8767.50 | 97.4 | 2.13260.0008 | |
| Object | (′′) | aaEach position angle is measured East of North. | [day] | ccPredicted total magnification. | |
|---|---|---|---|---|---|
| SDSS J0746+4403 | 0.01 | 0.025 | 5.7 | bbThe lens galaxy redshift of SDSS J0746+4403 is assumed to be . | 13.2 |
| SDSS J1406+6126 | 0.01 | 0.008 | 5.5 | 5.2 |