High-energy particles in the wind nebula of pulsar B1509-58 as seen by INTEGRAL
Abstract
We present observations with the INTEGRAL/IBIS telescope of the wind nebula powered by the young pulsar B1509-58 and we discuss the spatial and spectral properties of the unpulsed emission in the keV energy band. The source extension and orientation along the northwest-southeast axis corresponds to the jet emission seen at keV and TeV energies. The hard X-ray spectrum is consistent with the earlier Beppo-SAX measurements. It follows a power law with a photon index up to keV. A possible break at this energy is found at the confidence level. The 0.1-100 keV data are consistent with synchrotron aging of pairs in the jet and yield a magnetic field strength of 22-33 G for a bulk velocity of 0.3-0.5c. The synchrotron cut-off energy thus corresponds to a maximum electron energy of 400-730 TeV.
Subject headings:
acceleration of particles – gamma rays: observations – shock waves – pulsars: individual(PSR B1509)1. Introduction
The young radio pulsar B1509-58 is associated with the supernova remnant MSH 15-52 (G320.4-1.2) (Seward & Harnden, 1982; Manchester et al., 1982). Its spin parameters (a period of ms and period derivative of s s-1) make it one of the youngest and most energetic pulsars known, with a characteristic age yr and a spin-down power of ergs s-1. It presents one of the largest magnetic field strength ( G) (Kaspi et al., 1994) recorded for an isolated pulsar. Recent X-ray and -ray images have revealed a very complex pulsar environment where one can study several manifestations of pulsar wind nebulae: the shocked wind in an equatorial flow, a powerful jet, and the interaction and confinement of these wind features within the surrounding remnant.
ROSAT first detected the wind nebula in X rays, showing its 17’-long tail extending to the southeast along a faint ridge of radio emission (Greiveldinger & Ogelman, 1993; Trussoni et al., 1996), later confirmed by BeppoSAX. The tail length decreases from 17’ to 8.5’ (at 10 level of the central nebula intensity) between 1.6 keV and 10.0 keV (Mineo et al., 2001). High-resolution Chandra images revealed further details of the non-thermal structure (Gaensler et al., 2002); first, the axis of the elongated nebula (with a position angle of north through east) which may correspond to the pulsar spin axis; then two northern toroidal arcs of emission, 17” and 30” away from the pulsar, that may correspond to wisps in an ion-loaded equatorial flow as in the Crab nebula; and a 4’-long bright collimated feature along the axis which is interpreted as a jet with a velocity (Gaensler et al., 2002; Tamura et al., 1996; Brazier & Becker, 1997). The apparent absence of a counterjet sets a lower limit of 5 to the brightness ratio between the two sides (if two jets are powered). Doppler boosting can account for this contrast provided that the jet bulk velocity and its inclination to the line of sight verify . The wind carries away at least of the pulsar spin down power.
The emission found by H.E.S.S between GeV and TeV presents a comparable morphology (Aharonian et al., 2005). The elongated nebula extends on both sides of the pulsar along the X-ray axis, over 6’ (1 level) to the northwest and southeast direction. The -ray spectrum is well fitted by an power law and can be explained by TeV electrons up-scattering the cosmological microwave background and the ambient interstellar radiation field. Fitting both the TeV emission and the BeppoSAX one gives a mean magnetic field of G which is in agreement with lower limits found for the jet in the equipartition assumption (DeLaney et al., 2006). At a distance of kpc (Gaensler et al., 1999), the bright part of the X-ray jet, the longer southeast X-ray tail, and the coincident TeV one extend from 5 to 30 pc on the sky.
We present observations of the PSR B1509-58 region obtained with the INTEGRAL/IBIS telescope operating in the hard X-ray range, describing the morphology and spectral properties of the emission and comparing them with the X-ray and TeV data.
2. Observation and data analysis
PSR B1509-58 was observed with the IBIS coded aperture telescope onboard the INTEGRAL spacecraft. It consists of a dual detection layer operating between and , and of a tungstene coded mask located 3.2m above the detector. The first and pixelized detector plane, ISGRI, is composed of by Cadmium–Telluride (CdTe) semiconductor detectors covering the energy range from to (Lebrun et al., 2003). Sky images are obtained by deconvolution of the ISGRI image by the mask pattern. The resulting angular resolution is ().
The exposure time of about Ms corresponds to dedicated observations centered on PSR B1509-58 in 2005, and of Galactic Plane Scan (GPS) observations from to . It consists of more than 700 science windows of about 30 mn each. The analysis was done with the standard INTEGRAL OSA software (version 5.1).
2.1. Phase resolved analysis
In order to study the pulsar wind from PSR B1509-58 and to reduce contamination by pulsed emission from within the light cylinder, we have analyzed the data from the off-pulse phase interval. To extract the light curve, the photon UTC arrival times were converted into the solar system barycentre using the pulsar position. Photons were then folded into phase bins using the ATNF ephemerides 111. In each phase bin sky images were obtained from standard deconvolution of ISGRI detector maps. This method provides an automatically background subtraction and the unpulsed emission is thus clearly visible.
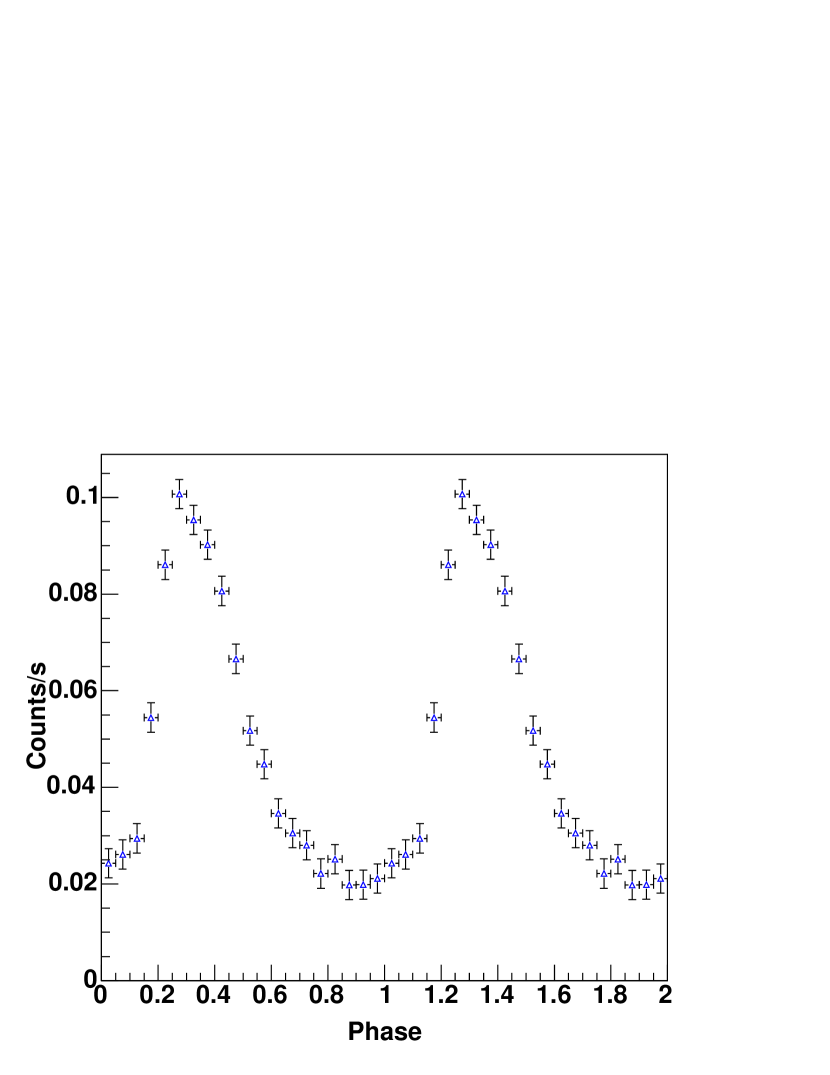
The resulting light curve is presented in Figure 1. A significant unpulsed component is clearly seen in the phase interval similar to the ones found by BeppoSAX (Cusumano et al., 2001) that will be used for the following imaging and spectral analyzes. A detailed study of the pulsed emission is deferred to another paper (Hermsen et al., in preparation).
2.2. Imaging extended sources with the IBIS/ISGRI telescope
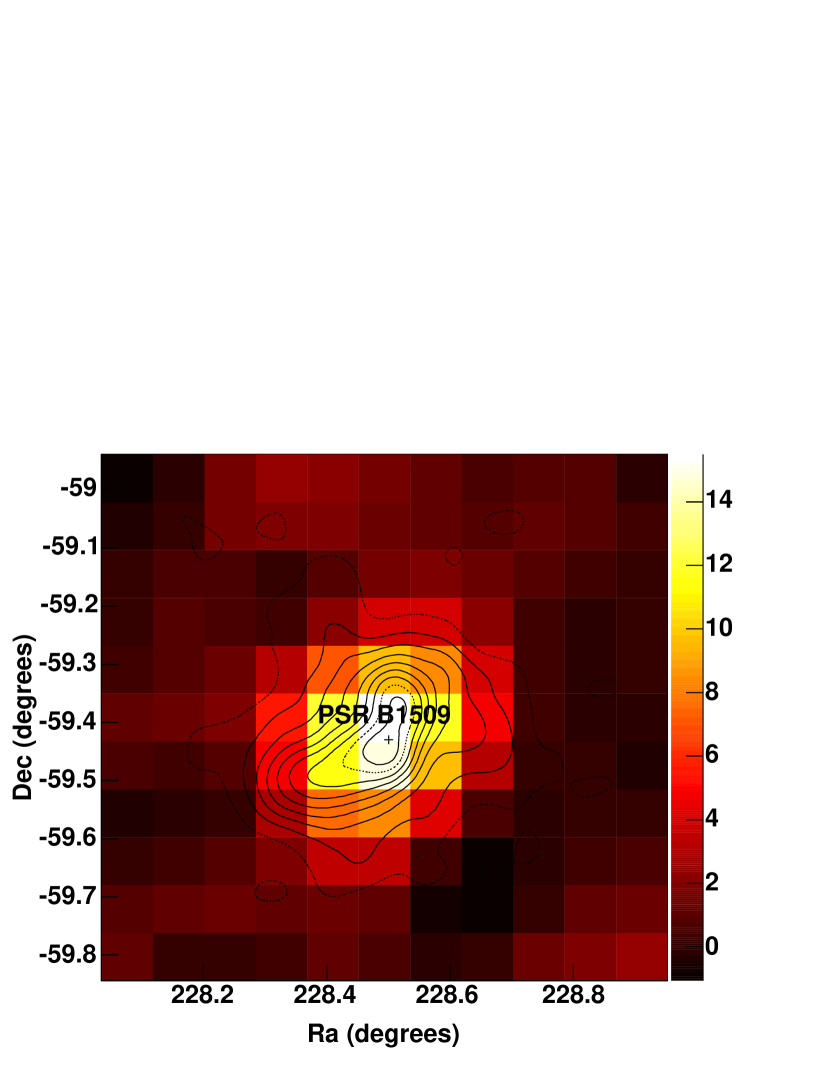
As shown in Figure 2, the source detected with IBIS/ISGRI in the off-pulse emission (17-40 keV) appears to be slightly extended. In the standard OSA software, the flux of a point-source is given by the peak height of the associated Point Spread Function (Gros et al., 2003). This is, however, incorrect for an extended source because of the flux dilution over a region larger than the PSF width. A method has been developed for extracting the flux and its associated error of an extended source seen by IBIS and more generally by any coded mask telescope using the MURA pattern (Renaud et al., 2006). This method converts standard flux images into intensity images (ie flux per sky pixel or per steradian). The total flux is estimated by summing intensities over the whole source extent. The dilution factor will be defined as the ratio between the real flux and the one given by the standard INTEGRAL software. This factor depends on the source size.
3. Results
3.1. Imaging : an extended source around PSR B1509-58
Maps of the off-pulse emission have been constructed in two energy ranges, at and keV. The significance map in the low-energy band is presented in Figure 2. A bright source is clearly visible at the position of PSR B1509-58. It is centered on RA and DEC and it is fully consistent with the pulsar location. Figure 3 shows the source radial profile along the NW-SE axis in the significance map, together with the profile expected from a point source. The source appears to be slightly extended and its orientation coincides with the morphology known at other wavelengths.
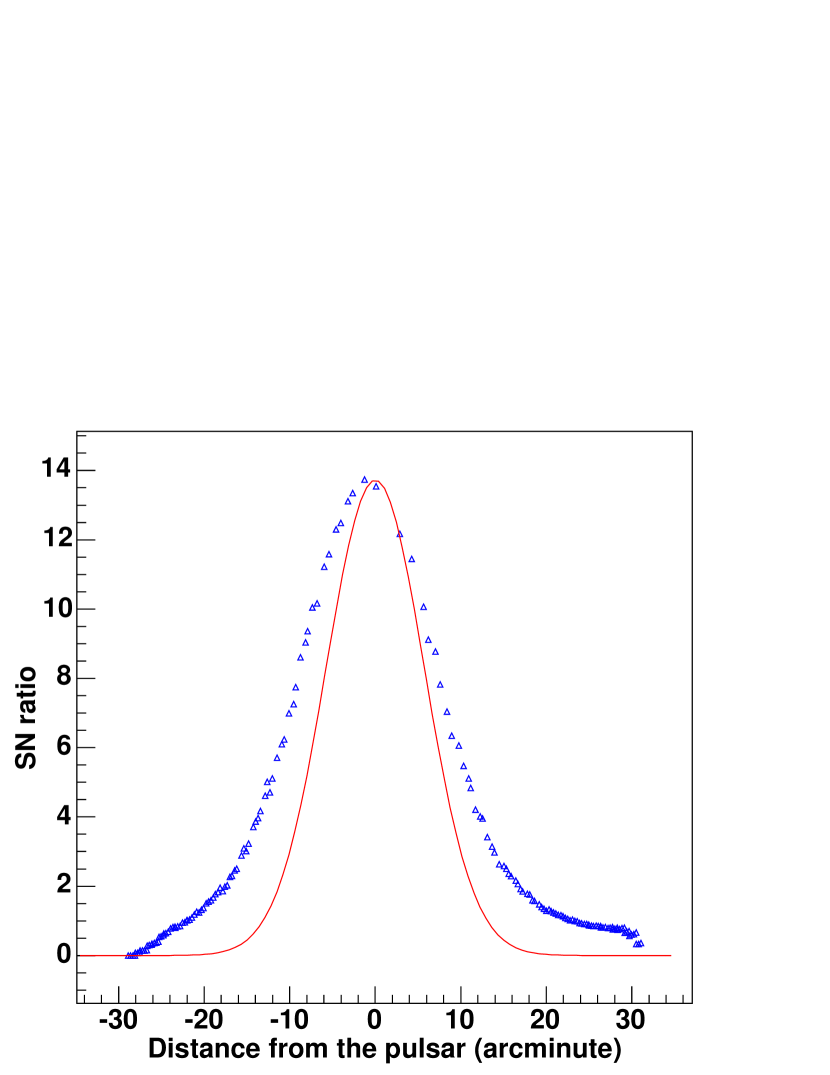
With coded mask imaging, sky image pixels are not statistically independent, but two pixels separated by more than the PSF width ( ) can be considered as independent. After subtracting the PSF in the significance map (see Figure 4) we obtain a confidence level of and in the low and high-energy bands from the two residuals measured along the NW-SE axis.
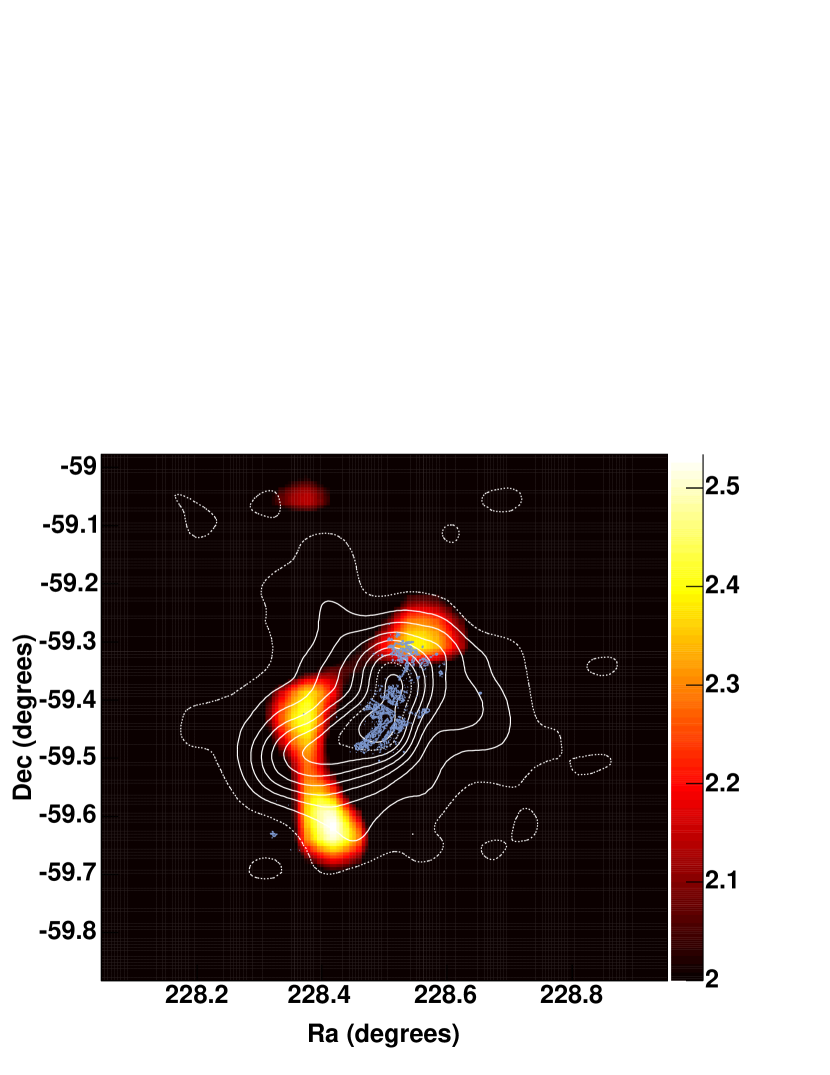
The source orientation and extension can be evaluated by fitting the intensity images with a 2D Gaussian with separate widths along each axis and a free rotation angle. To compare with a true point-source the same fit has been applied to the XTE J1550 source in the same field of view.
In the low-energy band, XTE J1550 is well fitted by a symmetrical Gaussian of width . It is fully consistent with the instrument PSF . For PSR B1509-58, the best fit yields an asymmetric Gaussian with a rotation angle of from north through east. Perpendicular to this axis, the source width of is equivalent to that of a point source. Along the NW-SE direction, the width suggests that the source extends over several arcminutes. The apparent source width results from the convolution of the PSF and the true source size. The latter is found to be along the major axis. In the energy band from 40 to 100 keV, the source is smaller with along the main axis. All the quoted errors include the statistical uncertainty and a crude estimate of the impact of the map binning and correlation between adjacent pixels obtained by moving the gaussian location in the fit.
The fact that the source extension and orientation compare with the morphology seen in X rays and rays, as well as the increased brightness to the southeast, strongly suggest that the unpulsed emission is dominated by the wind nebula.
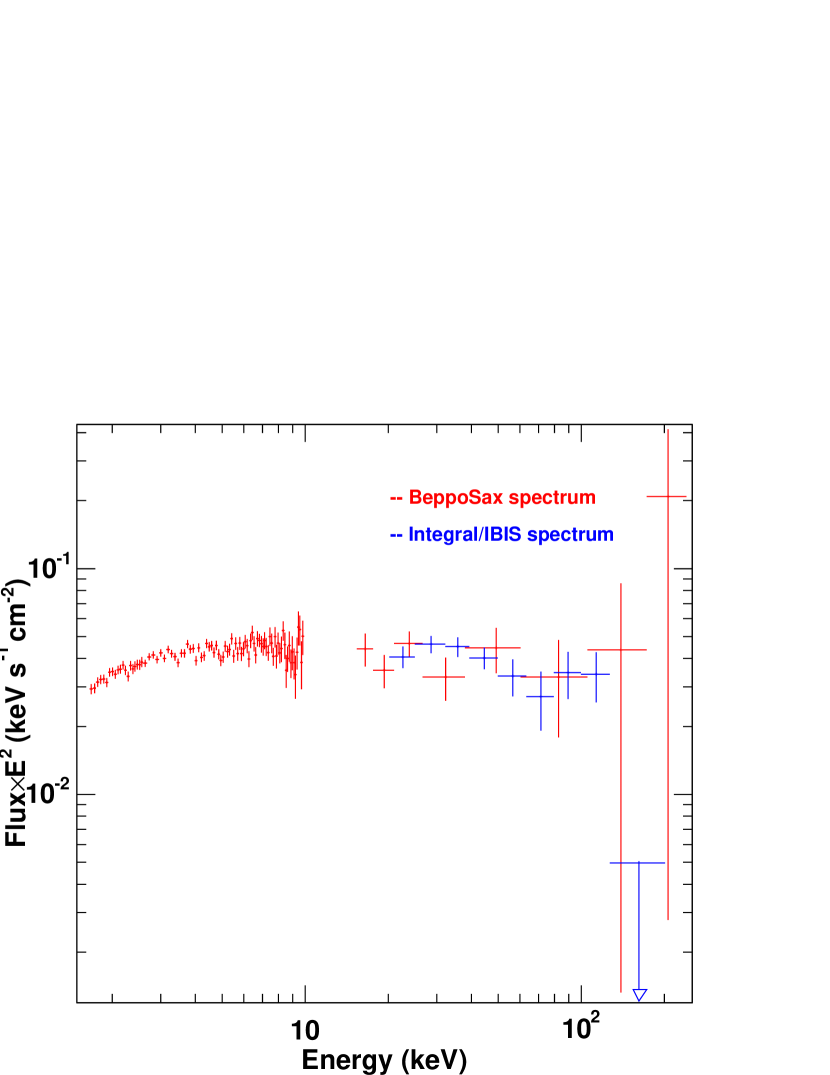
3.2. Spectroscopy : a possible spectral break near keV
The dilution correction factors due to the source extent with respect to a point source flux are respectively and in the low and high energy bands. Values at intermediate energies have been interpolated. The spectrum of the off-pulse emission has been measured from keV to keV using the standard spectral analysis, then divided by the selected phase width, and corrected for dilution as described above. It is presented in Figure 5 together with the former BeppoSAX measurements (Mineo et al., 2001). The INTEGRAL spectrum is well fitted by an power law in agreement with the BeppoSAX and RXTE results (Marsden et al., 1997). The total flux from 17 to 200 keV amounts to 0.30 0.02 keV cm-2 s-1. The upper limit found in the 130-200 keV bin suggests a spectral break near 160 keV. This upper limit indeed deviates at the 2.9 level from the extrapolation of the power-law spectrum in this energy interval. The break is not visible in the pulsed emission and so cannot be attributed to the pulsar. It is consistent with the Beppo-SAX measurements at high energy.
3.3. Discussion and conclusions
The extent and orientation of the unpulsed emission seen by INTEGRAL/IBIS nicely match the morphology of the wind nebula and jet seen at keV energies with ROSAT, Chandra, and BeppoSAX, and at TeV energies with H.E.S.S. The source width is not consistent with pure DC emission from the pulsar itself, although a large contribution cannot be ruled out. There is a close agreement between BeppoSAX and INTEGRAL in spectra an source elongation. All circumstantial evidence suggests that the measured hard X-ray emission is dominated by jet emission. The elongated source appears to be slightly brighter to the south, with a flux ratio of between the SE and NW sides. Larger contrasts are found in X rays () and in TeV rays (), but the difference may be due to the poorer angular resolution of ISGRI which cannot separate the central wind components from the larger scale jet. In the following discussion we will explore the consequences of a common origin of the 0.1-160 keV and TeV emissions in the collimated wind flow or jet along the NW-SE axis.
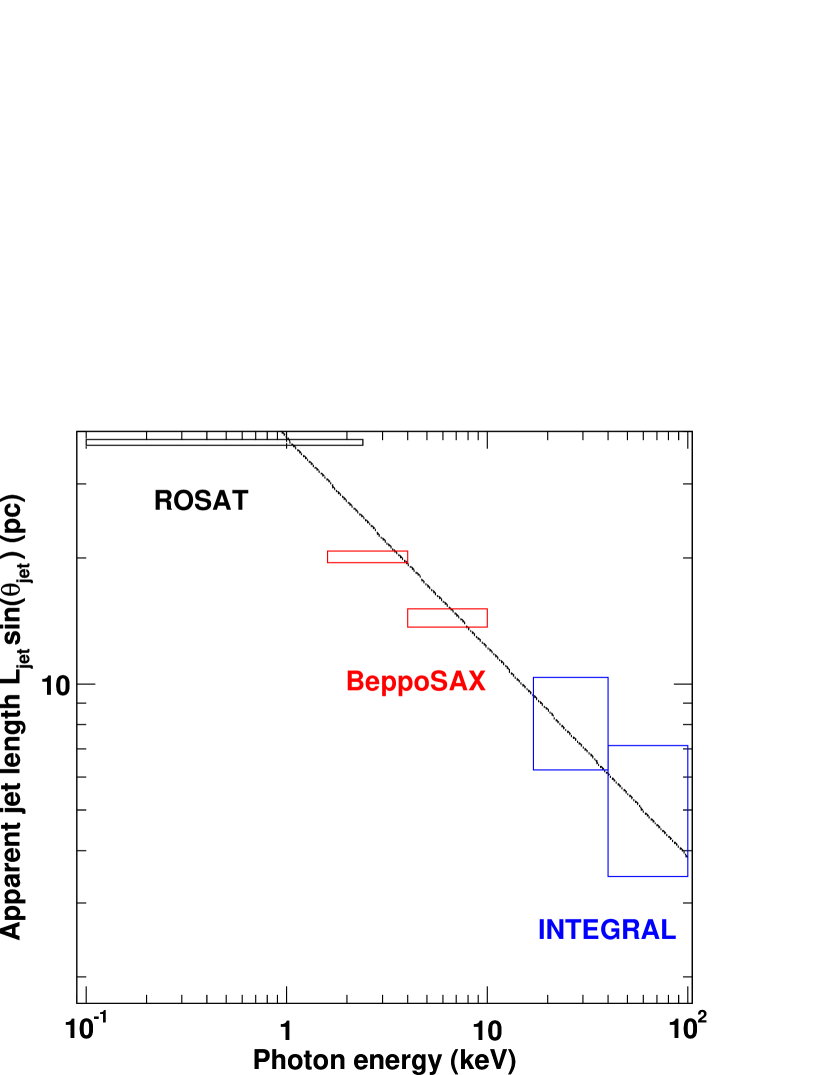
The relative energy fluxes recorded in X rays and TeV rays indicate that synchrotron losses dominate over inverse Compton ones (Aharonian et al., 2005). Figure 6 also suggests possible decrease of the jet apparent length, as seen by ROSAT (Trussoni et al., 1996), BeppoSAX (Mineo et al., 2001), and now IBIS. In a simple scenario with a linear jet with constant cross-section and velocity, thus with uniform magnetic field and density to conserve the magnetic and momentum fluxes, the maximum distance reached by the flow before the pairs burn off their energy scales as (Pacholczyk, 1970):
| (1) |
Figure 6 shows that the data are consistent with this simple dependence and that radiative aging is effective above keV energies. This aging is also consistent with the spectral turn-over seen in Figure 5. The best fit to the data in Figure 6 gives a measure of the product . The jet outflow has a typical velocity of 0.5c (DeLaney et al., 2006) equivalent to the speed observed in several other wind nebulae (Crab Nebula (0.4c), Vela (0.3c-0.7c), G11.2-0.3 (0.8-1.4c)). It is consistent with MHD simulations of relativistic jets (0.5c). A lower limit of 0.3c is inferred from the Doppler boosting constraint . For values of 0.3 and 0.5, we find field strengths of 22 and 33 , respectively. The large uncertainty in the pulsar distance implies an additional uncertainty in B. The spectral cut-off possibly seen at 160 keV then yields maximum electron energies in the jet of 400 and 730 TeV, respectively.
| (2) |
The field and maximum energy estimates given above would not apply if the high-energy part of the INTEGRAL source is dominated by the toroidal part of the wind instead of the jet as assumed above, because the rapid increase of the field strength to equipartition values in the post-shock flow would cool the particles more efficiently and the INTEGRAL data would not relate to the larger scale ROSAT and HESS observations.
Following a leptonic scenario and fitting both synchrotron and inverse Compton radiation, the HESS data yield a mean field of (Aharonian et al., 2005) in reasonable agreement with the above range. Increasing B to the above values would result in 2 or 3 times fewer particles in the modelled flow, but the inverse Compton TeV brightness could still be accomodated owing to the large uncertainty in the actual infra-red radiation field in the jet vicinity.
In summary, the comparison of the morphology of the wind nebula above keV with lower-energy data, and the observation of a possible cut-off near 160 keV are consistent with a simple jet scenario with efficient synchrotron cooling in a mean magnetic field of order and outflow velocities of 0.3-0.5c. The presence of electrons with still extreme energies of 400-730 TeV at several parsecs from the pulsar places a useful constraint on the unknown jet acceleration process.
References
- Aharonian et al. (2005) Aharonian, F., et al. 2005, A&A, 435, L17
- Brazier & Becker (1997) Brazier, K. T. S., & Becker, W. 1997, MNRAS, 284, 335
- Cusumano et al. (2001) Cusumano, G., Mineo, T., Massaro, E., Nicastro, L., Trussoni, E., Massaglia, S., Hermsen, W., & Kuiper, L. 2001, A&A, 375, 397
- DeLaney et al. (2006) DeLaney, T., Gaensler, B. M., Arons, J., & Pivovaroff, M. J. 2006, ApJ, 640, 929
- Gaensler et al. (1999) Gaensler, B. M., Brazier, K. T. S., Manchester, R. N., Johnston, S., & Green, A. J. 1999, MNRAS, 305, 724
- Gaensler et al. (2002) Gaensler, B. M., Arons, J., Kaspi, V. M., Pivovaroff, M. J., Kawai, N., & Tamura, K. 2002, ApJ, 569, 878
- Greiveldinger & Ogelman (1993) Greiveldinger, C., & Ogelman, H. B. 1993, Bulletin of the American Astronomical Society, 25, 1345
- Gros et al. (2003) Gros, A., et al. 2003, A&A, 411, L179
- Kaspi et al. (1994) Kaspi, V. M., Manchester, R. N., Siegman, B., Johnston, S., & Lyne, A. G. 1994, ApJ, 422, L83
- Lebrun et al. (2003) Lebrun, F., et al. 2003, A&A, 411, L141
- Manchester et al. (1982) Manchester, R. N., Tuohy, I. R., & Damico, N. 1982, ApJ, 262, L31
- Marsden et al. (1997) Marsden, D., et al. 1997, ApJ, 491, L39
- Mineo et al. (2001) Mineo, T., Cusumano, G., Maccarone, M. C., Massaglia, S., Massaro, E., & Trussoni, E. 2001, A&A, 380, 695
- Pacholczyk (1970) Pacholczyk, A. G. 1970, Series of Books in Astronomy and Astrophysics, San Francisco: Freeman, 1970,
- Renaud et al. (2006) Renaud, M., Lebrun, F., Terrier, R., et al. 2006, A&Ain press
- Seward & Harnden (1982) Seward, F. D., & Harnden, F. R. 1982, ApJ, 256, L45
- Tamura et al. (1996) Tamura, K., Kawai, N., Yoshida, A., & Brinkmann, W. 1996, PASJ, 48, L33
- Trussoni et al. (1996) Trussoni, E., Massaglia, S., Caucino, S., Brinkmann, W., & Aschenbach, B. 1996, A&A, 306, 581