The buildup of stellar mass of galaxies in clusters during the last two thirds of the universe age and associated methodological issues
Abstract
We have measured the 3.6 m luminosity and mass evolution of about 1000 galaxies in 32 clusters at with a special attention to methodological issues, as emphasized in this proceeding contribution. We find that the luminosity of our galaxies evolves as an old and passively evolving population formed at high redshift without any need for additional redshift-dependent evolution. Models with a prolonged stellar mass growth are rejected by the data with high confidence. The data also reject models in which the age of the stars is the same at all redshifts. Similarly, the characteristic stellar mass evolves, in the last two thirds of the universe age, as expected for a stellar population formed at high redshift. Together with the old age of stellar populations derived from fundamental plane studies, our data seems to suggest that massive early-type cluster galaxies have been completely assembled at high redshift, and not only that their stars are old. The quality of the data allows us to derive the LF and mass evolution homogeneously over the whole redshift range, using a single estimator. The Schechter function describes the galaxy luminosity function well. The characteristic luminosity at is found to be 16.30 mag, with an uncertainty of 10 per cent.
INAF-Osservatorio Astronomico di Brera, Milano, Italy
1. Introduction
The luminosity function (LF) is the basic statistic used to understand galaxy properties, giving the relative frequency of galaxies of a given luminosity in a given volume. Since starlight at 3.6 m very nearly follows the Rayleigh-Jeans limit of blackbody emission for K, the colors of both early- and late-type stars are similar. There is virtually no dust extinction at this wavelength either, since any standard extinction law predicts only a few percent of the extinction of optical wavelengths. The 3.6 m light therefore traces the stellar mass distribution free of dust obscuration effects (Pahre et al. 2004). Thus, a useful approach to understanding how galaxies form is to track their growing stellar mass, measured through the evolution of the 3.6 m LF.
Several studies found LF results consistent with the behavior of a simple, passive luminosity evolution model in which galaxies form all their stars at high redshift and thereafter passively evolve. However, seldom these studies address which models data exclude. What it actually interesting is whether some plausible scenario can be rejected by the data, because sometime a (wrong) scenario cannot be rejected simply because of the low information content of the data in hand. Furthermore, previous works rarely address the topic of sample representativity. Specifically, clusters in the sample are typical or atypical clusters? All types of clusters are included in the studied sample? Some type of cluster is over- or under- represented in the sample? The above questions are closely related to the following one: can a result found to hold on a sample of unknown representativity (the studied sample of clusters) be generalized to the parent distribution (i.e. to clusters)? Results obtained on uncontrolled sample rarely hold in general (and when they hold, they hold by good chance).
Throughout this paper we assume , and km s-1 Mpc-1.
2. Data & data reduction
IR data were obtained with the IRAC (Fazio et al. 2004) on the Spitzer Space Telescope (Werner et al. 2004). Optical data come from the wide field imager MOSAIC-II at the 4m CTIO. Details on data (and more) can be found in Andreon (2006).
3. The sample
The cluster sample studied in this paper consists of 32 colour–selected clusters, all spectroscopically confirmed. The availability of spectroscopic redshifts is an essential difference from some previous works having photometric redshift only. In works lacking a cluster spectroscopic confirmation, errors on LF parameters (and evolution) are unduly kept small by ignoring the uncertainty due to the contamination in the cluster sample by other, often only apparent, structures (e.g. line of sight superpositions). As shown in Yamada et al. (2005) with a few examples, this occurs frequently to works lacking a cluster spectroscopic confirmation. Working with spectroscopically confirmed clusters, we are not affected by the uncertainty due to unrelated structures entering in the sample. Furthermore, we are not affected by uncertainties on cluster distances that instead affect works using photometric redshifts.
The clusters were detected as spatially localized galaxy overdensities of similar optical colour, as described in Andreon et al. (2003; 2004a,b). The studied cluster sample is not a volume complete sample, nevertheless it densely samples the explored Universe volume, up to , that should make the studied sample representative of typical clusters, and our results of high generalization power.
Most of our clusters are at the bottom of the Abell richness scale and are not rich systems. This is unsurprisingly, because the mass (richness) function of clusters is steep. Instead, other samples studied in literature consider rich (and therefore rare) clusters, biasing the representativity of them with respect to clusters of modest richness and larger abundance.
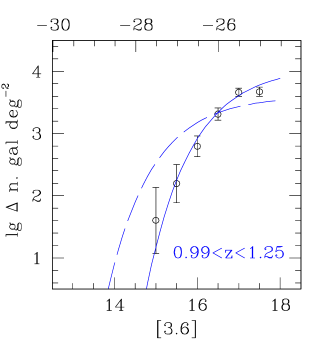
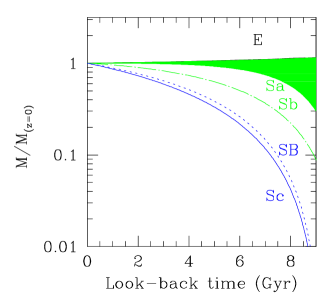
The 32 clusters are distributed in redshift as shown in Fig 1. In particular, 6 clusters have and 8 clusters have . These clusters are essential to discriminate among different histories of star formation and mass assembly, because over a short redshift range different histories do not differ too much (see right panel of Fig 2). To our best knowledge, no previous work scores better than our work in the number of clusters at or .
![[Uncaptioned image]](/html/astro-ph/0609662/assets/x1.png) Figure 1.: Redshift distribution of the studied clusters. Solid/open histograms mark
0.01/0.1 bin width in redshift.
Figure 1.: Redshift distribution of the studied clusters. Solid/open histograms mark
0.01/0.1 bin width in redshift.
4. The method: LF determination
The determination of the LF uses state of the art statistical methods: an improved likelihood function (Andreon, Punzi & Grado 2004) and Bayesian methods for model selection. Incongrounces, logical contradictions, circular arguments, arbitrary bins, unphysical values for quantities, all have been avoided by a rigorous statistical analysis (see Andreon et al. 2006 and Andreon 2006). For example, in order to determine our statistical analysis don’t oblige us to keep fixed the nuisance parameter , because unconstrained, as instead other analysis oblige. If is unconstrained, what statistical theorem allows other works to keep it to be a fixed (and arbitrary) value? By the way, keeping nuisance parameters fixed contradicts the sum rule of probabilities and underestimates the uncertainty on (the latter as re-discovered by Andreon 2004). Furtheremore, other works bin clusters in redshift bins, and forget to investigate whether the found/missed effect is related to some binning choices (bin size, bin location, sub-optimal binning strategy, etc.). Instead, we don’t bin clusters in redshift bins and therefore we are not affected by bin resolution/choice. The analysis also account for the younger age of the universe (and therefore of stars) at hight redshift. Full details are described in Andreon (2006), where a traditional analysis is also presented for old-fashioned readers.
Grasil (Silva et al. 1998) models are used to convert light in stellar mass and to convert apparent to absolute luminosities.
5. Results
Astronomical results are summarized in the abstract section. Shortly, only a model is viable for the evolution of cluster galaxies: a model in which there is almost no mass growth during the last two third of the universe age. All the remaining considered models are rejected by the data. Figure 2 is a pictorial excerpt of the results. A full report, including methodological details, is presented in Andreon (2006).
Acknowledgments.
We acknowledge financial contribution from contract ASI-INAF I/023/05/0
References
- Andreon (2003) Andreon, S. 2003, A&A, 409, 37
- Andreon (2004) Andreon, S. 2004, A&A, 416, 8
- Andreon (2006) Andreon, S. 2006, A&A, 448, 447
- (4) Andreon, S., Punzi, G., Grado, A., 2005, MNRAS, 360, 727
- Andreon et al. (2006) Andreon, S., Quintana, H., Tajer, M., Galaz, G., & Surdej, J. 2006, MNRAS, 365, 915
- Andreon et al. (2004a) Andreon, S., Willis, J., Quintana, H., Valtchanov, I., Pierre, M., & Pacaud, F. 2004a, MNRAS, 353, 353
- Andreon et al. (2004b) Andreon, S., Willis, J., Quintana, H., Valtchanov, I., Pierre, M., & Pacaud, F. 2004b, in the proceeding of ‘Rencontres de Moriond: Exploring the Universe. Contents and Structure of the Universe’ (astro-ph/0405574)
- Fazio et al. (2004) Fazio, G. G., et al. 2004, ApJS, 154, 10
- Yamada et al. (2005) Yamada, T., et al. 2005, ApJ, 634, 816
- Pahre et al. (2004) Pahre, M. A., Ashby, M. L. N., Fazio, G. G., & Willner, S. P. 2004, ApJS, 154, 235
- Silva et al. (1998) Silva, L., Granato, G. L., Bressan, A., & Danese, L. 1998, ApJ, 509, 103
- Werner et al. (2004) Werner, M. W., et al. 2004, ApJS, 154, 1